Working Paper Document
ECONOMIC IMPORTANCE OF
THE BELGIAN PORTS :
Flemish maritime ports, Liège port complex
and the port of Brussels – Report 2015
by Claude Mathys
Editor
Jan Smets, Governor of the National Bank of Belgium
Statement of purpose:
The purpose of these working papers is to promote the circulation of research results (Research Series) and analytical studies (Documents Series) made within the National Bank of Belgium or presented by external economists in seminars, conferences and conventions organised by the Bank. The aim is therefore to provide a platform for discussion. The opinions expressed are strictly those of the authors and do not necessarily reflect the views of the National Bank of Belgium.
Orders
For orders and information on subscriptions and reductions: National Bank of Belgium, Documentation - Publications service, boulevard de Berlaimont 14, 1000 Brussels
Tel +32 2 221 20 33 - Fax +32 2 21 30 42
The Working Papers are available on the website of the Bank: http://www.nbb.be
© National Bank of Belgium, Brussels
All rights reserved.
Reproduction for educational and non-commercial purposes is permitted provided that the source is acknowledged.
Abstract
This paper is an annual publication issued by the Microeconomic Analysis service of the National Bank of Belgium.
The Flemish maritime ports (Antwerp, Ghent, Ostend, Zeebrugge), the Autonomous Port of Liège and the port of Brussels play a major role in their respective regional economies and in the Belgian economy, not only in terms of industrial activity but also as intermodal centers facilitating the commodity flow.
This update paper1 provides an extensive overview of the economic importance and development of the Flemish maritime ports, the Liège port complex and the port of Brussels for the period 2010 - 2015, with an emphasis on 2015. Focusing on the three major variables of value added, employment and investment, the report also provides some information based on the social balance sheet and an overview of the financial situation in these ports as a whole. These observations are linked to a more general context, along with a few cargo statistics.
Annual accounts data from the Central Balance Sheet Office were used for the calculation of direct effects, the study of financial ratios and the analysis of the social balance sheet. The indirect effects of the activities concerned were estimated in terms of value added and employment, on the basis of data from the National Accounts Institute. As a result of the underlying calculation method the changes of indirect employment and indirect value added can differ from one another.
The developments concerning economic activity in the six ports in 2014 - 2015 are summarized in the table on the next page.
In 2015 the growth of maritime traffic in the Flemish maritime ports was due to developments in the port of Antwerp and the port of Ghent. Direct value added increased in all Flemish maritime ports in 2015. However, direct employment is continuing to decline. Investment was down everywhere except in the port of Zeebrugge.
Cargo traffic in the Liège port complex declined in 2015, whereas it slightly slowed down in the port of Brussels. At the same time, direct value added in Liège shrank while it rose sharply in the port of Brussels. By contrast, direct employment was down in both ports.
This report provides a comprehensive account of these issues, giving details for each economic sector, although the comments are confined to the main changes that occurred in 2015.
This report is available for download at the following address http://www.nbb.be.
Key words: branch survey, maritime cluster, subcontracting, indirect effects, transport, intermodality, public investments.
JEL classification: C67, H57, J21, L22, L91, L92, R15, R34 and R41.
1
Ports Value added (current prices)
Employment Investment
(current prices)
Cargo traffic
____
€ million Change 2014-2015 (in p.c.)
FTE
Change 2014-2015 (in p.c.)
€ million Change 2014-2015 (in p.c.)
x 1,000 tonnes
Change 2014-2015 (in p.c.)
ANTWERP Direct ...10,946.0 + 9.4 60,656 - 0.9 3,005.1 - 9.0
Indirect ...9,746.5 + 10.5 81,692 - 1.5
TOTAL ...20,692.6 + 9.9 142,348 - 1.3 3,005.1 - 9.0 208,425 + 4.7
GHENT Direct ...3,795.7 + 4.8 27,809 - 1.1 365.3 - 10.2
Indirect ...4,121.8 + 3.9 36,648 + 2.5
TOTAL ...7,917.5 + 4.3 64,457 + 0.9 365.3 - 10.2 26,362 + 1.8
OSTEND Direct ...508.3 + 1.6 4,993 - 1.4 61.5 - 49.4
Indirect ...396.8 + 6.4 4,463 - 0.1
TOTAL ...905.0 + 3.6 9,457 - 0.8 61.5 - 49.4 1,295 - 9.5
ZEEBRUGGE Direct ...975.7 + 2.8 9,268 - 1.9 260.9 + 14.4
Indirect ...881.9 + 2.8 9,968 - 1.9
TOTAL ...1,857.7 + 2.8 19,237 - 1.9 260.9 + 14.4 38,318 - 9.9
FLEMISH Direct ...16,225.7 + 7.6 102,727 - 1.1 3,692.8 - 9.0
MARITIME Indirect ...14,166.9 + 8.6 126,849 - 0.1
PORTS TOTAL ...30,392.6 + 8.1 229,576 - 0.5 3,692.8 - 9.0 274,400 + 2.1
LIÈGE Direct ...1,021.0 - 9.8 7,761 - 4.0 208.0 + 6.0
Indirect ...1,070.2 - 11.3 11,185 - 3.7
TOTAL ...2,091.2 - 10.6 18,946 - 3.8 208.0 + 6.0 14,605 - 2.6
BRUSSELS Direct ...772.8 + 58.4 4,159 - 0.5 55.0 + 3.8
Indirect ...471.8 + 38.1 3,851 + 1.3
TOTAL ...1244.6 + 50.0 8,011 + 0.3 55.0 + 3.8 4,364 - 1.7
BELGIAN Direct ...18,019.5 + 7.9 114,647 - 1.3 3,955.7 - 8.1
PORTS Indirect ...15,148.8 + 7.8 137,747 - 0.2
TOTAL ...33,168.3 + 7.8 252,394 - 0.7 3,955.7 - 8.1 293,369 + 1.7
Source: NBB (calculations based on the Belgian accounts filed with the Central Balance Sheet Office, and the Belgian IOTs). For ports with economic linkages between them, a portion of the indirect effect calculated by port is cancelled out when the calculation is done at a more aggregate level, i.e. for a group of ports. The sum of the indirect effects by port is thus greater than the total indirect effects calculated for the ports as a whole.
Corresponding author:
NBB, Microeconomic Information department, e-mail: claude.mathys@nbb.be
This paper was made with the technical support and the expertise of Mr Marc Van Kerckhoven.
Research results and conclusions expressed are those of the author and do not necessarily reflect the views of the National Bank of Belgium or any other institution to which the author is affiliated. All remaining errors are ours.
Contents
Foreword ... 4
Introduction ... 5
1 ECONOMIC IMPORTANCE OF THE BELGIAN PORTS... 8
1.1 Traffic in the Belgian ports ... 8
1.2 Competitive position of the Belgian ports ... 10
1.3 Direct and indirect value added in the Belgian ports... 12
1.4 Direct and indirect employment in the Belgian ports ... 14
1.5 Investment in the Belgian ports ... 15
1.6 Demography of the Belgian ports ... 16
1.7 Breakdown of the variables by company size ... 18
1.8 Social balance sheet in the Belgian ports ... 18
1.9 Financial ratios in the Belgian ports ... 21
1.10 Financial health in the Belgian ports ... 22
1.11 Relative importance of the components of value added ... 23
2 PORT OF ANTWERP ... 26
2.1 Port developments ... 26
2.2 Value added ... 27
2.3 Employment ... 27
2.4 Investment ... 28
3 PORT OF GHENT... 32
3.1 Port developments ... 32
3.2 Value added ... 32
3.3 Employment ... 33
3.4 Investment ... 33
4 PORT OF OSTEND ... 38
4.1 Port developments ... 38
4.2 Value added ... 38
4.3 Employment ... 38
4.4 Investment ... 39
5 PORT OF ZEEBRUGGE ... 43
5.1 Port developments ... 43
5.2 Value added ... 43
5.3 Employment ... 44
5.4 Investment ... 44
6 LIÈGE PORT COMPLEX ... 49
6.1 Port developments ... 49
6.2 Value added ... 49
6.3 Employment ... 49
6.4 Investment ... 50
7 PORT OF BRUSSELS ... 54
7.1 Port developments ... 54
7.2 Value added ... 54
7.3 Employment ... 54
7.4 Investment ... 55
8 BRIEF SUMMARY ... 59
ANNEX 1: LIST OF NACE-BEL BRANCHES ... 61
ANNEX 2: DEFINITION OF THE FINANCIAL RATIOS ... 66
BIBLIOGRAPHY ... 67
Foreword
Every year the National Bank of Belgium publishes an update of the study of the economic importance of the Flemish maritime ports, the Liège port complex and the port of Brussels. Two aspects of the sector’s economic impact are highlighted: the direct effects and the indirect effects. The former concerns the activities resulting from the presence of maritime and non-maritime enterprises and public services in or near the ports, while the latter relates to the value added and employment generated by suppliers and subcontractors serving these enterprises and based in Belgium.
The statistical data covers the period 2010 - 2015, but only the main developments recorded in the period 2014 - 2015 are discussed in detail. The number of annexes is limited to:
the list of NACE-BEL 2008 branches. the definition of the financial ratios.
The methodology remains mainly unchanged: the criteria for selecting firms and the analysis are the same as in previous editions. The NACE-BEL 2008 code is used to select and classify companies by sector. Owing to the use of the latest available statistical data (see introduction), the estimates of the indirect effects may differ from those in previous publications.
Introduction
Objectives of the study and some comments on the methodology
The economic importance of the ports examined is analysed from three angles, namely the purely economic angle, and the social and financial angles. The study only covers firms belonging to branches of activity which have an economic link with the ports. That link is defined in relation to both a functional and a geographical criterion.
The main developments in the period 2010 - 2015 concern the study of the following variables:
value added at current prices2: the value which a firm adds to its inputs during the financial year via the production process. The value added of a firm indicates its contribution to the wealth of the country or region (in percentages of GDP). In accounting terms, this is calculated as the sum of staff costs, depreciation and value adjustments, the operating profit or loss, provisions for liabilities and charges, and certain operating expenses;
employment in full-time equivalents (FTE): the average workforce during the financial year. Direct employment only covers employees on the payroll of the businesses and public services concerned, indirect employment also includes self-employed workers.
investment at current prices3: this corresponds to the tangible fixed assets acquired during the year, including capitalised production costs4.
The economic impact of the ports under review is described on the basis of these three variables. Employment and the social balance sheet are also taken into account in the analysis of the social impact. That section deals in particular with working time, staff costs, the extent to which use is made of external personnel, and the composition, movements and training of the labour force.
The financial analysis forms the third angle of the study; it is based on the examination of three financial ratios and a financial health indicator, using a model designed by the Bank5. The ratios in question are the return on equity after taxes, liquidity in the broad sense, and solvency. The current edition presents a financial analysis of Belgian ports taken as a whole. Readers wishing to compare the financial ratios of an individual company with its sector ratios can find this information in the company reports published by the Central Balance Sheet Office. These company reports are composed of five parts6, one of which is devoted to comparing the financial ratios of the company with those of its sector, and another of which is devoted to situating the company in one of the ten categories of financial health based on its composite financial health indicator. This comparison is more relevant than a comparison based principally on geographic location, which would include a variety of business activities. The financial health indicator is based on Belgian companies' annual accounts. This indicator is designed as a weighted combination of variables, created by means of a model constructed in the same way as a failure prediction model. The model takes the form of a logistic regression discriminating between failing and non-failing companies. The indicator summarizes each company’s situation in a single value which takes account simultaneously of the solvency, liquidity and profitability dimensions.
The current edition also presents an overview of the relative importance of the different components of value added for the year 2015.
2
Unless otherwise stated, the text always indicates value added at current prices. Developments at constant prices (by volume) are explicitly mentioned. Value added at constant prices is calculated by means of the deflator of gross domestic product. 3
Unless otherwise stated, investment is always indicated at current prices. Developments at constant prices (by volume) are explicitly mentioned. Investment at constant prices is calculated by means of the deflator of gross fixed capital formation. 4
Decommissioning of assets is not taken into account. 5
See Vivet D. (2011), Development of a financial health indicator based on companies’ annual accounts, NBB, Working Paper No. 213 (Document series), Brussels.
6
The microeconomic data used in this study were obtained from the annual accounts filed with the Central Balance Sheet Office7, from the statistics produced by the National Accounts Institute (NAI8) and to a lesser extent, from surveys. The most recent annual accounts for the 2015 financial year included in this study were filed with the Central Balance Sheet Office in January 20179. The data necessary to estimate the indirect effects up to 2015, are also published by the NAI with a low frequency and after a certain time lag. The results of the indirect effects are approximations and should be interpreted with caution. The latest updates were included in the calculations, while the methodology was refined. For more information, see the 2004 report published in June 200610.
The NACE-BEL 2008 classification is used for the purposes of selecting and ranking the companies by sector. NACE-BEL 2008 is the classification system for economic activities employed by the National Accounts Institute. The activity codes (NACE-BEL) for economic units have been harmonised between the institutions making up the NAI, which should help give a more accurate and up-to-date picture of economic reality.
In December 2013 the National Accounts Institute published an input-output table for 2010. In December 2015 the input-output table for 2010 was updated with the new accounting rules of the ESA 2010 standard11 and the harmonised NACE codes12. The latest supply and use table relates to the year 2013. These tables were used to produce estimates for the years 2010 to 2015. Indirect employment includes employees and self-employed persons, while direct employment mainly relates to employees. The reader must keep in mind that indirect effects need to be interpreted with caution, and should be regarded more as an indicator of the importance of the ports for the national and local economy rather than as an absolute value.
The indirect effects have been calculated for each port separately. For ports with economic linkages between them, a portion of the indirect effect calculated by port is cancelled out when the calculation is done at a more aggregate level, i.e. for a group of ports. The sum of the indirect effects by port is thus greater than the total indirect effects calculated for the ports as a whole.
As part of the strategic plans for the port areas, the Flemish Region has established several land banks. This acquired land is a compensation for land that disappears through the port development and includes other land or results from land exchanges with farmers concerned. In this publication, the amounts relating to these land banks are not included in the investments of the public sector. The investment by the public sector to improve the maritime access to the different Belgian ports is also not included.
Some of the results for years up to 2014 may differ from those stated in the earlier studies. That is due mainly to the availability of more accurate data on certain firms, information that is extrapolated into the past to ensure consistent time series. Moreover, the annual accounts of newly-created enterprises can only be recorded after a certain time lag.
7
A service of the National Bank’s Microeconomic Information Department. (See http://www.centralbalancesheetoffice.be). 8
The National Accounts Institute (NAI) set up by the law of 21 December 1994, links three institutions: the National Statistical Institute (NSI, now FPS Economy, SMEs, Self-employed and Energy – Statistics Belgium), the National Bank of Belgium and the Federal Planning Bureau. The NAI’s duties include drawing up the real national accounts and the input-output tables which are needed to estimate the indirect effects. The latest available data for calculating the indirect effects in this study were the input-output table for 2010 and the supply and use table for 2013.
9
Belgian firms are required to submit their annual accounts to the Central Balance Sheet Office by no later than seven months following the end of the financial year. A small proportion of firms -mainly small businesses or those in difficulties- fail to meet the obligation by that date. In January 2017, that percentage was negligible and the impact on the figures is minimal.
10
The methodology is presented in the introduction by Lagneaux F. (2006) and set out in full in annexes 1 to 4. The study is available on the following address: http://www.nbb.be > Publications and research > Economic/financial publications > Working papers > 2006 – No. 86.
11
Eurostat has formulated the European System of National and Regional Accounts (ESA) to provide a systematically detailed description of the EU economies, their components and relations with the other economies. The ESA is therefore used as the central reference point for the economic and social statistics of the EU and its member states. The international systems of national accounts are revised from time to time to cater for new statistical requirements called for in response to changes in the contemporary economies and reflecting methodological developments.
12
For a number of years, the National Bank’s port studies have been an important statistical source for the various stakeholders concerned with their economic analysis. Since most port authorities and various government bodies provide detailed accounts of maritime activities, the Bank sought scope for efficiency and synergy. For that reason, this publication will place more emphasis on the statistical section. The commentary will give the general outline via the contribution from the port authorities. For the more detailed, comprehensive account of developments, see the annual reports of the Belgian port authorities and specialised publications such as those issued by the Flemish Port Commission.
International environment
The International Monetary Fund13 estimates global output growth for 2016 at 3.1%, slightly down from 2015, as output has shrunk markedly in the advanced economies, which are still suffering from the aftermath of the financial crisis and are faced with sluggish productivity. Output in the United States rocketed in the third quarter after a poor first quarter. In Europe, on the other hand, the production tool still is not working at full capacity. Output growth in developing countries and emerging markets, however, has remained stable. China’s economy, while remaining largely above 6%, continues to decelerate as a result of its rebalancing act. Commodity-exporting countries in the emerging markets have reduced their investments. The recession in Russia has lingered on in 2016, though it was less pronounced than in 2015.
The World Trade Organization14 estimates world trade volume growth for 2015 at 2.7%. 2015 marked the fourth consecutive year with trade volume growth below 3%. The WTO notes that the volume of exchanges decreased sharply in the first quarter of 2015, but this trend was reversed towards the end of the year. Factors explaining the weakness in trade in 2015 include the economic slowdown in China, the recession in Brazil, falling prices for oil and other commodities, and exchange rate volatility.
The world fleet grew by 3.5% in 201515. While this percentage marks a sharp decline compared to the past years, it is still higher than the rise in demand and therefore does not reduce overcapacity. Such overcapacity, combined with weak demand, caused most shipping segments, except tankers, to suffer historic low levels of freight rates. Shipping companies are therefore maintaining their cost-saving measures such as slow steaming, consolidation and integration, and restructuring within new alliances.
The share of dry cargo shipments in world seaborne trade was 70.7% of total goods loaded during the year 2015. This type of transport, which had still increased by 5% in 2014, rose by a markedly lower 1.2%. Shipment for the five main dry bulk cargo categories (iron ore, coal, grain, bauxite and alumina and phosphate rock) dropped by 1.3%. In this list, grain trade increased by 4.9% and bauxite by 18.1%, but coal shipping decreased by 6.9%. Minor bulk commodities increased by 1.5%, thanks to the rise in manufactures and agribulk. Growth of manufactures was supported inter alia by increasing export of steel products from China. Over a year, growth in container shipping, which accounts for two thirds of other dry freight, slipped from 6.1% to 2.9%. One reason for this slowdown is the weakness in intra-Asian trade and exchanges between East Asia and Europe. The liquid bulk industry, on the other hand, had an excellent year. After two years of contraction, crude oil shipping rose by 3.8%. This turnaround can be explained by a recovery in demand, strong supply, low prices, the rise in processing capacity in refineries and improvement in their margin, and an increase in storage capacities. 2015 was also the year during which the United States Congress lifted the ban on US oil exports. In 2015, growth in shipping of oil products and gas accelerated, reaching 5.2%. Shipping of liquefied natural gas, which accounts for a third of global trade in natural gas, grew much more modestly partly due to contraction of imports of gas into Japan, the Republic of Korea and China.
13
IMF, World Economic Outlook (16 January 2017), Washington DC, 14
WTO, World Trade Statistical Review 2016, Geneva. 15
1 ECONOMIC IMPORTANCE OF THE BELGIAN PORTS
1.1 Traffic in the Belgian ports
CHART 1 CARGO TRAFFIC IN THE BELGIAN PORTS
(indices 2010 = 100)
Sources: Port Authorities.
Maritime shipping in the Flemish maritime ports increased by 2% in 2015, but not all ports experienced a rise in their volume of transhipped cargo: the ports of Antwerp and Ghent are enjoying higher volume, while the ports of Ostend and Zeebrugge are declining. The latter was affected by reorganisation and the withdrawal of major shipping lines. However, Zeebrugge to Scandinavia traffic volumes were up sharply. Facing a regional decline in activity in the public works sector, the port of Ostend recorded a reduction in dry bulk cargo. By contrast, the port of Antwerp saw an increase in traffic for all types of cargo. Developments in the port of Ghent are more heterogeneous, but have still led to growth in transhipment.
Inland waterway tonnages in the port of Brussels and in the Liège port complex16 decreased slightly.
Regarding Flemish maritime ports, transhipment of containers increased solely in the port of Antwerp. The ports of Ghent and Zeebrugge recorded a strong decline. One reason for such weakening was the withdrawal from the port of Zeebrugge of the 2M Alliance between shipping companies Maersk and MSC. In the port of Ghent, the suspension of the sole Ghent-Zeebrugge container ship line led to a drop in the volume of containers handled. In spite of a weaker fourth quarter, 2015 has been an excellent year as far as container loading and unloading in the port of Antwerp is concerned. Growth stood at 7.5% in TEU and at 4.6% in tonnes, which is remarkable, considering that overall, the year was rather grim for the industry. The number of ships over 13,000 TEU that called the port of Antwerp increased by 36%.
The port of Ghent is the only one to have experienced a decline in its roll-on/roll-off traffic, though it must be added that it had reached a record high the year before. With almost 4%17, the port of Antwerp recorded the strongest growth between 2014 and 2015. The port of Zeebrugge remains above the 13
16
The traffic considered here is the total of the cargo handled on the public and the private quays. As from 2015 the traffic of the Liège Port Complex will only include the public quays. The private quays are gradually managed by the Autonomous Port of Liège
17
Roll-on roll-off containers excluded. 0
10 20 30 40 50 60 70 80 90 100 110 120 130 140 150
2010 2011 2012 2013 2014 2015
million ton mark. In 2015, it strengthened its position as the world's largest maritime port in terms of new cars with over 2.4 million units transhipped in one year.
Conventional, i.e. non-containerised general cargo, was up 3.3% in 2015. The port of Antwerp recorded a moderate growth of 1.3%. The port of Ghent, for its part, rose by more than 12%, thus setting a new record. In 2015, the volume of conventional cargo loaded and unloaded in the port of Zeebrugge contracted slightly, among others because part of the paper pulp loadings are now transported in containers.
Liquid bulk increased in the ports of Antwerp, Ghent and Zeebrugge. The most remarkable rise was recorded in Ghent, where it reached 9.1%. After a three-year decline, the port thus managed to reverse the trend, as did the port of Zeebrugge, which succeeded in curbing the bearish tendency observed over the previous three years. By contrast, the port of Antwerp sustained its momentum and recorded a rise for the third year in a row. Overall, transhipment of liquid bulk in Flemish ports increased by 5.9% in one year.
With a 0.8% rise, dry bulk increased in a more moderate way in the Flemish ports. In 2015, after a sharp decline in 2013 and a milder one in 2014, the port of Antwerp recorded a 2.1% rise in loaded and unloaded dry bulk. The volume of dry bulk transhipped in the port of Ghent did not vary much between 2014 and 2015. Nevertheless, Ghent remains the first Flemish port in this field. Thanks to the loading and unloading of sand and gravel as well as agribulk, the Port of Zeebrugge reported a strong growth. The port of Ostend is the only Flemish port which saw a decrease in its dry bulk traffic; the main cause is the regional drop in activity in the public works sector.
TABLE 1 MARITIME TRAFFIC IN THE FLEMISH PORTS IN 2015
(in thousands of tonnes, unless otherwise stated)
Antwerp Ghent Ostend Zeebrugge Total Change from 2014 to 2015
(in p.c.)
Share in 2015 (in p.c.)
Containers ... 113,295 258 0 15,625 129,177 - 0.1 47.1
Change 2014 - 2015 (p.c.) ... + 4.6 - 37.7 n. - 23.8
Roll-on/roll-off18 ... 4,654 2,079 0 13,451 20,183 + 2.6 7.4
Conventional general cargo19 ... 10,005 3,564 43 1,174 14,786 + 3.3 5.4
Liquid bulk ... 66,685 3,721 29 6,754 77,189 + 5.9 28.1
Dry bulk ... 13,786 16,740 1,223 1,315 33,064 + 0.8 12.0 TOTAL 2015 ... 208,425 26,362 1,295 38,318 274,400 + 2.1 100.0
Change 2014 - 2015 (p.c. ) ... + 4.7 + 1.8 - 9.5 - 9.9 + 2.1
TOTAL 2016 (p.m.) ... 214,170 29,087 1,464 37,813 282,535
Change 2015 - 2016 (p.c. ) ... + 2.8 + 10.3 + 13.1 - 1.3 + 3.0
Source: Port authorities and Flemish Port Commission.
In 2015, waterway traffic in the Liège port complex was down by 2.6%20. The rise in transhipped volumes of coke and petroleum products, quarry products, secondary raw materials and waste did not manage to fully compensate for the drop in volumes of agricultural products, coal and lignite, and chemicals. Another highlight in the port's activity is a 27% rise in its container traffic in TEU.
In 2015, waterway traffic in the port of Brussels showed a 1.7% decline. This decrease comes mainly from the drop in tonnages of construction sites land removal, as no dredging work has been carried out in Brussels in 2015. However, the Port of Brussels remarks that diversification of traffic types is sending out positive signals, with very strong growth in container and pallet transportation.
18
Abbreviated as RoRo. Horizontal handling of goods using wheeled equipment inside and outside the ship, unlike LoLo (lift on/ lift-off), which entails vertical handling. The RoRo data presented in this report do not take into account containerised cargo, this category of goods being included in the line entitled "containers".
19
The term "general cargo" comprises the following categories: containerised goods, RoRo and conventional general cargo. 20
1.2 Competitive position of the Belgian ports
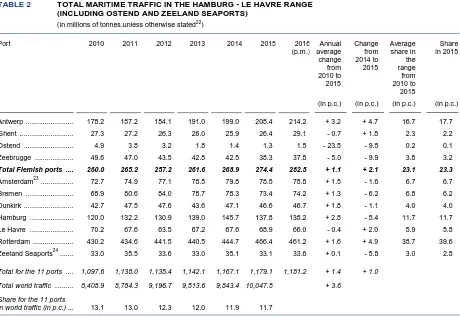
[image:12.595.59.519.141.458.2]In order to refine the analysis of the competitive position of the Flemish maritime ports, all cargo traffic is compared with that of the other ports in the Hamburg - Le Havre range21. The share of the four Flemish ports in that range increased slightly in 2015 from 23.0 to 23.3 %.
TABLE 2 TOTAL MARITIME TRAFFIC IN THE HAMBURG - LE HAVRE RANGE (INCLUDING OSTEND AND ZEELAND SEAPORTS)
(in millions of tonnes,unless otherwise stated22)
Port 2010 2011 2012 2013 2014 2015 2016
(p.m.) Annual average change from 2010 to 2015
Change from 2014 to 2015
Average share in the range from 2010 to
2015
Share in 2015
(in p.c.) (in p.c.) (in p.c.) (in p.c.)
Antwerp ... 178.2 187.2 184.1 191.0 199.0 208.4 214.2 + 3.2 + 4.7 16.7 17.7 Ghent ... 27.3 27.2 26.3 26.0 25.9 26.4 29.1 - 0.7 + 1.8 2.3 2.2 Ostend ... 4.9 3.8 3.2 1.8 1.4 1.3 1.5 - 23.5 - 9.5 0.2 0.1 Zeebrugge ... 49.6 47.0 43.5 42.8 42.5 38.3 37.8 - 5.0 - 9.9 3.8 3.2
Total Flemish ports ... 260.0 265.2 257.2 261.6 268.9 274.4 282.5 + 1.1 + 2.1 23.1 23.3
Amsterdam23 ... 72.7 74.9 77.1 78.5 79.8 78.5 78.8 + 1.5 - 1.6 6.7 6.7 Bremen ... 68.9 80.6 84.0 78.7 78.3 73.4 74.2 + 1.3 - 6.2 6.8 6.2 Dunkirk ... 42.7 47.5 47.6 43.6 47.1 46.6 46.7 + 1.8 - 1.1 4.0 4.0 Hamburg ... 120.0 132.2 130.9 139.0 145.7 137.8 138.2 + 2.8 - 5.4 11.7 11.7 Le Havre ... 70.2 67.6 63.5 67.2 67.6 68.9 66.0 - 0.4 + 2.0 5.9 5.8 Rotterdam ... 430.2 434.6 441.5 440.5 444.7 466.4 461.2 + 1.6 + 4.9 38.7 39.6 Zeeland Seaports24 ... 33.0 35.5 33.6 33.0 35.1 33.1 33.6 + 0.1 - 5.8 3.0 2.8
Total for the 11 ports ...1,097.6 1,138.0 1,135.4 1,142.1 1,167.1 1,179.1 1,181.2 + 1.4 + 1.0
Total world traffic ...8,408.9 8,784.3 9,196.7 9,513.6 9,843.4 10,047.5 + 3.6
Share for the 11 ports
in world traffic (in p.c.) ... 13.1 13.0 12.3 12.0 11.9 11.7
Sources: For the traffic in the range: port authorities; for world traffic (tonnes loaded): Unctad, Review of Maritime Transport 2016.
The port of Rotterdam recorded a 4.9% increase in transhipped volumes. This rise comes mainly from the loading and unloading of crude oil and petroleum products, which grew by 8.1% and 18% respectively. The total amount of liquid bulk increased by 10.9%, representing 48% of total traffic in the port in 2015. By contrast, dry bulk and container traffic decreased by around 1%. After a rise in 2014, the transhipped volume of conventional general cargo decreased by 5.5%. Roll-on/roll-off traffic, on the contrary, increased by 10.1%.
The port of Hamburg saw its traffic decrease by 5.4% in 2015. Imports declined slightly less than exports. Both agribulk and grab cargo has increased whereas liquid cargo was slightly down. Massive imports of coal boosted the grab cargo segment. The conventional general cargo handling decreased by 14.1%; the decline was mainly with export. Transhipment of containers decreased sharply in 2015 (-9.3%). The port of Hamburg was affected by the decline in trade with China and Russia. Moreover, transhipment of containers towards Poland contracted as well.
The port of Amsterdam experienced mixed fortunes depending on the type of cargo. Regarding liquid bulk, transhipment of petroleum products grew by 1.1% and that of other liquid bulk cargo by 11.9%. Regarding dry bulk cargo, however, transhipment of coal declined by 10.7%, that of fertilizer by 8.8%
21
For the purposes of this study, the range comprises the ports of Hamburg, Bremen, Amsterdam, Rotterdam, the Zeeland Seaports complex (ports of Terneuzen and Flessingue), Antwerp, Ghent, Zeebrugge, Ostend, Dunkirk and Le Havre.
22
In principle, maritime traffic excludes bunkering. However, some ports’ traffic figures do include bunkering, which may lead to minor differences in mutual comparisons.
23
The figures stated here refer to the port of Amsterdam only, and not the entire complex which also includes the ports of Beverwijk, Velsen/IJmuiden and Zaanstad.
24
and that of agribulk by 5.4%. Other dry bulk cargo, on the contrary, increased by 12.8%. Loading and unloading of containers (in volume) contracted by 2.4%, and ro-ro, automobiles and other mixed cargo declined by 8.7%. Overall, traffic in the port of Amsterdam decreased by 1.6%.
The port of Bremen recorded a 6.2% drop in its traffic. This decline occurred in container transportation and general cargo. By contrast, bulk transportation increased slightly thanks to liquid bulk. In the general cargo category, transhipment of vehicles, steel products and fruits declined while that of wood products was on the rise. In the dry bulk category, food products, coal and coke are significantly decreasing. As far as the origin and destination of cargo in container traffic in TEU is concerned, the top 5 partner countries experienced mixed developments; trade with the United States of America, China and Poland is declining while trade with Russia and Finland is steady.
Overall, 2015 was a good year for the port of Le Havre: its traffic increased by 2%. Although container loading and unloading decreased by 2.3%, the port of Le Havre remains the leading French container port. Processed volumes of roll-on/roll-off and other cargo also declined. As regards liquid bulk, however, volumes increased by 5.7%; crude oil rose by 7.2%, petroleum products by 3.3% and other liquid bulk by 5.5%. The rise in saturated gaseous hydrocarbons was more limited (0.7%). As regards dry bulk, the sharp increase in transhipped volumes of coal, cement and others widely compensated the contraction in volumes of sand, gravel and stones, thus enabling a 6.5% rise.
In 2015, the port of Dunkirk saw a slight contraction in its traffic (-1.1%). Several cargo segments are decreasing: hydrocarbons, other liquid bulks, coal, ore and small solid bulks. The drop in these last two categories originates in the damage from the storm that hit the port in 2014 and the maintenance closure of a blast furnace by ArcelorMittal during the last five months of the year. In contrast, volumes of steel products are increasing, as is roll-on/roll-off and container traffic. Cereals set a new record with more than 3 million tonnes of transhipped cargo.
Zeeland Seaports saw a sharp decrease in its traffic in the first semester of 2015. This decline could
[image:13.595.74.543.498.635.2]not entirely be compensated for in the second semester, and the annual figures for transhipped volumes dropped by 5.8%. According to Zeeland Seaports, this decrease is the consequence of the sluggish economic environment, low oil and petroleum products prices and maintenance works in the port's firms that had been planned for a long time. The port also noted that supply by inland waterways is replacing maritime supply. Loading and unloading of dry bulk, liquid bulk and roll-on/roll-off strongly contracted, while general cargo, containers included, increased.
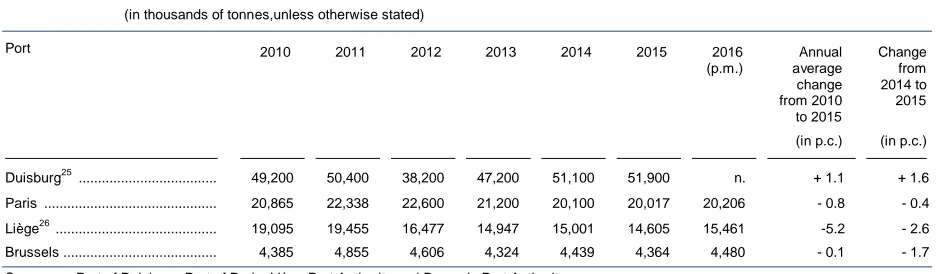
TABLE 3 CARGO TRAFFIC BY SHIP IN THE PORTS OF DUISBURG, PARIS, LIÈGE AND BRUSSELS
(in thousands of tonnes,unless otherwise stated)
Port 2010 2011 2012 2013 2014 2015 2016
(p.m.)
Annual average change from 2010 to 2015
Change from 2014 to
2015
(in p.c.) (in p.c.)
Duisburg25 ... 49,200 50,400 38,200 47,200 51,100 51,900 n. + 1.1 + 1.6
Paris ... 20,865 22,338 22,600 21,200 20,100 20,017 20,206 - 0.8 - 0.4
Liège26
... 19,095 19,455 16,477 14,947 15,001 14,605 15,461 -5.2 - 2.6 Brussels ... 4,385 4,855 4,606 4,324 4,439 4,364 4,480 - 0.1 - 1.7
Sources: Port of Duisburg,Port of Paris, Liège Port Authority and Brussels Port Authority.
The public ports of the Port of Liège recorded a waterway traffic of 14.6 million tonnes for 2015. In public ports, transhipment of non-metallic mineral products, secondary raw materials and wastes, petroleum products and other cargo/containers increased significantly. By contrast, coal, products of agriculture and chemical products are declining. According to the Port of Liège, these developments
25
The traffic considered here is the total of the cargo handled in all Duisburg Ports, thus, totalling the Duisport Group and the private company ports.
26
originate from the particularly mild 2014/2015 winter and Biowanze's more local cereal supply, leading to an increased use of the road. Considering the origin and destination of cargo, after Belgium, the Netherlands is the first partner region for waterway trade.
With a 1.7% drop, waterway traffic in the Port of Brussels is getting closer to the 2013 figures. The absence of dredging work in 2015 partly explains this decline. Similarly, tonnages of construction sites land removal also contracted. However, 2015 is a record year for containerised traffic, with a 67% and a 56% rise respectively in transhipped volume and container traffic in TEU. Nevertheless, the leading category of cargo transported by waterway remains building materials. The 17% rise in petroleum products imports is also noteworthy.
In 2015, the ports of Duisburg recorded a 1.6% increase in its waterway traffic. The Port notes that the main drivers in 2015 were segments mineral oils, chemical products and combined transportation/container handling. Container handling via ship, train or lorry in the duisport Group expanded by 6%. In light of the current economic situation and commercial trade between Europe and Asia, duisport does not expect to see a significant rise in its traffic in 2016.
Ports de Paris saw its waterway traffic increase slightly in 2015, thus staying above the 20 million transhipped tonnes mark. The agri-food sector and the environment and steel products branch contributed to this positive development. The 19.6% increase in the volume of agri-food products can be explained partly by problems of road congestion, significant volumes of export and the opening of a new grain terminal. In the environment and recycling branch, landfill disposal grew by 15%. The building and publics works category, however, declined by 3.9% due to the drop in public procurements for roadworks and in Île-de-France production of ready-mixed concrete. Finally, the number of containers handled in Île-de-France contracted in 2015.
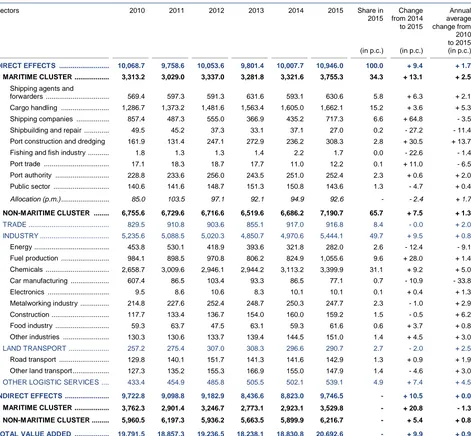
1.3 Direct and indirect value added in the Belgian ports
The direct value added produced in the Belgian ports increased strongly in 2015. Except for the Liège port complex, all the ports took part in that growth, with the ports of Antwerp and Brussels recording the sharpest increases.
In the port of Antwerp, both the maritime cluster and the non-maritime cluster recorded growth of direct value added. The segments contributing the most to that growth were shipping companies, fuel production and chemicals.
The port of Ghent’s increase in value added came from the non-maritime cluster, and more particularly the metalworking industry and chemicals segments.
In contrast, direct value added in the ports of Ostend and Zeebrugge increased in the maritime cluster and declined in the non-maritime cluster. In the port of Ostend, value added in the non-maritime cluster declined in the trade, industry and other logistic services segments. The maritime cluster benefited in particular from the increased value added in the port construction and dredging segment. In the port of Zeebrugge, value added declined in the land transport and industry segments, notably in the energy segment, whereas a number of maritime activities recorded an increase in value added.
In the Liège port complex, direct value added showed a marked fall in the non-maritime cluster; the segments with the biggest loss of value added were the energy, chemicals and construction segments. Conversely, the maritime cluster recorded a rise.
In the port of Brussels, direct value added increased in both the maritime cluster and the non-maritime cluster. The maritime cluster owes its growth to the port authority segment. In the non-maritime cluster, the segments trade, industry, land transport and other logistic services all expanded. However, the biggest rise in value added occurred in the other logistic services segment.
Analysis of direct value added per segment taking all the ports together reveals that the segments shipping companies, port construction and dredging, fuel production, chemicals and metalworking industry recorded the largest increases in value added (in absolute terms) while the energy segment saw the sharpest fall. The maritime and non-maritime clusters both expanded, but the land transport segment declined.
keep in mind that indirect effects must be cautiously handled, more as an indicator of the importance of the ports for the national and local economy than as an absolute value.
In 2015 direct value added of the Belgian ports accounted for 4.4% of Belgium’s GDP (and 8.1% including indirect value added).
TABLE 4 VALUE ADDED IN THE BELGIAN PORTS
(in € million - current prices)
2010 2011 2012 2013 2014 2015 Relative share in
2015
Change from 2014 to 2015
Annual average change from 2010
to 2015 (in p.c.) (in p.c.) (in p.c.)
_______________________ ____________________ _____________________ _____________________ ____________________ _____________________ ________________________ ____________________ ___________________________
1. DIRECT EFFECTS ... 16,742.6 16,505.8 16,422.2 16,367.8 16,701.5 18,019.5 100.0 + 7.9 + 1.5 Antwerp ... 10,068.7 9,758.6 10,053.6 9,801.4 10,007.7 10,946.0 60.7 + 9.4 + 1.7 Ghent ... 3,369.0 3,356.6 3,198.4 3,402.2 3,623.6 3,795.7 21.1 + 4.8 + 2.4 Ostend ... 498.0 472.0 488.6 489.4 500.4 508.3 2.8 + 1.6 + 0.4 Zeebrugge ... 959.5 979.1 947.6 982.8 949.5 975.7 5.4 + 2.8 + 0.3 Liège ... 1,310.5 1,413.4 1,185.6 1,201.5 1,132.4 1,021.0 5.7 - 9.8 - 4.9 Brussels ... 536.8 526.1 548.3 490.4 487.9 772.8 4.3 + 58.4 + 7.6
Outside the ports (p.m)27 ... 114.4 135.3 130.8 125.9 134.2 135.7 - + 1.2 + 3.5
2. INDIRECT EFFECTS ... 14,374.3 13,839.8 13,717.6 13,486.9 14,057.9 15,148.8 - + 7.8 + 1.1
TOTAL VALUE ADDED ... 31,116.9 30,345.6 30,139.8 29,854.8 30,759.4 33,168.3 - + 7.8 + 1.3
Source: NBB (calculations based on the Belgian accounts filed with the Central Balance Sheet Office, and the Belgian IOTs).
The data necessary to estimate the indirect effects are published by the NAI with a low frequency and after a certain time lag. The indirect effects for the period 2010-2015 are based on IOT 2010 and SUT 2010, 2011, 2012 and 2013. The calculated indirect effects are approximations and should be interpreted with caution.
CHART 2 CHANGE IN DIRECT VALUE ADDED
(in € million, current prices)
Source: NBB (calculations based on the Belgian accounts filed with the Central Balance Sheet Office).
27
The firms in certain maritime branches may be selected from anywhere in the country, since their definition is sufficient in itself to link them to the port activity. These are branches directly connected with the activity of the sea ports. Their results are therefore allocated among the Flemish ports, using the formula for the allocation of value added per branch. For each year and for each branch, this formula is calculated on the basis of the ratio between the direct value added generated in a given Flemish port and the direct value added generated in all the Flemish maritime ports. The line "Outside the ports (p.m.)" included in the tables 4, 5 and 6 collates these data, which are also allocated respectively in the tables showing value added, employment and investment in chapters 2 to 5 on the line entitled "Allocation (p.m.)".
-1.000 -500 0 500 1.000 1.500 2.000
2011 2012 2013 2014 2015
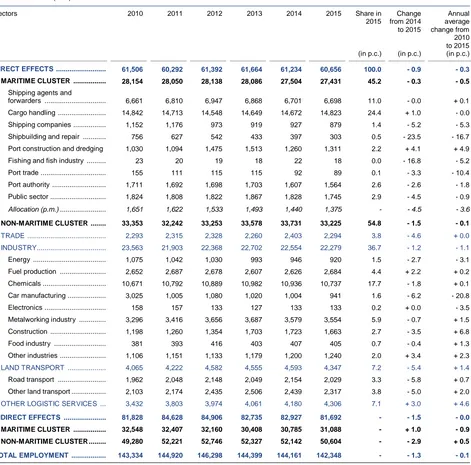
1.4 Direct and indirect employment in the Belgian ports
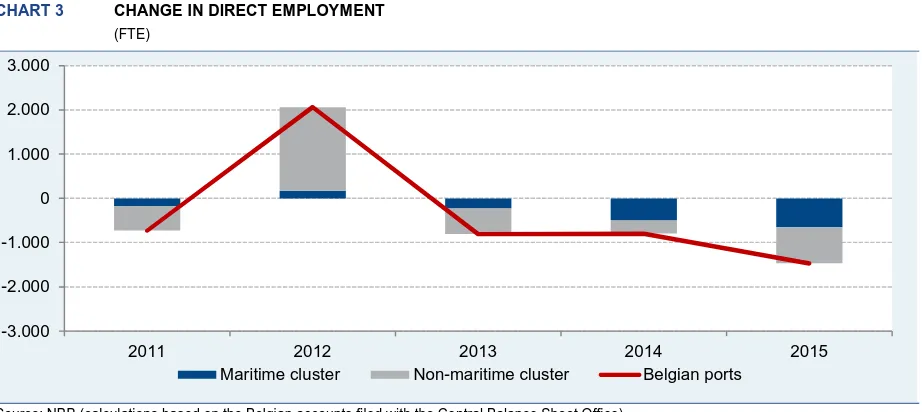
In contrast to direct value added, direct employment in the Belgian ports has declined. Unusually, all the ports are affected by that contraction; the Liège port complex felt the biggest impact with a 4% fall.
Direct employment in the maritime cluster and in the non-maritime cluster declined in the port of Antwerp. In the maritime cluster, there was an increase in full-time equivalents in the cargo handling segment and port construction and dredging and a reduction in the shipbuilding and repair and in the public sector segments. In the non-maritime cluster, the most noticeable job losses were in the land transport, chemicals and trade segments.
The port of Ghent recorded a sharp fall in direct employment in the maritime cluster and recruitment in the non-maritime cluster. The most dramatic job losses were in the cargo handling segment, although that concerned the transfer of staff to a car manufacturer based in the port. That also explains the strong growth in the car manufacturing segment. The trade segment also lost a large number of full-time equivalents whereas the shipbuilding and repair segment recorded strong growth.
Direct employment in the maritime and non-maritime clusters in the ports of Ostend and Zeebrugge has declined. The port of Ostend recorded substantial job losses in the metalworking industry segment, while the port of Zeebrugge saw the main job losses in the road transport and in the public sector segments. In contrast, the cargo handling segment recorded the highest level of recruitment in the port of Zeebrugge.
Direct employment in the Liège port complex was down slightly in the maritime cluster but fell sharply in the non-maritime cluster; the biggest job losses in terms of full-time equivalents occurred in the metalworking industry segment.
Direct employment in the port of Brussels declined in the maritime cluster but remained stable in the non-maritime cluster, thanks to recruitment in the trade and road transport segments, which offset the job losses in the industry and other logistic services segments.
Taking all the ports together and excluding the large-scale transfer of workers between two segments in the port of Ghent, the highest job losses occurred in the public sector, trade, chemicals, the metalworking industry and road transport segments. Few segments are expanding: port construction and dredging, fishing, fuel production, electronics, food industry and other logistic services.
TABLE 5 EMPLOYMENT IN THE BELGIAN PORTS
(FTE)
2010 2011 2012 2013 2014 2015 Relative share in
2015
Change from 2014 to 2015
Annual average change from 2010
to 2015 (in p.c.) (in p.c.) (in p.c.)
_______________________ _____________________ _____________________ _____________________ ____________________ _____________________ __________________________________________________ ____________________ ___________________________
1. DIRECT EFFECTS ... 116,404 115,671 117,729 116,917 116,116 114,647 100.0 - 1.3 - 0.3 Antwerp ... 61,506 60,292 61,392 61,664 61,234 60,656 52.9 - 0.9 - 0.3 Ghent ... 25,822 26,510 27,120 27,415 28,111 27,809 24.3 - 1.1 + 1.5 Ostend ... 4,906 4,735 5,118 5,059 5,063 4,993 4.4 - 1.4 + 0.4 Zeebrugge ... 10,249 10,076 9,967 9,735 9,443 9,268 8.1 - 1.9 - 2.0 Liège ... 9,670 9,746 9,551 8,864 8,082 7,761 6.8 - 4.0 - 4.3 Brussels ... 4,250 4,313 4,580 4,181 4,182 4,159 3.6 - 0.5 - 0.4
Outside the ports (p.m.)28 .. 2,230 2,173 2,135 2,063 2,003 2,005 - + 0.1 - 2.1
2. INDIRECT EFFECTS ... 136,445 139,229 141,796 138,181 137,972 137,747 - - 0.2 + 0.2
TOTAL EMPLOYMENT ... 252,849 254,900 259,524 255,098 254,087 252,394 - - 0.7 - 0.0
Source: NBB (calculations based on the Belgian accounts filed with the Central Balance Sheet Office, and the Belgian IOTs).
The data necessary to estimate the indirect effects are published by the NAI with a low frequency and after a certain time lag.The indirect effects for the period 2010-2015 are based on IOT 2010 and SUT 2010, 2011, 2012 and 2013. Indirect employment includes employees and self-employed persons, while direct employment mainly relates to employees. The calculated indirect effects are approximations and should be interpreted with caution.
28
CHART 3 CHANGE IN DIRECT EMPLOYMENT
(FTE)
Source: NBB (calculations based on the Belgian accounts filed with the Central Balance Sheet Office).
Indirect employment was slightly down. However, the reader must keep in mind that indirect effects must be cautiously handled, more as an indicator of the importance of the ports for the national and local economy than as an absolute value.
The share of port jobs in total Belgium employment came to 2.8% for direct employment and 6.2% for total employment in 2015.
1.5 Investment in the Belgian ports
[image:17.595.79.540.68.274.2]Direct investment in the Belgian maritime ports declined by 8.1%. Three ports recorded a fall in their investment: Antwerp, Ghent and Ostend. For the port of Ostend, 2014 had been a rather exceptional year, but the drop in 2015 took investment in the port to its lowest level in six years. The port of Antwerp had also scored a record in 2014, but as the decline in 2015 was not as steep as in the port of Ostend, the amount invested in 2015 was still very high. The port of Ghent recorded its third consecutive year of reduction. In the other three ports - Zeebrugge, Liège and Brussels – investment increased. The port of Brussels had seen a sharp fall in investment in 2014; in 2015, investment showed a slight increase. After two years of decline, the Liège port complex reversed the trend with 6% growth. Conversely, the port of Zeebrugge recorded a second year’s increase despite a difficult context in terms of traffic.
TABLE 6 INVESTMENT IN THE BELGIAN PORTS29
(in € million - current prices)
2010 2011 2012 2013 2014 2015 Relative share in
2015
Change from 2014 to 2015
Annual average change from 2010
to 2015 (in p.c.) (in p.c.) (in p.c.)
______________________ _____________________ _____________________ ____________________ ____________________ _____________________ _________________________ ________________________ ____________________________
Antwerp ... 2,523.8 2,405.1 2,324.0 2,362.6 3,300.6 3,005.1 76.0 - 9.0 + 3.6 Ghent ... 501.8 444.9 459.5 420.9 406.8 365.3 9.2 - 10.2 - 6.2 Ostend ... 107.4 91.7 97.2 77.9 121.6 61.5 1.6 - 49.4 - 10.5 Zeebrugge ... 343.1 296.5 258.6 221.4 228.0 260.9 6.6 + 14.4 - 5.3 Liège ... 186.5 199.1 241.1 213.7 196.3 208.0 5.3 + 6.0 + 2.2 Brussels ... 66.0 52.1 52.0 68.5 53.0 55.0 1.4 + 3.8 - 3.6
Outside the ports (p.m.)30 ... 454.0 307.1 215.6 207.9 284.0 213.4 - - 24.9 - 14.0
DIRECT INVESTMENT ... 3,728.6 3,489.3 3,432.4 3,365.1 4,306.2 3,955.7 - - 8.1 + 1.2
Source: NBB (calculations based on the Belgian accounts filed with the Central Balance Sheet Office and on surveys).
29
Investment by the public authority Flemish Region is limited to the projects linked to a specific port. 30
These figures stand for the activity of the maritime enterprises located outside the port limits and are divided among the Flemish ports according to the breakdown of value added.
-3.000 -2.000 -1.000 0 1.000 2.000 3.000
2011 2012 2013 2014 2015
CHART 4 CHANGE IN DIRECT INVESTMENT
(in € million, current prices)
Source: NBB (calculations based on the Belgian accounts filed with the Central Balance Sheet Office).
Looking at investment per segment, taking all ports together, the maritime cluster recorded a 22.3% fall; the biggest decline was in the shipping companies segment, but there was no significant increase in value in any of the other segments. In the non-maritime cluster, investment in the trade and land transport segments contracted. Conversely, it was steady in the other logistic services segment, and increased sharply in industry, thanks to the energy and fuel production segments. Overall, investment in the non-maritime cluster increased by 5.2%.
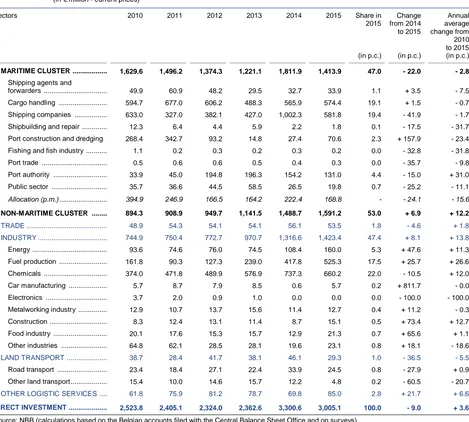
1.6 Demography of the Belgian ports
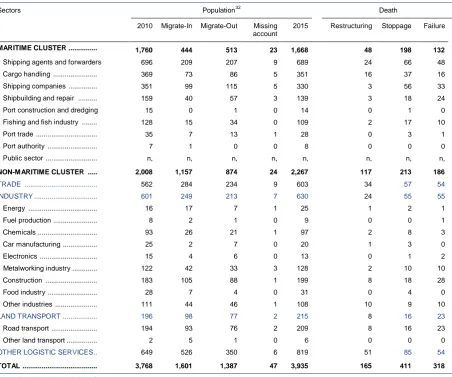
The table entitled 'Demography of the Belgian Ports' gives an overview of changes in the sample population used for the study for the period 2010-2015. The public sector is not taken into consideration in this table. As a reminder, besides Belgian commercial enterprises, the study also covers a limited number of legal entities such as non-profit organizations or branches of foreign firms. The two columns, entitled '2010' and '2015', with the heading "Population" indicate the number of legal persons (regardless of the legal form of the entity) included in the study for the years 2010 and 2015 respectively. The 'Migrate-out' column lists firms that left the population during the period 2011 - 2015. Obviously, it is the other way round for the 'Migrate-in' column. There are several explanations justifying the exclusion from the survey population from one year to the next: the company has moved, changed activity, merged with another firm already established in the port (in which case, only the surviving company continues to feature in the study). The three last columns of the table give the number of firms affected by corporate restructuring (absorption, merger, takeover or split), by a stoppage or failure. The firms included in the 'Migrate-in' column can either be newly established firms (after 2010) coming into the population studied or existing companies that have, for instance, started activities or taken over another enterprise in the port. The 'Missing account' column adds the number of firms that have not filed their annual accounts for the year 2015 and which, as far as we know, should not be excluded from the study31.
The number of companies in the study of the Belgian maritime ports increased over the period 2010 - 2015. However, that rise occurred in the non-maritime cluster, whereas in the maritime cluster the number of firms declined in almost all segments. Nevertheless, if missing accounts are excluded, the shipping agents and forwarders segment is the only one in maritime cluster which showed a very slight increase. While the population has declined in the maritime cluster, the number of firms in the trade segment increased by 41 units, and for the non-maritime cluster as a whole the figure was up by 259 units. Growth of the number of firms was highest in the other logistic services segment, with a figure of 170 units; head offices and business and other management consultancy activities accounted for most of the movements in firms.
31
See Coppens F., Verduyn F. (2009), Analysis of business demography using markov chains: an application to Belgian data, NBB, W orking Paper No. 170 (Research series), Brussels.
-1.500 -1.000 -500 0 500 1.000 1.500
2011 2012 2013 2014 2015
TABLE 7 DEMOGRAPHY OF THE BELGIAN PORTS FOR THE PERIOD 2010 - 2015
(Number of firms)
Sectors Population32
Death
2010 Migrate-In Migrate-Out Missing account
2015 Restructuring Stoppage Failure
MARITIME CLUSTER ... 1,760 444 513 23 1,668 48 198 132
Shipping agents and forwarders 696 209 207 9 689 24 66 48
Cargo handling ... 369 73 86 5 351 16 37 16
Shipping companies ... 351 99 115 5 330 3 56 33
Shipbuilding and repair ... 159 40 57 3 139 3 18 24
Port construction and dredging 15 0 1 0 14 0 1 0
Fishing and fish industry ... 128 15 34 0 109 2 17 10
Port trade ... 35 7 13 1 28 0 3 1
Port authority ... 7 1 0 0 8 0 0 0
Public sector ... n, n, n, n, n, n, n, n,
NON-MARITIME CLUSTER ... 2,008 1,157 874 24 2,267 117 213 186
TRADE ... 562 284 234 9 603 34 57 54 INDUSTRY ... 601 249 213 7 630 24 55 55
Energy ... 16 17 7 1 25 1 2 1
Fuel production ... 8 2 1 0 9 0 0 1
Chemicals ... 93 26 21 1 97 2 8 3
Car manufacturing ... 25 2 7 0 20 1 3 0
Electronics ... 15 4 6 0 13 0 1 2
Metalworking industry ... 122 42 33 3 128 2 10 10
Construction ... 183 105 88 1 199 8 18 28
Food industry ... 28 7 4 0 31 0 4 0
Other industries ... 111 44 46 1 108 10 9 10
LAND TRANSPORT ... 196 98 77 2 215 8 16 23
Road transport ... 194 93 76 2 209 8 16 23
Other land transport ... 2 5 1 0 6 0 0 0
OTHER LOGISTIC SERVICES.. 649 526 350 6 819 51 85 54
TOTAL ... 3,768 1,601 1,387 47 3,935 165 411 318
Migrate-In = New in population after 2010.
Migrate-Out = Left the population in the period 2011-2015. This category includes the category 'Death', the enterprises which moved their acitivities outside the port area or whose NACE-BEL branch changed.
Death = legal situation at the closing date of this report Restructuring = Absorption + Takeover + Merger +Split
Source: NBB (calculations based on the Crossroads Bank for Enterprises CBE).
Comparison of the “Death” table with that in the previous publication covering the period 2009 – 2014 shows no change in the number of restructurings but an increase in the number of terminations and bankruptcies. In some cases, the proportion of bankruptcies is high in relation to the number of firms at the start of the period plus the number of firms that joined the population during the period. In the shipbuilding and repairs segment, bankruptcies represent just under an eighth of the total number of firms. However, the segment recorded a slight decrease in the number of bankruptcies in 2015. The fishing segment recorded a substantial increase in the number of bankruptcies in 2015. In industry, the segments with the most bankruptcies in relation to the number of firms at the start of the period are construction, electronics and fuel production, though the firms in the first two segments are not numerous and may not be a representative sample of the population for these sectors of activity. In industry, there was little variation in the number of bankruptcies between 2014 and 2015. The total number of bankruptcies for firms in the study increased in the maritime cluster in 2015 and was down slightly in the non-maritime cluster. But if we look at the impact of these bankruptcies in terms of jobs, many of the firms that failed in 2015 employed few if any workers, so that job losses were limited.
32
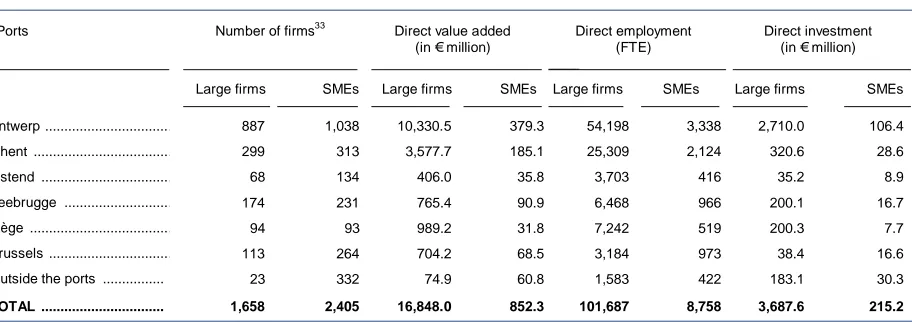
1.7 Breakdown of the variables by company size
Note that the distribution of the firms according to size depends on the format of the annual accounts filed by the firms. Thus, companies submitting their annual accounts to the Central Balance Sheet Office in the full format are considered to be large firms. The SME category covers companies submitting their annual accounts in an abbreviated format.
[image:20.595.62.518.269.430.2]The proportion of large firms remained unchanged in 2015, making up 40.8% of all firms covered by the study. Value added produced grew more rapidly in large firms than in small ones. As a result, they generated more than 95% of the value added produced in all ports in 2015. Employment has contracted in large enterprises as well as in SMEs. All in all, 92.1% of all employees expressed in full-time equivalents work in a large enterprise. Between 2014 and 2015, investment dropped back in large firms but rose in SMEs. These developments should nevertheless be treated with caution as they are rather tenuous and consequently may change from one year to the next depending on the model of the annual accounts available for carrying out the analysis.
TABLE 8 BREAKDOWN OF FINDINGS IN THE BELGIAN PORTS IN 2015
Ports Number of firms33 Direct value added Direct employment Direct investment
(in € million) (FTE)
____
(in € million)
Large firms SMEs Large firms SMEs Large firms SMEs Large firms SMEs
Antwerp ... 887 1,038 10,330.5 379.3 54,198 3,338 2,710.0 106.4
Ghent ... 299 313 3,577.7 185.1 25,309 2,124 320.6 28.6
Ostend ... 68 134 406.0 35.8 3,703 416 35.2 8.9
Zeebrugge ... 174 231 765.4 90.9 6,468 966 200.1 16.7
Liège ... 94 93 989.2 31.8 7,242 519 200.3 7.7
Brussels ... 113 264 704.2 68.5 3,184 973 38.4 16.6
Outside the ports ... 23 332 74.9 60.8 1,583 422 183.1 30.3
TOTAL ... 1,658 2,405 16,848.0 852.3 101,687 8,758 3,687.6 215.2
Source: NBB (calculations based on the Belgian accounts filed with the Central Balance Sheet Office and on surveys).
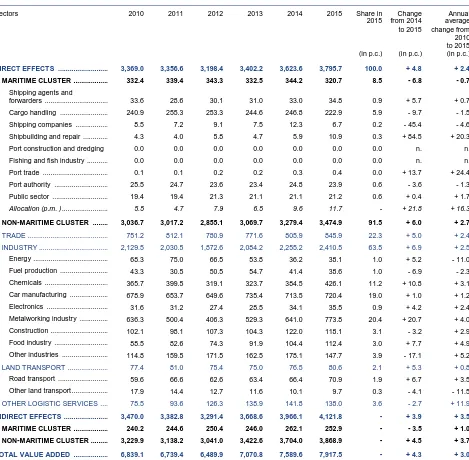
1.8 Social balance sheet in the Belgian ports34
The social balance sheet presents a coherent set of data on various aspects of employment in firms: composition of the workforce, staff rotation, type of employment contracts, level of education, working time, staff costs and training efforts. The results presented below concerning direct employment in the six Belgian ports are not exhaustive. The figures are based on a constant sample35 relating to the period 2013 - 2015. The national data is calculated from a constant sample of filed annual accounts with the Central Balance Sheet Office. The findings per individual port are also based on a constant sample.
1.8.1 Working time and staff costs
For a detailed analysis of the social balance sheet data, see the article by P. Heuse in the December 2017 Economic Review of the National Bank of Belgium.
After a year of sharp decline, the contraction of the average number of employees in the constant sample of firms active in the Belgian ports slowed down in 2015. It was the Liège port complex that
33
For each port, this is the number of firms located in the port zone. A firm may in fact be recorded in more than one port. The sample for the year 2015 comprises 1.554 large firms and 2.381 small and medium-sized firms, totalling 3.935 firms. The results of the public sector are not included in this table.
34
The national data mentioned were taken from Heuse P., The social balance sheet 2014, NBB, Economic Review, June 2016. The comparisons are merely an indication, since only firms filing their social balance sheet for a period of 12 months ending on 31 December were taken into account in that study. Moreover, NACE-BEL 78 branches (employment-related activities), 84 (public administration and defence; compulsory social security) and 85 (education) are excluded in that study.
35
registered the biggest drop. The number of hours effectively worked by each full-time equivalent also dropped back but two ports posted an increase: Antwerp and Zeebrugge. Staff costs were up slightly in 2015.
TABLE 9 HOURS WORKED AND ASSOCIATED COSTS OF INTERNAL HUMAN RESOURCES
(reduced population: constant population)
(percentage change compared with the previous year, unless otherwise stated)
2013 2014 2015
Change in the average number of employees on the staff register (p.c.) ... -3.7 -1.0
Change in the number of hours actually worked (p.c.) ... -3.8 -0.4
Change in staff costs (p.c.) ... -0.8 +0.2
Average number of hours worked per annum per full-time equivalent (hours) ... 1,509 1,506 1,514
Average annual staff costs per full-time equivalent (euros) ... 78,064 80,366 81,365
Average staff costs per hour worked (euros) ... 52 53 54
Source: NBB (full presentation accounts only).
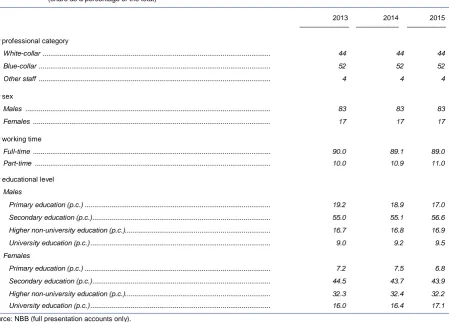
1.8.2 Composition of the workforce
[image:21.595.88.538.378.700.2]The proportion of blue-collar workers is still just as stable, as is the proportion of women working for companies based in the ports. The percentage of full-timers has hardly changed at all. The proportion of people with primary education qualifications working in enterprises in the ports continues to fall; by contrast, that for secondary education qualifications and university graduates is growing36.
TABLE 10 INTERNAL WORKFORCE AT THE END OF THE FINANCIAL YEAR
(reduced population: constant population) (share as a percentage of the total)
2013 2014 2015
By professional category
White-collar ... 44 44 44
Blue-collar ... 52 52 52
Other staff ... 4 4 4
By sex
Males ... 83 83 83
Females ... 17 17 17
By working time
Full-time ... 90.0 89.1 89.0
Part-time ... 10.0 10.9 11.0
By educational level
Males
Primary education (p.c.) ... 19.2 18.9 17.0
Secondary education (p.c.)... 55.0 55.1 56.6
Higher non-university education (p.c.)... 16.7 16.8 16.9
University education (p.c.) ... 9.0 9.2 9.5
Females
Primary education (p.c.) ... 7.2 7.5 6.8
Secondary education (p.c.)... 44.5 43.7 43.9
Higher non-university education (p.c.)... 32.3 32.4 32.2
University education (p.c.) ... 16.0 16.4 17.1
Source: NBB (full presentation accounts only).
1.8.3 External staff
After having expanded in 2013 and 2014, the share of external staff in total employment in the companies analysed fell in 2015. Enterprises established in the port of Antwerp are largely behind the
36
reversal of this trend. In fact, the proportion of hours worked by external staff is continuing to grow in the other ports. It should be noted that costs have fallen more rapidly than the reduction in the number of hours worked.
TABLE 11 HIRED TEMPORARY STAFF AND STAFF PLACED AT THE ENTERPRISE’S DISPOSAL
(reduced population: constant population)
(percentage change compared with the previous year, unless otherwise stated)
2013 2014 2015
Share of external staff in total employment (on the basis of the number of hours actually worked)
(share as a percentage of the total) ... 14.1 15.9 14.9
Change in the number of hours actually worked ... + 9.9 - 6.3 Change in costs ... + 8.6 - 8.2
Source: NBB (full presentation accounts only).
1.8.4 Staff turnover
After falling in 2014, the net number of workers hired during the year under review increased in 2015. But an increase was not recorded in all the ports, with only the ports of Ghent and Ostend registering a positive balance, and all the others posting a negative result. The recruitment deficit was highest in the ports of Antwerp and Liège – the same ports that have the highest proportion of retirements. After the peak recorded in 2014, the percentage of early retirements dropped in 2015 giving a result that is below the percentage for 2013.
TABLE 12 STAFF TURNOVER
(reduced population: constant population)
(share as a percentage of the total, unless otherwise stated)
2013 2014 2015
Net number of staff hired during the year (FTE) ... + 613 - 978 + 52
Staff leaving, by reason for termination of contract
Retirement ... 8.7 7.5 8.1
Unemployment with company allowance ... 4.2 9.0 3.7
Dismissal ... 18.7 16.6 15.8
Other reason37
... 68.4 66.9 72.2
Source: NBB (full presentation accounts only).
1.8.5 Training38
The training participation rate fell back slightly in 2015. Not all the ports have followed the same trend as this rate was actually up in the ports of Antwerp and Ostend. The number of hours of training followed per person is on the rise, as are hourly costs of training. These hourly costs vary substantially from one port to another. They are highest in the port of Brussels but several other ports have reported a significant increase in hourly costs for female staff. However, the percentage figure for the number of hours worked devoted to training has not changed and the cost of training as a share of total staff costs has only gone up very marginally.
37
Spontaneous departures, death in service, expiry of the period of fixed-term contracts, provided that they are not immediately followed by a new contract, and the completion of the work for which the contract was concluded.
38