City, University of London Institutional Repository
Citation
:
Seeley, A., Dissado, L. A. and Fothergill, J. (2001). Electric field requirements for charge packet generation and movement in XLPE. IEEE Transactions on Dielectrics and Electrical Insulation, 8(6), pp. 232-235. doi: 10.1109/ICSD.2001.955603This is the unspecified version of the paper.
This version of the publication may differ from the final published
version.
Permanent repository link:
http://openaccess.city.ac.uk/1325/Link to published version
:
http://dx.doi.org/10.1109/ICSD.2001.955603Copyright and reuse:
City Research Online aims to make research
outputs of City, University of London available to a wider audience.
Copyright and Moral Rights remain with the author(s) and/or copyright
holders. URLs from City Research Online may be freely distributed and
linked to.
City Research Online: http://openaccess.city.ac.uk/ publications@city.ac.uk
Electric field criteria for charge packet formation and movement in
XLPE
A. See, L.A. Dissado, J.C. Fothergill
Department of Engineering, University of Leicester, UK
ABSTRACT
injection and extraction process, which occur there. The nature of the negative charges produced at the ionisation front is not clear, but they are unlikely to be electrons.
1. INTRODUCTION
acetophenone and anti-oxidant play a role in packet formation, but what form this takes has not been determined. In the experiments reported here we explore the electrical conditions required for the initiation of very slow moving charge packets in XLPE. We show that they can only be formed at fields above a „critical‟ value, which can take a long time to develop. Once initiated long sequences of packet formation are possible. As it moves through the sample, each packet in the sequence maintains a field at its front that is sufficient to maintain movement. Reduction of the applied field from 120kV/mm to 90kV/mm allowed the field necessary to maintain packet movement to be determined. Even though the field at the packet front was less than that achieved at the higher applied fields the packet continued moving at the same speed but with reduced amplitude. A return to 120kV/mm verified the existence of a critical onset field. These results are discussed in terms of the theoretical models.
2. EXPERIMENTAL INVESTIGATIONS
2.1 Sample preparation
Space charge observations were made by the pulsed electro-acoustic technique (PEA) at various constant dc-voltage levels systematically varied corresponding to applied fields between 80 kV/mm and 120 kV/mm. The samples were not coated with electrodes but were clamped between two electrodes. The cathode was a solid aluminium electrode, which was ground to an optically flat finish. This was in contact with the rougher face of the specimen. The anode was constructed from 0.75 0.03mm thick piece of semicon from a commercial XLPE cable that was coated with a 1 0.2 m thick layer of 99.9% pure aluminium. The anode was in contact with the smooth face of the specimen. A thin (~0.2 m) film of silicon oil was used in all experiments on both the top and bottom electrodes to aid acoustic transmission. All measurements were made in air at atmospheric pressure.
2.2 Pulsed Electro-acoustic apparatus
2.3 Cailbration of technique with and without applied DC voltage
In order to investigate the effects of the short high voltage electric field pulses on the XLPE specimens, we present the calibration of the PEA technique at low DC applied voltage on the XLPE specimen. An experiment was conducted using the PEA method with the following parameters:
Electric field pulse amplitude: 400 V
Pulse repetition rate: 650 cycles/s
Applied DC voltage: 1.8 kV
Temperature of measurement: 20 ºC
Duration of experiment: 48 hours
electric field pulses throughout the 48 hours. This shows that the PEA technique does not, itself, affect the space charge distribution with a sample.
2.4 Measurement protocols
In order to investigate the charge dynamics in the XLPE sheet specimens under high dc electric field, two different measurement protocols were used. Both experiments were conducted at a temperature of 20 0.1 C. Prior to measurement, the XLPE sheet specimens were cleaned with isopropyl alcohol and allowed to dry. The first measurement procedure was to apply a dc electric field at 120 kV/mm for a period of 48 hours. PEA measurements were taken at 6 second intervals for the first 10 minutes and subsequently every 15 minutes. The second measurement procedure was aimed at determining the onset/threshold for charge packet generation. The sheet specimen was subjected to an applied field of 120 kV/mm for the duration of 1 hour until a charge packet was initiated. The applied electric field was then reduced to 90 kV/mm for 30 minutes and then further reduced to 80 kV/mm for an hour. At this point the applied field was increased to 90 kV/mm for another 1 hour and finally to 120 kV/mm for another 1 hour. Throughout the second experiment the PEA measurements were taken at intervals of 6s for about 10 minutes and then changed to 3 minutes intervals at each of the voltage levels applied. In all the measurement performed, the applied electric field pulse‟s amplitude was set at 400 V with repetition frequency of ~ 800Hz.
3. RESULTS
3.1 Measurement under constant dc electric field (120kV/mm) and temperature
(20 C) for a duration of 48 hours
the applied dc voltage was 18 kV). This is shown in colour and as a moving image at the following web site: <include web site address here>. The negative and positive charge peaks at the cathode and anode correspond to the induced charges on the electrodes. These appear broad because of the limit of spatial resolution of the measurement system; in particular the thickness of the PVDF film used for the microphone.
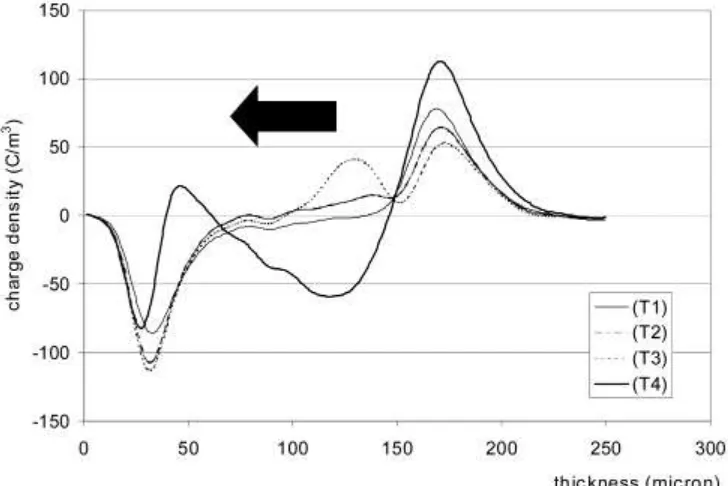
During this period negative charge is injected from the cathode, after about 500 s, and advances across the sample to build up the field at the anode. When the anode field reaches a value of about 140 kV/mm, see figure 3, a positive charge packet can be seen to just separate from the anode peak. This packet must be initiated at or close to the anode. This packet crosses the sample in about 9000s (2.5 hrs) and as it exits at the cathode another positive packet is created near the anode. The process is repeated regularly over the subsequent period of 48 hours with diminishing packet amplitude, but unchanged transit time (see the arrows in figure 3).
( 20-25 Cm-3) and they may have been too small to be detected in that region, see figure 5. These weak packets (<10 Cm-3) continue until the applied voltage is switched off and lead to the irregular fluctuations of the anode field, see figure 4, which intermittently rises to 140 kV/mm and then drops again. When the voltage is switched off the sample can be seen to contain both positive and negative heterocharge at the electrodes see figure 5.
3.2 Measurement under dc electric field stepped between 80 kV/mm and
120kV/mm.
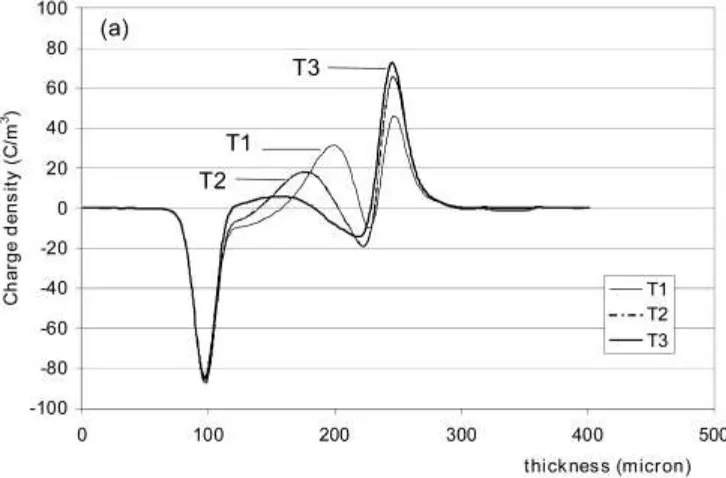
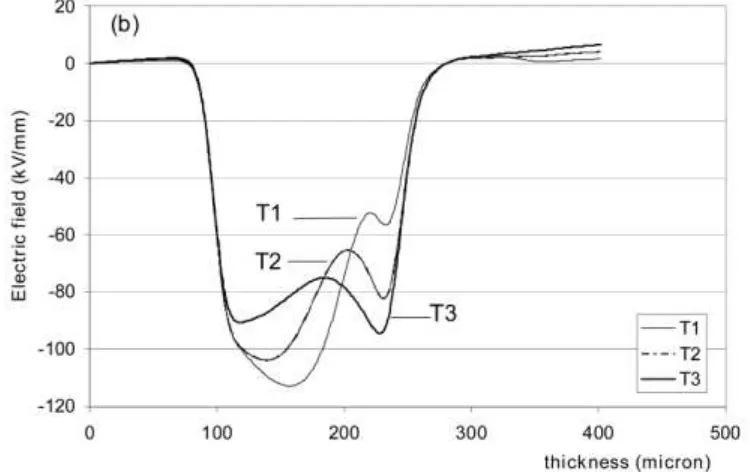
As previously found in the constant applied field case, negative charge is injected at the cathode and moves across the sample to the anode, where it causes the anode field to be enhanced sufficiently to initiate a positive charge packet, see figure 6. In this case the anode field reached a value of 165 kV/mm before a positive packet separated from the anode peak. This field is higher than that observed for the first peak in the previous experiment. However, as the packet moves away from the anode the field at the front of the packet is reduced to 135 kV/mm and the anode field to 100kV/mm.
anode over a period of 1 hour, see figure 9. This was sufficient to raise the anode field to 135 kV/mm, but did not initiate a charge packet.
4. DISCUSSION
The results presented clearly demonstrate the need for an onset or threshold field if the charge packets are to be initiated. In the first experiment it was shown that packets were continually generated as long as the anode field reached 140 kV/mm. The second experiment showed that a packet could not be initiated when the anode field only reached 135 kV/mm on re-application of an applied field of 120 kV/mm. If the packet is caused by ionic dissociation and transport of one of the ionic species to the cathode where it is neutralised it could be argued that the failure to initiate a packet might be due to exhaustion of the dissociable species in the region of the anode. In the first experiment, however, we were able to initiate several packets with a magnitude decreasing from 50 to 25 Cm-3, but only one packet of magnitude 35 Cm-3 in the second experiment. Exhaustion of the positive charge reservoir is therefore unlikely to be the explanation for the failure to generate further packets. Hence there must be a packet initiation field lying between 135 kV/mm and 140 kV/mm for the type of packets observed here. This result is consistent with all three current theories. In [6] a threshold field was required for a switch to a high injection current, in [5] it is required to initiate carrier generation and in [8] it is required to create trapped carriers some fraction of which become mobile. The value of threshold field observed in the present experiments is lower that those reported previously [5,6,8], but not severely so. In our case the threshold field is the minimum packet onset field obtained over experiments lasting up to 48 hours during which the onset field steadily declined from a high of 210 kV/mm down to 140 kV/mm. It is noticeable that the experimental onset fields reported in [7] diminish over a period of 4800s (80 minutes) from 250 kV/mm to around 170 kV/mm, and it may be that a longer experiment would see them approach our lower value.
models. In [6] field enhancement is required at the electrode. In [8] a bipolar charge injection allows the maximum field enhancement to occur in the body of the sample, where the positive and negative charge fronts meet, and generate the packet there. In our case charge injection consists mainly of negative charge from the cathode, which moves slowly to accumulate at the anode that must be substantially blocking to negative charge. The absence of a substantial positive charge injection means that the highest field during this period is at the anode, and this does not reach a packet generating level until sufficient negative charge has crossed the sample. In our case this takes a considerably longer time than in the previously reported work, because the negative charge moves slowly. There is evidence (to be reported elsewhere) that this charge is deep trapped ( 1eV) and moves by field-assisted hopping (see chapter 9 of [14]) which would be consistent with a long transit time for the negative space charge and probably also with a very slow rate for extraction at the anode. Only in one of the models [8] is the extraction rate considered. In this model the anode field and the barrier height are the important factors. It is noticeable that the anode field drops substantially as the positive packet starts to move (see figure 4) and hence negative charge extraction at this time will be reduced allowing the negative space charge to build up.
As the first positive packet exits at the cathode the anode field builds up to a value far in excess of the field that initiated the packet. The reason is that the negative charge concentration at the anode has increased by almost the same amount as the maximum charge density in the packet. Of course, this increase could be the result of the increased cathode injection as the packet approaches the cathode and it can be observed for some of the later packets in the sequence just before the packet reaches the cathode. Much of such injected charge will be used to neutralise the packet, and will not be available for transport to the anode. In addition we would expect the amount of injected charge to depend on the cathode field. As can be seen in figure 3, this shows no systematic change over the sequence. Therefore negative charge injection is unlikely to be responsible for the changes in anode field brought about by the negative hetero-charge region.
[6] suggested that the positive charge packet is caused by charge injection from the anode. In another model [5], it is suggested that packet generation is caused by field-induced dissociation as a source of carriers. Analysis of our experimental data was compared with these models.
If the positive charge packet generation is caused by charge injection and it is assumed that the packet is composed of mobile excess positive charges (+Qpacket) superimposed upon a
background of stationary negative charge (-Qnegative), the residual negative charge after
passage of the first packet should still be -Qnegative. The arrows in Figure 10 indicate the
steady decrease in magnitude of the net negative charge after the exit of positive charge packets; this model [6] is therefore not appropriate to our findings.
If the charge packet generation is caused by field-induced dissociation [5], such a process would result in the formation of charges that would be equal in magnitude and opposite in polarity (e.g. +Qpacket and –Qspecies). In this second scenario, it is again assumed that the
positive charge packet that transits the sample is superimposed upon a background of stationary negative charge (-Qnegative), When the positive charge packet leaves the sample, the
residual net charge in the sample should be –Qspecies - Qnegative although some of the negative
charges may exit through the anode during the increase in the local field there. From Figure 10, the net negative charge to start with before the first positive charge packet is about ~ 0.001 Cm-2. After the exit of the first positive charge packet, the magnitude of residual net negative charge is about ~ 0.0042 Cm-2 (–Qspecies - Qnegative). In this case, the negative
the packets do not spread out, and are repetitively produced, together with the compensating negative charge observed for the first packet indicate that the basic mechanism may well be that described by the model of [8]. Some modifications would however be required to fit the present results, most notably a large barrier or an onset field for negative charge extraction/positive charge injection at the anode, and a very high barrier for the field-dependent mobility of the negative carriers.
There is also the question as to the nature of the charge carriers. The samples used had undergone a 48-hour heat treatment at 50 C prior to use. This thermal conditioning treatment removes much of the volatile material and certainly reduces the acetophenone concentration [10]. It does not, however, remove it completely, and as pointed out in [5] the treatment may well have caused a reaction with anti-oxidant in the material leading to a dissociable chemical species. It may be possible that this species is responsible for the charge generation observed here as the transit times are similar to those found in [5]. It is interesting to note that anti-oxidant clusters can cause oxidation [15,16]. Such clusters may be produced if acetophenone solvated the anti-oxidant at high temperature and allowed it to associate. A clearer idea of their nature will depend on a spectral analysis of the electro-luminescence produced during charge packet transit.
5. CONCLUSIONS
A critical onset field is required before the generation of charge packets that in the present case has a value of 140 kV/mm.
The positive charge packets are formed at or near the anode because they rely on the build-up of a negative hetero-charge field to reach the required onset field. Because the transport of the negative space charge is very slow the time before the first packet is initiated is of the order of hours. Injection of positive space charge is attested by the presence of electro-luminescence but the positive space charge moves even slower than the negative charge and its injection is very weak. For this reason charge packets cannot develop in the middle of the sample such as occurs in the model of [8], and the experiments of [7].
The first charge packet at least is caused by a moving front of field ionisation as shown by the equivalent increase in negative hetero-charge at the anode. The inability of the negative charge to exit quickly at the anode, unlike the situation considered in [8] prevents the exact repetition of the process for succeeding packets. The subsequent generation of packets is governed by the anode field as determined by the balance of negative charge extraction/positive charge injection processes and field ionisation. Consequently the amplitudes of successive packets reduce, to the point at which a nearly exact repetition can be achieved.
hinder recombination. Behind the packet, however, the movement of negative charge would be much slower. As yet it is unclear what the ionised species are.
The packet can continue to travel at fields down to 100 kV/mm albeit at a lower magnitude until eventually it disappears. A possible explanation for this is that the field at the packet front is high enough for field ionisation but that the displacement of the mobile charge which is exponentially dependent upon the local field becomes small allowing substantial recombination leading to packet extinction at a field between 90 and 80 kV/mm.
ACKNOWLEDGMENTS
REFERENCES
1. A. Tanaka, M. Maeda and T. Takada, "Observation of Charge Behaviour in Organic Photoconductor using Pressure-wave Propagation Method", IEEE Trans. on DEI, Vol. 27, No 3, pp. 440-444 (1992)
2. O Fanjeau, D Mary and D Malec, “A note on charge recombination in low density PE under a moderate ac 50Hz field”, J. Phys. D applied phys 33, pp 61-64, (2000)
3. A Cherifi, M. Abou Dakka and A. Toureille, “The Validation of the Thermal Step Method” IEEE Trans. on DEI, Vol. 27, No. 6, pp. 1152-1158 (1992)
4. R. Liu, T. Takada and N. Takasu, "Pulsed Electro-acoustic Method for Measurement of Charge Distribution in Power Cables under both DC and AC Electric Fields", J. Phys. D Appl. Phys. Vol.26, pp.986-993 (1993)
5. N. Hozumi, T. Takada, H. Suzuki and T. Okamoto, "Space charge behaviour in XLPE cable insulation under 0.2 - 1.2MV/cm dc fields", IEEE Trans. on DEI, Vol. 5, No. 1, pp. 82-90 (1998)
7. H. Kon, Y. Suzuoki, T. Mizutani, M. Ieda and N. Yoshifuji, " Packet-like space charge and conduction current in Polyethylene cable insulation", IEEE Trans. on DEI, Vol. 3, No. 3, pp. 380-385 (1996)
8. K. Kaneko, T. Mizutani and Y. Suzuoki, "Computer simulation on formation of space charge packets in XLPE films", IEEE Trans. on DEI, Vol. 6, No. 2, pp. 152-158 (1999)
9. C. Laurent, G. Teyysedre, J.L. Auge, G. Mazzanti, G.C. Montanari, L.A. Dissado, J.C. Fothergill and A. See "Space charge and associated electroluminescence processes in XLPE cable peelings", Ann. Rep.CEIDP, IEEE Conf. Pub. 00CH37132 pp.568-572, (2000)
10. L.A. Dissado, J.C. Fothergill and A. See, G. Stevens, L. Markey, C. Laurent, G. Teyssedre, U.H. Nilsson, G. Platbrood and G.C. Montanari, "Characterising High-Voltage XLPE cables by electrical, chemical and microstructural measurements performed on cable peelings: the effects of surface roughness, thermal treatment and peeling location” , Ann. Rep CEIDP, (IEEE Conf. Pub. 00CH37132) pp.136-140, (2000)
11. J.M. Alison, “A high field pulsed electro-acoustic apparatus for space charge and external circuit current measurement within solid insulators ”, J. Meas. Sci. & Technol. vol. 9 pp. 1737-1750, (1998).
13. T. Takada, “Acoustic and Optical methods for measuring electric charge distributions in dielectrics”, IEEE Trans. DEI, Vol. 6, No. 5, pp519-547, (1999)
14. L.A. Dissado and J.C. Fothergill, Electrical Degradation and Breakdown in Polymers (P.Peregrinus for IEE, London 1992)
15. B.S.Bernstein IEEE Int.Symp.Elect.Insul. (Montreal), 11-21, (1984)
List of Figure Captions
Figure 1. Time-dependent space charge profiles in a 150 m thick XLPE sheet specimen when the applied electric field was 12 kV/mm (applied voltage at 1.8kV) for ~3 minutes. The voltage was removed and PEA measurement was carried out for up to 48 hours. No significant space charge was observed even with the electric field pulse applied continuously (Pulse amplitude of 400V and repetition rate at 650Hz).
Figure 2. Time-dependent space charge profiles in a 150 m thick XLPE sheet specimen when the applied electric field was 120 kV/mm. The arrows indicate the direction of packet-charge movement. Time T1 at 588s, T2 at 12342s, T3 at 14142s and T4 at 19542s
Figure 3. Comparison of the temporal change of local internal electric fields at the anode and cathode sides. Average applied electric field was 120 kV/mm.
Figure 4. Temporal change of local internal electric fields at the front, back of the charge packets together with the anode field. Average applied electric field was 120 kV/mm.
Figure 6. Space charge profiles measured during 1 hour of poling at 120 kV/mm. (a) and (b) show the space charge and the internal electric field profiles respectively. Negative charge can be first observed to move from the cathode to the anode. Time T1 at 41s, T2 at 1435s and T3 at 3321s. The positive charge packet was initiated at about 3500s.
Figure 7. Space charge profiles at applied field of 90 kV/mm (13.5kV on 150 m) for 1800s. (a) and (b) show the space charge and the internal electric field profiles respectively. The direction of the positive charge packet movement is from the anode to the cathode. Time T1 at 81s, time T2 at 810s and time T3 at 1620s.
Figure 8. Space charge profile at applied field of 80 kV/mm (12kV on 150 m). (a) and (b) show the space charge and the internal electric field profiles respectively. Time T1 at 180s and T2 at 3600s.
Figure 9 (a) and (b) show the space charge and internal electric field profiles respectively, measured after 1 hour at 90 kV/mm and after 1 hour at 120 kV/mm. Time T1 and T2 are at ~ 3420s