Arlemark, E.J. and Reese, J.M. (2009) Investigating the effect of solid
boundaries on the gas molecular mean-free-path. In: 7th International
Conference on Nanochannels, Microchannels and Minichannels,
ICNMM2009, 2009-06-22 - 2009-06-24. ,
This version is available at https://strathprints.strath.ac.uk/16436/
Strathprints is designed to allow users to access the research output of the University of Strathclyde. Unless otherwise explicitly stated on the manuscript, Copyright © and Moral Rights for the papers on this site are retained by the individual authors and/or other copyright owners. Please check the manuscript for details of any other licences that may have been applied. You may not engage in further distribution of the material for any profitmaking activities or any commercial gain. You may freely distribute both the url (https://strathprints.strath.ac.uk/) and the content of this paper for research or private study, educational, or not-for-profit purposes without prior permission or charge.
Any correspondence concerning this service should be sent to the Strathprints administrator: [email protected]
The Strathprints institutional repository (https://strathprints.strath.ac.uk) is a digital archive of University of Strathclyde research outputs. It has been developed to disseminate open access research outputs, expose data about those outputs, and enable the
Proceedings of the Seventh International ASME Conference on Nanochannels, Microchannels and Minichannels ICNMM2009 June 22-24, 2009, Pohang, South Korea
ICNMM2009-82080
INVESTIGATING THE EFFECT OF SOLID BOUNDARIES ON THE GAS
MOLECULAR MEAN-FREE-PATH
Erik J. Arlemark∗and Jason M. Reese
Department of Mechanical Engineering University of Strathclyde
Glasgow, G1 1XJ United Kingdom
Email: [email protected] / [email protected]
ABSTRACT
A key parameter for micro-gas-flows, the mean free path, is investigated in this paper. The mean free path is used in vari-ous models for predicting micro gas flows, both in the govern-ing equations and their boundary conditions. The conventional definition of the mean free path is based on the assumption that only binary collisions occur and is commonly described using the macroscopic quantities density, viscosity and temperature. In this paper we compare the prediction by this definition of the mean free paths for helium, neon and argon gases under standard temperature and pressure conditions, with the mean free paths achieved by measurements of individual molecules using the nu-merical simulation technique of molecular dynamics. Our simu-lation using molecular dynamics consists of a cube with six peri-odic boundary conditions, allowing us to simulate an unconfined gas “package”. Although, the size of this package is important, since its impact on computational cost is considerable, it is also important to have enough simulated molecules to average data from. We find that the molecular dynamics method using 20520 simulated molecules yields results that are within 1% accuracy from the conventional definition of the mean free paths for neon and argon and within 2.5% for helium. We can also conclude that the normal approximation of only considering binary collisions is seemingly adequate for these gases under standard tempera-ture and pressure conditions. We introduce a single planar wall and two parallel planar walls to the simulated gas of neon and
∗Address all correspondence to this author.
record the mean free paths at various distances to the walls. It is found that the mean free paths affected by molecular collisions with the walls corresponds well with theoretical models up to Knudsen numbers of 0.2.
1 INTRODUCTION
As our interest in micro gas flow applications is growing with improved manufacturing capabilities it is also apparent that the conventional isothermal flow model consisting of the Navier-Stokes equations with no-velocity-slip boundary condition fail for such cases. This is because micro-gas-flows differ from macro-gas-flows with respect to the relatively large ratio of the confining boundary surface area to the volume of the confined gas, which means that certain additional surface effects must be taken into account. These surface effects considerably influence the flow in the near-wall region, the Knudsen-layer, which is about two mean free paths wide. A commonly used mean free path expression for molecules, is expressed in terms of the gas dynamic viscosity,µ, density,ρ, the specific gas constantRand temperature,T, as follows [1]:
λ=µ
ρ r
π
2RT, (1)
is sufficiently dilute i.e. molecules only experience binary colli-sions. A requirement for a gas to be dilute is:
d
δ ≪1, (2)
whered is the molecular diameter andδis the average distance between molecules [2].
The key parameter indicating the degree of departure from equilibrium, the Knudsen number (Kn), is then defined as:
Kn=λ
l, (3)
wherelis a measure of the geometrical-length-scale. In this pa-per the length scalel is the channel width between two planar walls.
Modelling the Knudsen-layer should ideally be performed using detailed kinetic theory. However an appropriate extension to the Navier-Stokes equations would be less time-consuming and less demanding of computational capacity. Flows up to
Kn≈0.1 can be modelled by applying a velocity-slip to the con-ventional Navier-Stokes equations. AboveKn≈0.1 the assump-tion of a linear stress/strain-rate relaassump-tionship breaks down as the Knudsen-layer covers an ever larger part of the flow-domain.
An investigation by Arlemarket al. [3] shows how a non-linear stress/strain-rate relationship can extend the applicability of the Navier-Stokes equations beyondKn≈0.1. The non-linear relationship is obtained through using a theoretically and physi-cally derived mean-free-path, which is geometry-dependent due to that it accounts for intermolecular gas collisions as well as gas collisions with solid boundaries.
The main purpose of this paper is therefore to assess the mean free path profile affected by solid walls by using molec-ular dynamics, and compare these results to the theoretical and physically derived definition of the mean free path in [3].
2 COMPARING MEAN FREE PATH OF NUMERI-CAL EXPERIMENT WITH THE CONVENTIONAL EX-PRESSION
To begin with we compare the theoretical and constant mean free path value given by Eq. (1) for helium, neon and argon gas1 at standard temperature and pressure (STP), with the correspond-ing mean free path values simulated by molecular dynamics. In table 1 we have listed the gas parameters used in Eq. (1) together with the acquired mean free path values.2
1We have chosen to model noble gases due to that they are monoatomic
molecules, which makes them easier to interpret theoretically and to model using molecular dynamics
2The specific gas constant has been calculated usingR=R
u/M, whereRuis
[image:3.595.348.548.140.233.2]the universal gas constant having the value of 8.3145[J/(kg×K)].
Table 1. GAS DATA FOR STANDARD TEMPERATURE PRESSURE. [4]
Gas: He Ne Ar
µ×106[J/(kg×K)] 18.2 29.7 20.8
ρ[kg/m3] 0.178 0.900 1.784
R[J/(kg×K)] 2077.3 412.2 208.1
λ×107[m] 1.696 1.233 0.613
To model the mean free paths of the noble gases we use the open source software OpenFOAM (Open Field Operation and Manipulation) [5] with the molecular dynamics routines imple-mented by G. Macphersonet al.[6, 7]. Although molecular dy-namics is often used to model liquids at the nano scale we have here chosen to use this technique to model gases at STP.
2.1 The definition of collisions depends on inter-molecular potential
In the molecular dynamics simulation we have chosen to use the Lennard-Jones interaction potential,Φ, given by:
Φ=4ε "
σ
ri j
12
−
σ
ri j
6#
, (4)
which acts on moleculesiandjseparated by a distanceri j, where
εis related to the interaction strength of the molecules andσ
corresponds to the distance at which the potential between the two molecules is zero [8]. We have chosen to setσequal to the hard sphere diameter of a monatomic gas, which is determined by its relationship to viscosity according to R. Birdet al.[9] and G. Bird [10] as follows:
σ=
s
5 16
M NAvµ
r
RT
π , (5)
whereNAv is Avogadro’s number, 6.0221415×10²³ andM is the molar mass, which for helium, neon and argon has the val-ues of 4.003, 20.180 and 39.95[kg/kmol]respectively. For he-lium, neon and argon at STP Eq. (5) yieldσ-values of 2.2023×
10−10[m], 2.5830×10⁻¹⁰[m] and 3.6616×10⁻¹⁰[m] respec-tively. By using Eq. (5) it is then possible to calculate the kinetic value of the mean free path given by:
λk=
M/NAv
πρσ2√2, (6)
Table 2. Lennard-Jones parameter data. Prime notation distinguish commonly used data, where data for helium is from [9] and data for neon and argon is from [10]. The prime notated parameters are used here for scaling our appliedε.
Gas: He Ne Ar
σ′×1010[m] 2.576 2.720 3.405
ε′×1022[J] 1.4083 6.4891 17.2857
σ×1010[m] 2.2023 2.5830 3.6616
ε×1022[J] 1.9654 7.1957 14.9480
which yields the values 1.727×10⁻⁷[m], 1.255×10⁻⁷[m]and 0.624×10⁻⁷[m] for helium, neon and argon respectively. It should be noted that the mean free path values from this deriva-tion are approximately 2% higher than the values attained from Eq. (1) according to [2].
The parameterεis chosen so that the reduced sound damp-ing factor presented by E. Guariniet al.[11]:
Γ∗=Γ
σ p
M/ε, (7)
using the sound damping coefficientΓ3retain the same values forΓ∗ as for the commonly applied Lennard-Jones parameters (for liquids), which are listed in table 2. Thereby we obtain our
εcorresponding to ourσby using the relationσ2ε=σ′2
ε′under the assumption that this law is applicable to scale from liquid to gas properties in the same way as when used between liquid properties.4 This yields our usedε-values of 1.9654×10⁻²²[J], 7.1957×10⁻²²[J]and 14.9480×10⁻²²[J]for helium, neon and argon respectively.
In Eq. (4) the first term is relatively short range and repul-sive while the second is long range and attractive. In Fig. 1 the potentialΦfor helium, neon and argon are plotted together with their corresponding forces,F=−∇Φ.
In order to be able to compare the conventional definition of the mean free path given by Eq. (1) with molecular dynamics we need to declare what a collision is for the latter approach. Since molecular dynamics already uses a “closeness measure” given by
3The sound damping coefficient is expressed asΓ= [µ/ρ+ (γ−1)k]/2,
whereγis the specific heat ratio andkis the heat conductivity.
4The sensitivity ofεon the mean free path is tested for neon gas, where it is
found that when using half the value of the applied value ofεbeing 3.5979× 10²²[J]a decrease of the mean free path of about 0.16% is obtained, whereby we consider the solution being relatively insensitive to this parameter.
−3×10²²
−2×10²²
−1×10220
1.5 2 2.5 3 3.5 4 4.5
J
an
d
N
×
1
0
−
1
0
ri j×10−10
−8×10²²
−4×10²² 0
2 2.5 3 3.5 4 4.5 5 5.5
J
an
d
N
×
1
0
−
1
0
ri j×10−10
−2×10²²
−1×10²² 0
2.5 3 3.5 4 4.5 5 5.5 6 6.5 7 7.5
J
an
d
N
×
1
0
−
1
0
ri j×10−10
Φ[J]
F[N]
Φ[J]
F[N]
Φ[J]
[image:4.595.69.264.175.268.2]F[N]
Figure 1. Potential energy[J]and potential force[N]×10−10between moleculesiand jof helium (top), neon (middle) and argon (bottom).
σ, we have here decided to consider a collision to have occurred if two molecules are closer to each other than this distance.
In the implementation of the recording of the mean free path we have chosen to continuously record the travelled distance of a molecule since the last collision occurred, which, when aver-aged over all molecules, is expected to recover the mean free path value. This modelling method is different from the intu-itive method of directly measure a molecules travelled distance between two successive collisions, which only can be recorded at certain times once collisions occur. Our proposed method of recording the molecular free path for every time step carry some advantages in our investigation. One advantage is that we avoid keeping track of two successive collisions and correspondingly assigning the free path to a specific point between the positions of the two collisions. Instead the free path will be assigned to the molecules current position. Another advantage is that data recording of the free path can be made to be a molecular attribute together with pre-existing attributes such as position and veloc-ity.
2.2 Geometry and periodic boundaries
trans-ferring any molecule that passes into it to a perpendicular po-sition at the opposite boundary of the cube, retaining the same velocity.
An issue of these simulations is deciding an appropriate length of the side of the cube geometry. Ideally a large cube would be modelled but since the computational cost of molecu-lar dynamics is severe for simulating gas at the micro scale5we aim to find the smallest volume of the cube that still presents rea-sonable results. Here we define the three simulated cube cases
lA, lB andlC for neon which are named after their used side-length defined by its relation to the unconfined mean free path. For neon gas this quantity is denoted,λNe, and the corresponding simulated cube side-lengths are:
lA=0.50×λNe lB=0.75×λNe and lC=1×λNe. (8)
Filling the cube caseslA, lB andlC requires 6084, 20520 and 51105 molecules respectively given the properties of neon at STP with a the molar mass, M=20.18[kg/kmol]. A mesh is applied to thelA,lB andlC cases consisting of 63, 123and 163 cells respectively. The amount of cells are chosen so that there are more than 10 molecules on average per cell, and so that the cells are sufficiently small, as this often decrease the computa-tional time cost [7]. Helium and argon gas are modelled using the side length oflB=0.75×λNe=0.92475×10⁻⁷[m]in a mesh of 12×12×12 cells containing 20520 molecules. This case corre-sponds to sidelengths of 0.54×λHeand 1.5×λArfor helium and argon respectively, whereλHeandλArare the unconfined mean free paths of helium and argon.
It is also interresting to investigate how many collisions by average a molecule experiences during these simulations. This is estimated by calculating the average collision time period given by:
τ= λ Cpr
, (9)
where
Cpr=
√
2RT, (10)
is the most probable molecular velocity in the Gaussian velocity distribution. For the given gas conditions we get the values listed in table 3.
5The normal computational cost of molecular dynamics scales as the square
to the amount of simulated molecules, however this molecular dynamics model has a computational cost with a linear dependency on the number of simulated molecules [6, 7].
P1
P3 P4
P6
P5 P2
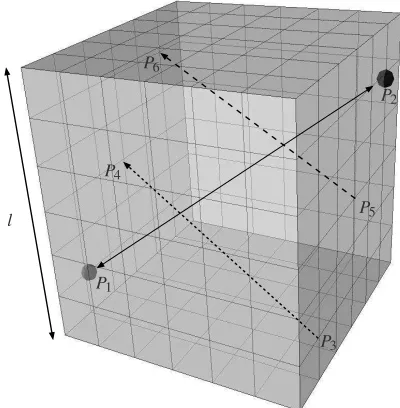
[image:5.595.342.542.128.332.2]l
Figure 2. An example of the cube shaped simulated molecular dynam-ics geometry with periodic boundary conditions on all faces. The side lengthlis illustrated of the cube which consists of either63,123or163
cells for thelA,lBandlCcases respectively. An example is illustrated of
how a molecule travels from pointP1toP2through the periodic
bound-aries showed by dashed arrows, in the orderP1→P3→P4→P5→
P6→P2. This travelled distance is different from the spatial difference
illustrated by the solid double headed arrow betweenP1andP2.
Table 3. Molecular data for helium, neon and argon consisting of the most probable molecular velocity,Cpr, the average time period between
collisions,τ, and the average amount of collision per molecule during the simulated time of 3 nano seconds,Ncol.
Gas: He Ne Ar
Cpr[m/s] 1065.28 474.52 337.19
τ×1010[s] 2.22 2.60 1.82
Ncol 13.5 16.5 11.6
2.3 Attributes needed for recording the free path
Due to the periodic boundary conditions it is not convenient to directly record the travelled distance of the molecule as a dif-ference between the current position of the molecule and the po-sition of its last collision, as illustrated in Fig. 2. Instead we obtain the molecular free path,las follows:
l= (tC−tLC)×S pC, (11)
[image:5.595.355.537.520.595.2]where the following attributes are used: the time of the last occur-ring collision,tLC, the current simulated time,tC and the current speed of the molecule,S pC. With these requirements we need to implement the molecular dynamics molecular attributes:tLCand
Col. The attributetLCis set to the current simulation time when a collision occurs. The attributeCol keeps track of whether a molecule is undergoing a collision, being activated (set to 1) if the molecule is closer to any other molecule thanσand deacti-vated (set to 0) if the molecules are at a distance greater thanσ, in case it is already activated.
It should be noted that this recording of the mean free path does not affect the way the original molecular dynamics simula-tion predicts the gas behaviour.
2.4 Molecular Dynamics setup and results
The molecules are initially spatially distributed in the do-main in a single cubic crystal arrangement and given a random Gaussian velocity distribution, corresponding to the set gas tem-perature of 273.15[K]. The newly defined molecular dynamics attributes for recording the free path (tCandCol) are set to zero, which is why our results of the mean free path will be zero at the start of the simulation.
We have performed two sets of measurements for the mean free path. One considers the unbounded mean free path pre-viously described where both the mean free path when all oc-curring collisions are considered independent of the number of molecules taking part as well as a measurement of the mean free path where only binary collisions occur, corresponding to the theory on which the conventional definition of Eq. (1) is based. This will allow us to validate the dilute gas assumption from Eq. (2). The other set of measurements concerns the mean free path when a wall is introduced to the simulated gas, yielding specular reflections.
Experimental results considering unconfined mean free paths
In this section we model an unbounded gas package with peri-odic boundary conditions, where we first choose not to include any restriction of recording on the number of molecules taking part in the same collision.
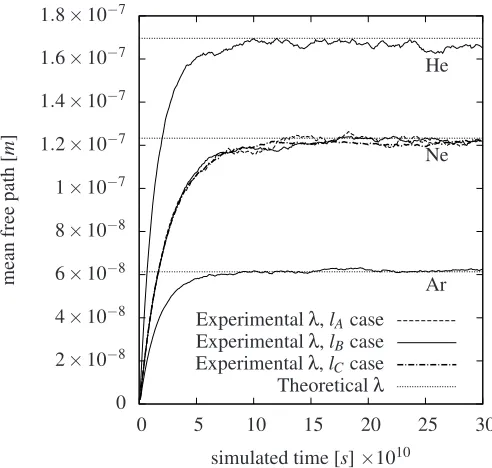
In Fig. 3 we see the results of the recorded mean free paths for thelA,lB andlC cases for neon and for thelBcases for he-lium and argon. For the lB cases we achieve the mean free path values for helium, neon and argon of 1.651×10⁻⁷[m], 1.221×10⁻⁷[m] and 0.625×10⁻⁷[m] respectively at the sim-ulation time of 3×10⁻⁹[s]. The achieved mean free paths by molecular dynamics differ therefor from the corresponding val-ues of the conventional definition within about 1% for neon and argon and within about 2.5% for helium. For thelAandlCcases for neon we obtain a value of 1.215×10⁻⁷[m] and a value of 1.221×10⁻⁷[m] at the simulation time of 3×10⁻⁹[s]
respec-tively. It is considered that the argon gaslBcase reassembles the best fit with the conventional values which could be explained by this gas has the shortest mean free path among the three gases, whereas the bounding box is in this respect relatively large com-pared to the other cases. However, alllBgas cases has an accept-able accuracy which is why we chosen to perform all further in-vestigation involving periodic boundaries to have a domain width oflB(including the simulation of helium and argon).
0 2×10⁻⁸ 4×10⁻⁸ 6×10⁻⁸ 8×10⁻⁸ 1×10⁻⁷ 1.2×10⁻⁷ 1.4×10⁻⁷ 1.6×10⁻⁷ 1.8×10⁻⁷
0 5 10 15 20 25 30
m
ea
n
fr
ee
p
at
h
[
m
]
simulated time [s]×1010 Experimentalλ,lAcase Experimentalλ,lBcase Experimentalλ,lCcase Theoreticalλ
He
Ne
[image:6.595.326.572.257.491.2]Ar
Figure 3. Convergence of thelA=0.50×λNe,lB=0.75×λNeand
lC =1×λNe cases for neon gas and thelB=0.54×λHe case for
helium and thelB=1.50×λArcase for argon, plotted against molecular
dynamics simulation time. The conventional values of the mean free paths are illustrated by the straight dashed lines at values listed in table 1.
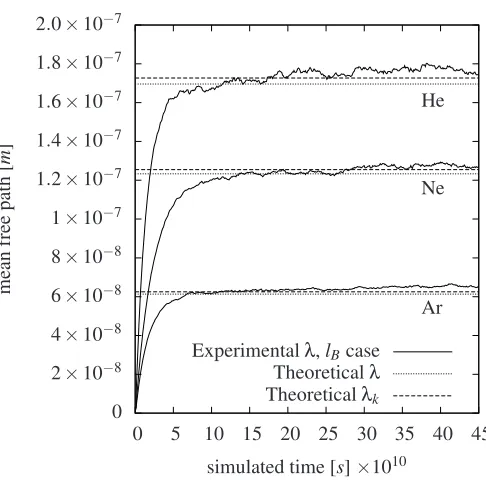
We also perform an investigation where we prevent the recording of more than two molecules taking part in a collision by discarding a molecule to be considered to undergo a colli-sion if its counter part molecule is already undergoing a collicolli-sion i.e. a molecule withCol=0 can not collide with a molecule with
Col=1. In this section we have only simulated thelBcases for helium, neon and argon where we compare the results with the theoretical mean free values of bothλby Eq. (1) andλkby Eq. (6). We see in Fig. 4 that all the mean free path results by molec-ular dynamics achieves higher values compared to when multiple molecular collisions are considered, as expected, and the results corresponds now better with the theoretical λk values than the theoretical λvalues. The results reaches steady-state values at about a simulation time of 4.5 nano seconds as seen in Fig. 4. Due to the fluctuating values of the mean free path results an average value has been calculated for the time period between 3 nano seconds to 5 nano seconds which yielded the values of 0.652×10⁻⁷[m], 1.274×10⁻⁷[m]and 1.770×10⁻⁷[m]for he-lium, neon and argon respectively, which are calculated to be 6.7%, 4.2% and 4.1% higher than the results for when multi-ple molecular collisions are considered at 3 nano seconds. Even though these mean free path results are slightly higher then the mean free path results when multiple molecular collisions are considered we can note that the dilute gas approximation of Eq. (2) is seemingly fulfilled but might not be valid for all fields of investigations. We also see that the convergence to a steady-state occurs later, compared to when collisions by multiple molecules are taken into account. This is presumably because some col-lisions are discarded whereby fewer colcol-lisions are recorded per time step.
2.5 Modelling the mean free path affected by bound-ing surfaces
Here we investigate the surface effects of walls on the mean free path of neon, taking into consideration that a gas molecule’s collision with a wall should yield a shortening of the mean free path in the same way as if an intermolecular collision occur. We conduct such measurements in a six sided configuration using two reflective surface boundaries (in the x direction) together with two pair of periodic boundaries (in theyandzdirections) see Fig. 5. The reflective surfaces are chosen to yield only spec-ular reflections, where the molecspec-ular tangential velocity is main-tained and the molecular normal velocity just changes sign.
In determining the wall effects on the free paths we will once again use the formulation for the travelled distance of a molecule since it experienced its last collision given by Eq. (11). The re-flective surfaces will then be used in two different ways. Firstly and more intuitively we will use it to simulate a wall, by setting
tC to current simulated time, as done before for inter gas molec-ular collisions. Secondly we aim to use the reflective surfaces to
0 2×10⁻⁸ 4×10⁻⁸ 6×10⁻⁸ 8×10⁻⁸ 1×10⁻⁷ 1.2×10⁻⁷ 1.4×10⁻⁷ 1.6×10⁻⁷ 1.8×10⁻⁷ 2.0×10⁻⁷
0 5 10 15 20 25 30 35 40 45
m
ea
n
fr
ee
p
at
h
[
m
]
simulated time [s]×1010 Experimentalλ,lBcase
Theoreticalλ
Theoreticalλk He
Ne
[image:7.595.328.571.125.365.2]Ar
Figure 4. Convergence of the lB cases for helium, neon and argon
gases when only binary molecular collisions are taken into account, plot-ted against molecular dynamics simulation time. The conventional theo-retical values forλandλkare included for comparison.
simulate the bulk of the flow. This is done by setting all reflected molecules to have experienced a collisionless travel of one mean free path by settingtC equal to the current simulated time minus
λNe/S pC, whereλNeis the conventional mean free path for neon gas not affected by solid boundaries.
Using these reflective surfaces we examine the two cases consisting of the mean free path profile affected by a single pla-nar wall and the mean free path profile affected by two plapla-nar walls (illustrated in figure 5).
2.5.1 Results of mean free path affected by one wall For simulating the mean free path of the one planar wall geome-try for neon gas a similar geomegeome-try to the one illustrated in Fig. 5 is used which is configured using the side lengths of 0.75×λNe in theyandzdirections and the length 2×λNein thexdirection. The grading of the mesh is configured in this case so that the near wall cell widths are one forth of the width of the largest cell lo-cated at thex=lposition. This configuration uses 12×12 cells in theyandzdirection and 40 cells in thexdirection. The sim-ulated gas is represented by 56672 molecules and the sampling of theλeffprofile is made over 2 nano seconds taken after 4 nano seconds settlement, in terms of the simulated time.
The molecular dynamics results of the mean free path af-fected by wall collisions is compared to a theoretical model for a gas in the vicinity of one wall achieved by physical reasoning
z
x
[image:8.595.61.289.119.296.2]y
l
Figure 5. An example of a simulated molecular dynamics geometry with reflective surfaces in thexdirection, atx=0andx=l. The length of the geometry extending in the x direction is denoted byland the width and height of the geometry is0.75×λNe. Periodic boundary conditions
are applied in theyandzdirections. The mesh shown consists of60× 12×12cells in thex,yandzdirections respectively. For the two planar wall case, shown here, the cells are graded in thexdirection so that the cell width atx=0and atx=lare one forth of the width of the cell width atx=l/2.
presented by E. Arlemark [3], expressed by:
λT eff=1−
1 82
exp
−λx
Ne
+4 7
∑
i=1exp
−cos( (2i x
−1)π/28)λNe
+2 6
∑
i=1exp
− x
cos(π/14)λNe
#
. (12)
We have also compared results with Stops [12]λeffmodel, con-sidering the effects from one wall, which is described by:
λSteff= 1 2
2+x
λ−1
exp−λx−λx2Eix
λ
, (13)
where the functionEiis the exponential integral function defined as:
Ei(z) =
Z ∞
1
t−1exp(−zt)dt. (14)
Also plotted in Fig. 5 is the two-term exponential curve fit
to the molecular dynamics data given by:
λCF
eff =λNe−
λNe 2
0.4561 exp
−5.850x
λNe
+0.5706 exp
−1.039x
λNe
. (15)
0.3 0.4 0.5 0.6 0.7 0.8 0.9 1
0 0.5 1 1.5 2
m
ea
n
fr
ee
p
at
h
,
λef
f
/
λ
wall distance,x/λ
[image:8.595.328.571.156.495.2]MFP profile by MD,lBcase MD data exp-fit MFP profile by Theory, Arlemark MFP profile by Theory, Stops
Figure 6. Mean free path profile achieved by Molecular Dynamics and achieved by theoretical model from physical reasoning.
It can be seen in Fig. 5 That the theoretical models achieves the same near wall values and bulk values as the values achieved by the molecular dynamics simulation. However the results of the
λeff profile from the molecular dynamics simulation is slightly higher than the theoretical models at approximately the wall dis-tance ofx=0.5/λNe.
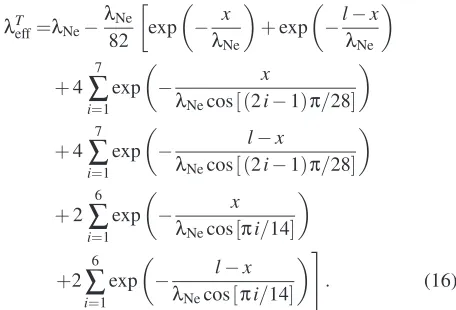
2.5.2 Results of mean free path effected by two walls In this section the reflective surface atx=l is repaced with a planar wall yielding specular reflections. The simulated geome-try has a side length of 0.75×λNein theyandzdirections and 2×λNeand 1×λNein thexdirection representing simulations of
Kn=0.5 andKn=1 cases.
wall confinement achieved by physical reasoning presented by E. Arlemark [3], expressed by:
λTeff=λNe−λNe 82
exp
−λx
Ne
+exp
−lλ−x
Ne
+4 7
∑
i=1exp
−λ x
Necos[ (2i−1)π/28]
+4 7
∑
i=1exp
−λ l−x
Necos[ (2i−1)π/28]
+2 6
∑
i=1exp
−λ x
Necos[πi/14]
+2 6
∑
i=1exp
−λ l−x
Necos[πi/14]
#
. (16)
We have included Stops [12]λeffmodel for two walls for com-parison which is described by:
λSteff= 1 2
2+x
λ−1
exp−xλ−λx2Eix
λ
+
l
−x
λ −1 exp l −x λ − l −x λ 2 Ei l −x λ # . (17)
We also use the molecular dynamics curve fit data of the λeff profile for one wall presented by Eq. (15), which we reformulate in an attempt to predict theλeffprofile for two walls as follows:
λCF
eff =λNe−
λNe 2
0.4561 exp
−5.850x
λNe
+0.5706 exp
−1.039x
λNe
+0.4561 exp
−5.850(l−x)
λNe
+0.5706 exp
−1.039(l−x)
λNe
, (18)
using similar reasoning as for the theoretical model of Eq. (16). The results of the molecular dynamicsλeffprofile is plotted in Fig. 7 together with the modified curve fit data for two walls represented by Eq. (18). In addition the theoretical models for theλeffprofiles given by Eq. (16) and Eq. (17) are plotted in Fig. 7. All theλeffprofiles described above are presented in Fig. 7 for
Kn=0.5 andKn=1. Whereas an additional comparison is made using just the two wall curve fit model of Eq. (18) and the two wall theoretical models of Eq. (16) and Eq. (17) forKn=0.2.
It is seen that the threeλeffprofiles all have about the same near wall value while the bulk values differs significantly, except for theKn=0.2 case. In theKn=0.5 case the curve fit data matches the data from the molecular dynamics simulation the best in the near wall area but the theoretical model the best in the bulk. The separation between theλeffprofile from the molecular dynamics simulation is the most different from the theoretical models for theKn=1 case, where the curve fit model represents the values of the molecular dynamics data the best throughout the simulated domain. 0.3 0.4 0.5 0.6 0.7 0.8 0.9 1
0 0.2 0.4 0.6 0.8 1
m ea n fr ee p at h , λef f / λ
wall distance,x/l
MD data exp-fit MFP profile by Theory, Arlemark MFP profile by Theory, Stops MFP profile by MD,lBcase
Kn=0.2
Kn=0.5
[image:9.595.64.292.164.319.2]Kn=1
Figure 7. Mean free path profile achieved by molecular dynamics, the-oretical model achieved by from physical reasoning and mean free path curve fit model from one wall molecular dynamics simulation.
3 DISCUSSION AND CONCLUSIONS
In this paper we use molecular dynamics to record the molecular travelling distances between collisions of helium, neon and argon gases at standard temperature and pressure con-ditions and compare with corresponding conventional theoretical values. If we record the molecular free paths that are due to mul-tiple molecular collisions we achieve steady-state values for the unconfined mean free paths which are within 1% accuracy for argon and neon and within 2.5% accuracy for helium compared to the conventional theoretical values. However, if we record the
mean free paths for molecules that only experiences binary col-lisions we find that these steady-state results are 6.7%, 4.2% and 4.1% higher than the results where all collisions are considered. This difference might be significant in some cases yielding that the dilute gas approximation might not always be valid. Planer walls with specular reflection characteristics are introduced to the simulated molecular dynamics geometry and the mean free path is recorded at various wall distances in order to compare with physically derived models. It is found that the theoretical mod-els and the molecular dynamics method show similar results for singular wall geometries and two parallel planar wall cases up to Knudsen numbers of about 0.2.
We conclude that we are capable of reproducing the uncon-fined mean free path values of the conventional expression using molecular dynamics and in addition model how the mean free path varies with distance to a wall which is compared to var-ious theoretical models. Such results will prove useful as the modelling of micro-gas-flows using Navier-Stokes equations can be done by incorporating a non-linear stress/strain rate relation-ship with knowledge of the variation of the mean free path with wall distance [3]. The knowledge of the affect of walls on the mean free path will also be useful for the boundary conditions of Navier-Stokes equations because they are dependent on a near wall value of the mean free path.
Altough we have managed to capture some of the theoreti-cal predictions of the mean free path using molecular dynamics further investigation on various types of gas molecular collisions with walls could yield better understanding of, for instance, sec-ond order effects concerning not only specular collisions but also diffusive reflections and mixtures of these reflections.
ACKNOWLEDGMENT
The authors would like to thank Graham Macpherson and Matthew Borg for helpful discussions. This research is funded in the UK by the Engineering and Physical Sciences Research Council under grant number EP/D007488/1.
REFERENCES
[1] Cercignani, C., 2000. Rarefied Gas Dynamics: from Ba-sic Concepts to Actual Calculations. Cambridge University Press.
[2] Kandlikar, S., Garimella, S., Li, D., Colin, S., and King, M. R., 2005.Heat Transfer and Fluid Flow in Minichannels and Microchannels. Elsevier.
[3] Arlemark, E. J., Dadzie, S. K., and Reese, J. M. “an ex-tension to the Navier-Stokes equations to incorporate gas molecular collisions with boundaries”. to be published in Journal of Heat Transfer.
[4] Nordling, C., and ¨Osterman, J., 1999. Physics Handbook: for Science and Engineering, 6 ed. Studentlitteratur.
[5] OpenFOAM, the Open Source CFD Toolbox,
http://www.opencfd.co.uk.
[6] Macpherson, G. B., and Reese, J. M., 2008. “Molecular dy-namics in arbitrary geometries: parallel evaluation of pair forces”.Molecular Simulation,34(1), pp. 97–115.
[7] Macpherson, G. B., Borg, M. K., and Reese, J. M., 2007. “Parallel generation of molecular dynamics initial config-urations in arbitrary geometries”. Molecular Simulation, 33(15), pp. 1199–1212.
[8] Karniadakis, G., Beskok, A., and Aluru, N., 2005. Mi-croflows and Nanoflows: Fundamentals and Simulation. Springer.
[9] Bird, R. B., Stewart, W. E., and Lightfoot, E. N., 2003.
Molecular Gas Dynamics and the Direct Simulation of Gas Flows. Oxford Science Publications.
[10] Bird, G. A., 2003.Molecular Gas Dynamics and the Direct Simulation of Gas Flows. Oxford Science Publications. [11] Guarini, E., Bafile, U., Barocchi, F., Demmel, F.,
Formisano, F., Sampoli, M., and Venturi, G., 2005. “Col-lective excitations in liquid cd4: Neutron scattering and molecular-dynamics simulations”. Europhysics Letters, 72(6), pp. 969–975.
![Table 1.GAS DATA FOR STANDARD TEMPERATURE PRESSURE. [4]](https://thumb-us.123doks.com/thumbv2/123dok_us/1698561.123235/3.595.348.548.140.233/table-gas-data-for-standard-temperature-pressure.webp)
![Table 2.Lennard-Jones parameter data.commonly used data, where data for helium is from [9] and data for neonand argon is from [10]](https://thumb-us.123doks.com/thumbv2/123dok_us/1698561.123235/4.595.324.577.138.376/table-lennard-jones-parameter-commonly-helium-neonand-argon.webp)