Sensitivity analysis of the CREAM method for Human Reliability
Tim Bedford* and Clare Bayley
* corresponding author
Department of Management Science
Strathclyde Business School
University of Strathclyde
40 George Street
Glasgow
G1 1QE
Email: [email protected]
M
M
M
a
a
a
n
n
n
a
a
a
g
g
g
e
e
e
m
m
m
e
e
e
n
n
n
t
t
t
S
S
S
c
c
c
i
i
i
e
e
e
n
n
n
c
c
c
e
e
e
2
ABSTRACT
This paper reports a sensitivity analysis of the CREAM HRA method. We consider three different aspects: the difference between the outputs of the Basic and Extended methods, on the same HRA scenario; the variability in outputs through the choices made for common performance conditions (CPCs); the variability in outputs through the assignment of choices for cognitive function failures (CFFs). We discuss the problem of interpreting categories when applying the method, and discuss also how dependence is modelled with the approach. We show that the control mode intervals used in the Basic method are too narrow to be consistent with the Extended method. This motivates a new screening method that gives improved accuracy with respect to the Basic method, in the sense that (on average) halves the uncertainty associated with the Basic method.
Keywords: Human reliability, human failure, CREAM, sensitivity, screening
1. INTRODUCTION
The CREAM method was introduced by Hollnagel in 1998 [1]. …. Alongside the ATHEANA method, CREAM is one of the main examples of a so-called second generation human reliability method. CREAM is designed to take better account of context than the earlier first generation methods. It is also notable in two other ways. First, it has both a basic and an extended version, thus allowing a preliminary analysis to take place using the basic version before a decision is made to give a more detailed analysis. Second, the description of the model is easily accessible in the public domain.
In this paper we carry out a sensitivity analysis of the CREAM method. This is done through considering three types of variability:
a) The difference between the outputs of the Basic and Extended methods, on the same HRA scenario.
b) The variability in outputs through the choices made for common performance conditions (CPCs).
c) The variability in outputs through the assignment of choices for cognitive function failures (CFFs).
In order to support general conclusions we have investigated **** different task analyses. In addition to discussing the above outputs we also discuss our own, limited, experience of selecting categories in the method.
We have not considered how individual action failure probabilities are combined into an overall failure probability for a complete task, as this is carried out according to the task failure logic and is therefore comparable with other HRA methods. A study of this aspect would therefore not provide information about the contribution of CREAM to HRA.
2. Description of CREAM, the Cognitive Reliability
and Error Analysis Method
CREAM is a so-called second generation method for assessing human reliability. The method sets aside the errors of commission/errors of omission categorization that is common in other methods and which, in particular provided much of the motivation for the other well-known second generation method ATHEANA. CREAM in fact consists of two methods – a basic and an extended version – which operate slightly differently. Cognition is included in the model through the use of four basic “control modes” that describe the different levels of control that an operator has in a given context, and that guide the probability of failure in the basic version of the method:
• Scrambled control, where the choice of next action is unpredictable or haphazard. The situation may be changing rapidly in unexpected ways and hence the operator will not have an opportunity to think about the next action. The probability of action failure in this control mode is supposed to be in the interval [1.0 E-1 , 1.0 E-0].
• Opportunistic control, where the next action is determined by superficial
• Tactical control, where performance typically follows planned procedures although some ad hoc deviations are possible. The probability of action failure in this control mode is supposed to be in the interval [1.0 E-3 , 1.0 E-1].
• Strategic control, where enough time is available to consider the actions in the light of wider objectives and context. The probability of action failure in this control mode is supposed to be in the interval [0.5 E-5 , 1.0 E-2].
Basic CREAM
The Basic CREAM method is intended to be used as a screening technique in order to identify processes that require a deeper level of analysis, which may then be carried out by the Extended CREAM method if required.
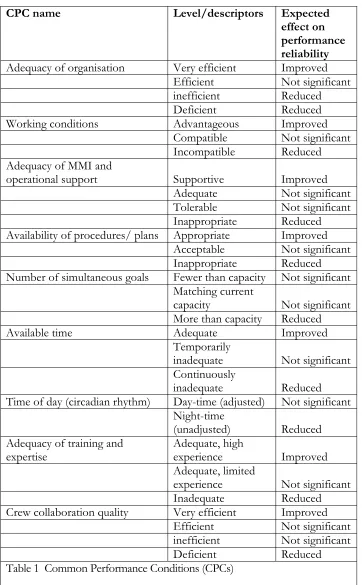
In Basic CREAM a task analysis is carried out prior to further assessment. Common Performance Conditions (CPCs) are assessed according to the descriptors given in Table 1 to judge their expected effect on performance. However these assessments are then adjusted according to some specified rules in order to take account of synergistic effects.
Finally, a simple count is performed of the number of CPCs which are improving reliability and the number that are reducing it. On the basis of this number the probable control mode is determined, by determining the region given in Error! Reference
source not found.. The control mode then determines intervals for general action failure probabilities as described above.
Extended CREAM
The Extended CREAM method works slightly differently. Given the task analysis, a cognitive activity is associated to each of the tasks (taken from a standard list which includes activities such as co-ordinate, communicate, compare, etc). To these activities a COCOM function (one of observation, interpretation, planning and execution) is ascribed. Next the likely cognitive function failures are identified for each task, based on knowledge of the specific task, but following a standard set of generic cognitive function failures associated to the COCOM functions. Each such generic failure has nominal probabilities, based on a table given in CREAM, but these probabilities are adjusted depending on the CPCs. It is important to note also that the adjustment made depends both on the CPCs and on the COCOM function. For example, Adequacy of Organization has no impact on observation or interpretation failures, but does impact on planning and execution failures.
Having obtained adjusted failure probabilities for each of the tasks in the task analysis, the analyst then combines them according to the underlying failure logic of the task.
The Extended CREAM method provides a clear structure in which the analyst has to work. Given that the task analysis has been carried out, the choices that the analyst has to make are:
1. The allocation of COCOM function to each task.
2. The selection of the “most credible” or “most likely” failure mode for each task. 3. The specification of CPC levels for the whole activity.
probability in Basic CREAM (through the determination of the control mode), they determine the relative level of failure probability in Extended CREAM. This is a major difference between the two methods. Another major difference is that within Basic CREAM the underlying task analysis does not appear to play a role in determining the control mode: the control mode only depends on the CPC values. Note that Hollnagel also describes what might be called a simplified-extended version of the method in which the adjustments to nominal probabilities are determined through the control mode. For the purposes of this paper we do not consider this simplified-extended version.
It should be made clear that Hollnagel presents the numbers he provides – weights and probabilities – as plausible rather than as definitive. (Indeed, the qualitative classes are provided on the same basis with acknowledgement that other categories would be required to model HRA problems outside the environment that he has worked in.) Hence our exploration of the consistency of Basic and Extended CREAM contributes to a discussion of what adjustments could be considered.
Dependency and uncertainty
It is worth making a few remarks about the way that CREAM deals with dependency and uncertainty. The Basic method explicitly mentions dependency, but this is not
probabilistic dependency. Instead it is simply a computational rule in the definition of the control mode. Probabilistic dependency is implicit within both Basic and Extended methods through the CPCs: different tasks are independent given the CPC levels, but dependent if the CPCs are not specified. This is the only way that dependency is modelled, and is similar to other HRA methods in this respect.
Uncertainty in the output probabilities is very explicit in the Basic method, through the control mode intervals, which cover a range of possible probability values. The extended method provides 0.05 and 0.95 values for the nominal probabilities, but without
explaining what these mean. We could take these values to represent the residual uncertainty given other unspecified conditions (Bayesian epistemic uncertainty) or tolerance uncertainty representing the precision of the method.
3. Numerical Results
Basic CREAM
For the basic version of CREAM, as noted above, the numerical results are given in terms of an interval of probabilities which depends on the control mode for the problem. This in turn depends only on the assessment of the CPCs.
Taking account of the different levels that a CPC can take (4 for Adequacy of organisation, 3 for Working conditions, etc), there are in total
4x3x4x3x3x3x2x3x4= 31104
different combinations of CPC levels. In fact, some of these combinations are
scorings in the basic and extended versions and therefore could be combined into one level. This happens for two other CPCs as well. Hence in effect there are actually
4x3x3x3x2x3x2x3x3=11664
different combinations. In order to give results from the perspective of the full set of qualitative levels available to the analyst, our results are based on the full 31104 different possible input combinations.
By considering all different combinations and applying the rules for dependencyi we were able to calculate in each case what the corresponding control mode would be. A
histogram showing the frequency for each control mode is shown in Figure 1. This shows that 52% of all possible CPC combinations give a Tactical control mode, 37% give an Opportunistic control mode, while about 7% give Scrambled and 4% Strategic. These results are rather different from the visual impression given by Error! Reference source not found., which makes Strategic seem larger (17% of the area) and Opportunistic and Tactical smaller than they are realized when you take all CPCs into account.
It is important to note that the Task Analysis only plays a role in the assessment through the support it gives to the analyst in selecting the appropriate CPC levels. In other words, any two tasks with the same CPC levels will be assessed as having the same control mode and failure probability interval. Because the control mode modulates the failure
probability in an absolute sense, the CPCs have an absolute (as opposed to a relative) effect on the failure probability.
Extended CREAM
As with Basic CREAM there are 31104 different combinations of CPC levels which affect the overall probability calculations through weighting factors. For 3 of the CPCs the weights are identical across more than one level, so that effectively there are only
4x3x3x3x2x3x2x3x4= 15552
different sets of weights. As discussed above, our results are based on the full 31104 different possible input combinations.
Unlike in Basic CREAM, the CPCs have a multiplicative scaling effect on the underlying nominal probability of failure. Therefore one can consider the CPC weightings in isolation from the other modelling aspects. Different weights are computed for Observation, Interpretation, Planning and Execution errors. Basic statistics about the weights are shown in Table 2. This shows that
1. Weights are skewed to increase, more than decrease, nominal probabilities. 2. The total adjustment range is much smaller for Interpretation than for the other
COCOM functions, with the ratio of biggest to smallest possible weight equal to 2400 for Interpretation and 93750 for Execution.
3. The (geometric mean) average weight ranges from 2.97 for Interpretation to 5.58 for Execution.
The weights are used to scale a nominal failure probability which depends not only on the COCOM function, Observation, Interpretation, Planning and Execution, but on a
Unfortunately, the nominal failure probabilities of these failure types range from 0.2 to 0.0005, so that if the Basic method were to be consistent with the Extended method, it could not give a better level of accuracy. We shall investigate the consistency of the Basic and Extended method further.
When the weight multiplied by the nominal probability is larger than 1, then we have to cut off the value to 1, in order to stay within the allowable probability scale. Taking all possible failure types and all possible CPC combinations, nearly 10% of all values generated are equal to 1.
Consistency of Basic and Extended methods
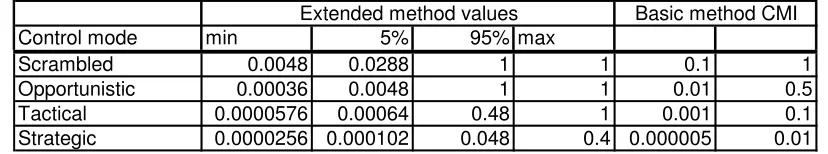
The Extended method uses the 13 different types of failure described above to give a more detailed specification of the task under study. Given a particular set of CPC levels, the Extended method allows us to calculate the probability for each of these failure types, by multiplying the nominal probability by the weighting factor derived for the CPC. The particular set of CPC levels is also associated to a control mode and hence to a range of failure probabilities in the Basic method. In the comparisons below we have always used the basic value for each failure type, hence ignoring (for the moment) the 0.05 and 0.95 values given around the basic value.
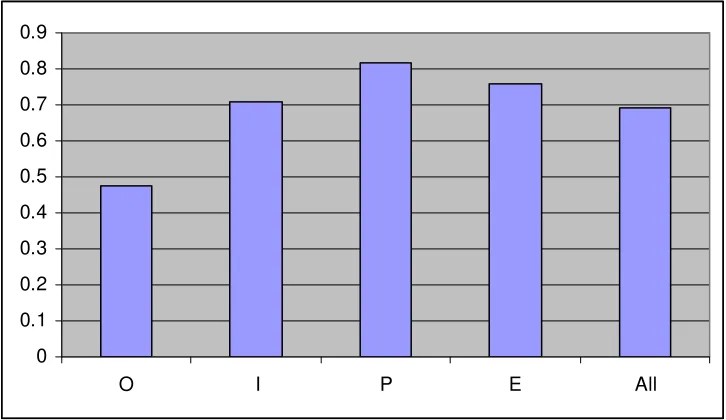
The most straightforward test of consistency between the Basic and Extended methods would be to check that, given a set of CPC levels, all 13 failure probabilities lie in the corresponding control mode probability range. However, if we look across all possible CPC combinations, all 13 failure probabilities are inside the control mode probability range in less than 1% of cases. Figure 2 gives a more detailed picture. The bar labelled All is the 1% figure mentioned above. The other bars show the proportion of CPC combinations for which the Observation, Interpretation, Planning and Execution failure probabilities are all within the corresponding control mode interval (Note that there are 3,3,2 and 5 different failure types in each category respectively, so we only require – for example – 3 numbers to be in the range, rather than 13 when considering All). This shows that, except for Planning, there would be no chance of dramatically improving the consistent of the Basic and Extended methods by additionally specifying the COCOM function in the Basic approach.
A less stringent test of consistency between the Basic and Extended methods would be to look, for each CPC combination, at the proportion of failure probabilities that are in the appropriate control code interval, and then average this proportion across all the CPC combinations. This weaker consistency check gives considerably better results, with an overall average figure of almost 70%. This means that if we randomly choose a failure type from the 13 given (with equal chance for all), and we randomly choose the CPC combination (with each level equally likely), then there is a 70% chance that the Extended method failure probability will be in the Basic method probability range. A deeper analysis, looking at the proportions for Observation, Interpretation, Planning and Execution failure probabilities separately, shows that the Observation numbers are more consistently outside the control mode intervals than the others. This is shown in Figure 3.
that by reverse-engineering intervals for a summary – either the control mode or some other - we could ensure consistency of the screening and advanced method.
Could we improve the consistency by changing the definition of the control mode? It is not possible to redefine the control mode, in a way that only depends on the CPC levels, so that we can guarantee that the Extended method failure probabilities are always in the control mode intervals as these are currently defined. Consider for example the
Observation failure types: The ratio of largest to the smallest failure basic probability in the Extended method is 70, and since the CPC weights affect them all in the same way, the ratio of the adjusted probabilities will always be the same, whatever CPC levels are chosen. In the Basic method we ignore the failure type, and hence can only assess probabilities up to a ratio of at best 70. However, the ratio of highest to lowest for Scrambled and Opportunistic control mode intervals are 10 and 50 respectively, so these intervals can never wide enough. In fact, this same argument shows that we cannot get around the problem by specifying the COCOM function (ie, Observation, Interpretation, Planning or Execution) in addition to the control mode: The Basic method control mode intervals are simply too narrow as they stand.
Below we investigate an alternative screening method that guarantees consistency with the Extended method.
.
4. A new screening method
We show here that by specifying the COCOM function and the number of improving or reducing CPCs, we can provide bounds that work in all cases, and alternatively,
reasonably narrow bounds that hold for more than 90% of failure probabilities.
Uncertainty range within COCOM class
If we specify the COCOM class, but not the precise error type then the basic failure probability is narrowed down to a range. For convenience, instead of giving the range as an interval, we write it using a central point value and an error factor, C and EF. We also work on a logarithmic scaleii so that the log interval is C±EFwhich is the same as
saying that the failure probability lies in the range [a,b] where
EF C b EF C
a)= − ,log( )= +
log( or equivalently
). (
^ 10 ), (
^
10 C EF b C EF
a= − = +
The point values and error factors for each COCOM class are given in Table 4. These have been obtained by direct calculation from the basic values given in Table 9 (p252).
Raw CPC score
Basic CREAM asks the analyst to calculate the number of CPCs that improve reliability and the number that decrease reliability. These numbers are then adjusted by the dependency rules. However, for ease of calculation we ignore the dependency rule and just look at the raw improvement index, r
r=#CPCs improving reliability - #CPCs decreasing reliability.
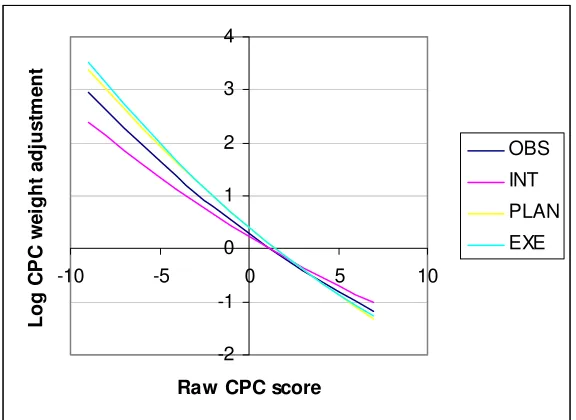
The raw score r can be used to give a surprising accurate approximation to the overall CPC weight, and is used through a simple formula to adjust the central point value. The log CPC weight is approximately
c r b r
a× 2 + × +
where the coefficients a, b and c are given in Table 5. (These coefficients were obtained by regressing the raw score onto the mean log weights for each of the COCOM classes). The log CPC weight is shown graphically in Figure 4.
Since this formula does not give the exact log weight, we have to use another error factor to indicate the discrepancy. Error factors, denoted , have been chosen to ensure there is a 90% accuracy, that is, for each COCOM class and raw improvement index r, 90% of the failure probabilities lie within the error bounds.
CPC EF
We now get our failure probability bounds as
Point value = C+a×r2 +b×r+c
Error factor = EF =EFCOCOM +EFCPC
The error factors are given in Table 6.
If desired, a third error factor can be added to represent the uncertainty in the exact failure type probability, that is, the deviation from basic probability in the 0.05 and 0.95 values given in Table 9 (p252).
We can compare the resulting error factors with those of Basic CREAM. Since we would like to have a fair way of comparing the two methods we consider in both cases the error factors for the actual 90% intervals (for Basic CREAM these are given in Table 7). Then we average the error factor (weighted according to numbers of CPCs in each control mode for the Basic method), which gives 1.2974 as the mean error factor for the Basic method, and 1.1225 for the new method. This represents an improvement in error factor that translates to a typical interval being 2.24 times larger for Basic CREAM than for the new screening method. Hence we can say that the advantage of specifying the COCOM function and the calculating the impact of CPC weight according to our new method is a factor of 2 increase in accuracy, on average.
5. Conclusions
Comments about building a screening model…reverse engineer and look for where the numbers and the qualitative structure marry up to give a better fit
Our general conclusions are
a) There is a considerable difference in model structure for the basic and advanced methods. This is so different that the basic model cannot really be regarded as a simplification of the advanced method. It would be more appropriate to regard them as two distinct HRA models. With respect to the values generated by the methods, it is possible to find scenarios where very different output values are generated, and scenarios where similar outputs are generated. The impact of the CPCs is monotone in both cases, that is, when the CPCs change to a worse state the assessed failure probabilities will tend to increase.
b) The CPCs impact on failure probability through their effect on each of the COCOM functions Observation, Interpretation, Planning, and Execution. Weighting factors for the failure probability are associated with each of these functions. The Execution function has the largest overall variability (that is, in terms of its dependence on the CPCs), with the ratio of largest possible to smallest possible weight equal to 93750 (alternatively, the order of magnitude change in weight from the smallest to the largest value is 10^5). By contrast that for Interpretation is 2400 (order of magnitude 10^3). Observation and Planning are intermediate. This suggests that the CPC “variables” are better tuned to distinguishing differences in execution failures than in interpretation failures. Hence there is a need, with the CREAM method, to look for further CPCs which would help tune the Interpretation failure probability.
c) The CREAM procedure requires the analyst to select the “most likely” or “most credible” (ref to p257) cognitive failure mode for each step in the task analysis. However, when more than one failure mode could occur, it is possible that the impact of the one considered less likely at this step could be more in the final computation due to the different weightings given by the CPCs. Hence by selecting a single “most likely” cognitive failure mode without reference to the context determined by the CPCs it is possible to select a failure mode that does not have the maximum failure probability.
6. Acknowledgments
This research was funded a part of the EPSRC project Rethinking Human Reliability number … We would like to thank our partners within this project….
7. Appendix, References, Vitae, Figure Captions and
then Tables
0 2000 4000 6000 8000 10000 12000 14000 16000 18000
scrambled opportunistic tactical strategic
0 0.1 0.2 0.3 0.4 0.5 0.6 0.7 0.8 0.9
[image:12.595.116.479.72.285.2]O I P E All
Figure 2 Proportion of CPC combinations for which all failure probabilities are in control mode range
0 0.1 0.2 0.3 0.4 0.5 0.6 0.7 0.8 0.9
O I P E All
[image:12.595.116.479.330.540.2]-2 -1 0 1 2 3 4
-10 -5 0 5 10
Raw CPC score
Log C
P
C
w
e
ight
a
dj
us
tm
e
nt
OBS INT
PLAN
EXE
Figure 4 Log CPC weight adjustment depending on COCOM class
0 0.1 0.2 0.3 0.4 0.5 0.6 0.7 0.8 0.9 1
O I P E All
New
[image:13.595.154.442.73.283.2]Basic
CPC name Level/descriptors Expected effect on performance reliability
Adequacy of organisation Very efficient Improved
Efficient Not significant
inefficient Reduced
Deficient Reduced
Working conditions Advantageous Improved
Compatible Not significant
Incompatible Reduced
Adequacy of MMI and
operational support Supportive Improved
Adequate Not significant
Tolerable Not significant
Inappropriate Reduced
Availability of procedures/ plans Appropriate Improved
Acceptable Not significant
Inappropriate Reduced
Number of simultaneous goals Fewer than capacity Not significant Matching current
capacity Not significant More than capacity Reduced
Available time Adequate Improved Temporarily
inadequate Not significant Continuously
inadequate Reduced Time of day (circadian rhythm) Day-time (adjusted) Not significant
Night-time
(unadjusted) Reduced Adequacy of training and
expertise
Adequate, high
experience Improved Adequate, limited
experience Not significant
Inadequate Reduced
Crew collaboration quality Very efficient Improved
Efficient Not significant
inefficient Not significant
[image:14.595.119.481.66.651.2]Deficient Reduced
Table 1 Common Performance Conditions (CPCs)
OBS INT PLAN EXE
max 960 240 3000 4800
min 0.064 0.1 0.05 0.0512
max/min 15000 2400 60000 93750
geomean 1.779239 1.60523 2.098758 2.109595
Control mode min 5% 95% max
Scrambled 0.0048 0.0288 1 1 0.1 1
Opportunistic 0.00036 0.0048 1 1 0.01 0.5
Tactical 0.0000576 0.00064 0.48 1 0.001 0.1
Strategic 0.0000256 0.000102 0.048 0.4 0.000005 0.01
[image:15.595.90.504.72.149.2]Extended method values Basic method CMI
Table 3 “Reverse engineering” the control mode upper and lower values
OBS INT PLAN EXE
Point val -2.0775 -1.3495 -2 -2.412
EF cocom 0.923 0.651 0 0.89
Table 4 COCOM failure probability uncertainty bounds
OBS INT PLAN EXE
a 0.0055 0.0041 0.0052 0.0065
b -0.2458 -0.2046 -0.2828 -0.286
c 0.284 0.2244 0.4019 0.4079
Table 5 Coefficients for log CPC weight
OBS INT PLAN EXE
EF cocom 0.923 0.651 0 0.89
EF cpc 0.456 0.521 0.826 0.223
EF total 1.379 1.172 0.826 1.113
Table 6 Error factors for new screening method
Control mode Actual EF ( 90% fit) CMI EF
Scrambled 0.77 0.5
Opportunistic 1.159 0.849
Tactical 1.438 1
[image:15.595.187.411.401.468.2]Strategic 1.335 1.651
Table 7 Error factors for CREAM Basic
REFERENCES
1. Hollnagel, E., Cognitive Reliability and Error Analysis Method - CREAM. 1998, Oxford: Elsevier Science.
i We changed the rule for dependency as described in the method for the CPC Number of simultaneous goals: The dependency rule described indicates combinations of other CPCs that lead to a change the assigned level for this particular one. As the rule is described, the CPC could be changed to an improving level, but according to Table 3 (page 241), reproduced in Table 1 here, this particular CPC only has not significant or reduced effect
on performance reliability. Hence in our implementation of the rule we keep the CPC at its best level of not significant where the rule would normally require us to place it at the improving level.