The Permeability of Ablative Materials Under Rarefied
Gas Conditions
Craig Whitea,∗
, Thomas J. Scanlonb
, Richard E. Brownb
a
School of Engineering, University of Glasgow, Glasgow G12 8QQ, UK
b
Department of Mechanical and Aerospace Engineering, University of Strathclyde, Glasgow G1 1XJ, UK
Abstract
Numerical meshes of both cork and carbon fibre ablative materials in their
virgin and pyrolised states, with realistic porosity and tortuosity, have been
created from micro-computed tomography (µCT) scans. The porosity of
each material has been calculated from the µCT scans and used to extract
smaller representative sample volumes to perform numerical simulations on.
Direct simulation Monte Carlo simulations of rarefied gas flow through these
materials have been performed to find the permeability of each material to
argon gas and to a gas mixture. The method has been validated by
compar-ing the measured permeability for a Berea sandstone material to previously
published experimental values. For the specific pressure conditions
investi-gated here, the cork-phenolic material becomes around ten mores permeable
after being pyrolised, while the carbon-phenolic material only becomes five
times more permeable than its virgin form. The permeability to the gas
mix-∗Corresponding author
Email addresses: craig.white.2@glasgow.ac.uk(Craig White),
ture is found to be greater than to argon for most of the samples, showing
the importance of choosing the correct gas for rarefied permeability studies.
The form of the pressure and Mach number profiles through the materials is
indepedent of the applied pressure gradient.
Keywords: permeability, rarefied gas, ablation, re-entry, CT scan, DSMC
Nomenclature
A cross-sectional area, m2
b Klinkenberg slip correction factor, Pa
c molecular velocity vector, m/s
cr relative speed, m/s
D characteristic length, m
d molecular diameter, m
F force vector, N
f normalised velocity distribution function
J binary collision integral
Kn Knudsen number
k permeability, m2
k0 permeability to a liquid, m2
L length, m
M molar weight, kg/mol
m molecular mass, kg
˙
m mass flowrate, kg/s
n number density, m−3
r position vector, m
T temperature, K
X molar fraction
Zrot rotational relaxation number
Greek
Θv characteristic vibrational temperature, K
λ mean free path, m
µ viscosity, kg s−1
m−1
ξ molecular cross-section, m2
ρ mass density, kg/m3
Ω solid angle, rad
ω viscosity exponent
Superscripts
∗ post-collision properties
Subscripts
in inlet properties
out outlet properties
1. Introduction
During an atmospheric entry, a space vehicle is subjected to extremely
high heating loads due to the temperatures of the gas in the shock layer
immediately upstream of the vehicle. Historically, a single-use ablative heat
shield was used as a thermal protection system (TPS) to ensure that the
vehicle could survive this extreme heating load; however, as space access
stations and the Space Shuttle, the research focus switched to re-usable
ther-mal protection systems. Recent missions have ventured further than low
Earth orbit, and have therefore required more robust heat shields. For this
reason, a shift back to ablative heat shields has been observed recently. For
example, the Stardust sample return mission [1] used a phenolic impregnated
carbon ablative heat shield [2].
During the ablation process, the heat load applied to the material is
dispersed first through the melting of a phenolic filler resin that results in
the production of pyrolysis gases; in addition to absorbing energy through
the melting process, the pyrolysis gas is blown in to the boundary layer
and reduces the heat flux at the surface by preventing the hot gas from the
shock layer from penetrating to the surface. In addition to pyrolysis gas
blowing, ablation takes place, which is the degradation of material through
thermal, chemical, and mechanical processes. The heat shield is damaged
under the extreme aero-thermo-mechanical loads, but the spacecraft itself
remains intact, protecting the payload and humans from the harsh re-entry
environment. Besides the safety aspect, it is also important to ensure that the
mission is as cost-effective as possible; one aspect of this can be designing
a TPS that is as small and light as possible so that more payload can be
carried.
The ablation process is highly complex and multidisciplinary, and so
un-derstanding it well enough to design optimised heat shields remains an
engi-neering challenge. One key area is the flow of the pyrolysis gas products out
of the material and into the boundary layer. Ablative heat shields are made
pyrolysis gas blowing can then be thought of as the flow of a compressible
fluid through a porous material, which is driven by a pressure gradient
be-tween the base of the pyrolysis zone and the stagnation pressure at the outer
edge of the heat shield. Three-dimensional effects may also be important,
with flow also escaping from the sides of an ablative material [3]. The
prop-erty that defines how easily a fluid can traverse a porous medium is know
as permeability. It is important when developing predictive tools for
abla-tive materials to have a good understanding of how the permeability of the
material changes with temperature, gas pressure, and the degree of material
breakdown.
The average permeability k (m2) of a porous medium to a compressible
fluid is given by [4]:
k= QµL˙
A
2Pout
P2
in−Pout2
, (1)
where ˙Q is the outlet volumetric flow rate of the fluid from the material,
µ is the fluid viscosity, L is the length of the sample in the flow direction,
A is the cross-sectional area (ignoring the voids introduced by porosity),
Pin is the inlet pressure, and Pout is the outlet pressure. Equation (1) is
only valid for one dimensional cartesian flow, with every parameter held
constant. The permeability of a medium to gases becomes progressively
greater than that of its liquid permeability as the gas density decreases, a
phenomenon that is know as the Klinkenberg effect [5], and is attributed
to non-equilibrium gas effects that are well known in the rarefied gas field.
As the mean free path λ (the average distance a gas atom/molecule travels
before undergoing a collision) of the gas approaches the mean pore diameter
the gas ‘slipping’ across the surface [6], which results in enhanced transport
of mass compared to a liquid. The Knudsen number,
Kn=λ/D, (2)
is used as a measure of gas rarefaction. Figure 1 illustrates the different
Knudsen number regimes.
Kn = 0.0001 0.001 0.01 0.1 1 10 100
Continuum flow
Slip flow regime
Transition regime
Free molecule flow
(normal density levels)
(slightly rarefied)
(moderately rarefied)
[image:6.612.121.487.281.363.2](highly rarefied)
Figure 1: Knudsen number regimes, adapted from Reference [7].
As has previously been discussed by Lachaudet al.[8], if the pore sizes in
the internal structure of a heat shield are on the order of micrometres, the gas
flow can fall within the transition Knudsen number regime due to the small
length scale and the relatively small magnitude of the stagnation pressures
encountered during the peak heat flux phase of re-entry. Therefore, the
familiar Navier-Stokes-Fourier (NSF) equations are no longer valid because
the gas is rarefied and the assumptions of the linear form of the constitutive
relations for shear stress and heat flux no longer hold; transport of the fluid
must be described by the Boltzmann equation, which for a single species,
monatomic gas, has the form:
∂(nf)
∂t +c ∂(nf)
∂r +F ∂(nf)
∂c =J(f, f
∗
where nf is the product of the number density and the normalised
veloc-ity distribution function, r and c are the position and velocity vectors of
a molecule, respectively, F is an external force, J(f, f∗
) is a non-linear
in-tegral that describes the binary collisions, and the superscript ∗ represents
post-collision properties. The collision integral takes the form:
J(f, f∗
) =
Z ∞
−∞
Z 4π
0
n2(f∗
f∗
1 −f f1)crξdΩdc1, (4)
wheref andf1 are the velocity distribution function atcandc1 respectively,
cr is the relative speed of two colliding molecules, ξ is the molecular
cross-section, and Ω is the solid angle.
One of the dominant methods for finding a solution to the Boltzmann
equation in the transition regime is the direct simulation Monte Carlo (DSMC)
method [9]. DSMC is a particle based method, where the aim is to track a
statistically representative number of particles in time and space,
emulat-ing the physics of the real gas. The first key assumption of the method is
that a single DSMC simulator particle can represent any number of real gas
atoms/molecules, which drastically reduces the computational expense of a
simulation; for accuracy reasons, it is important to ensure that there are at
least around 20 DSMC particles in a single computational cell [9]. Secondly,
it is assumed that particle movements and collisions can be decoupled -
colli-sions can be handled in a stochastic manner only after all particle movements
have been dealt with deterministically. The method has now been used for
50 years [10] and has become the dominant numerical technique for solving
gas flows that fall within the transition Knudsen number regime. It has been
shown that the method provides an exact solution to the Boltzmann
and time step [11].
The DSMC algorithm is unconditionally stable, but there are two key
numerical considerations that must be met in order to ensure that the results
are reliable. Inter-particle collisions are restricted to a single computational
cell: the local cell size must be smaller than the local mean free path to
promote nearest-neighbour collisions and therefore a realistic transport of
mass, momentum, and energy. Virtual sub-cells are often used to further
promote nearest-neighbour collisions. A version of the dsmcFoam code [12],
which has been modified by researchers at the University of Strathclyde, is
used to perform all the numerical simulations in this paper.
In this paper, we investigate pressure-driven gas flow through two
differ-ent ablative materials in both their virgin and pyrolised states; a
commer-cially available cork-phenolic ablative material, hereafter called CPA-1, and
a carbon fibre-phenolic ablative material, hereafter named CPA-2. The aim
of the current work is develop a numerical framework that can be used to
promote a better understanding of how the permeability of these materials
changes from the virgin to the pyrolised states when gas flow through the
materials is rarefied, which is possible both at the start and at the end of the
high heat flux phase of an atmospheric entry, as shown in Reference [8]. The
improved knowledge of the permeability will allow it to be employed with
greater confidence in lower-order ablation models.
Work on rarefied gas flow through porous media using DSMC has
re-ceived limited attention in recent years. de Socio and Marino [13] created
an experimental set up consisting of glass spheres arranged randomly in a
experimen-tal sample was then subjected to a pressure differential with a nitrogen-fed
flow-meter upstream and a vacuum pump downstream; the flow rate could be
controlled manually. The pressure profile was measured at 7 static pressure
holes along the length of the cylinder and compared to that from a modified
direct simulation Monte Carlo method. The significant result from this work
was showing that a Knudsen minimum [14] type phenomenon was found for
the permeability of their experimental sample, i.e. there is a distinct
mini-mum in permeability against gas rarefaction, with it being greater both below
and above this critical Knudsen number. The DSMC method presented in
the paper of de Socio and Marino [13] features a modified collision routine
to emulate particles striking the surface of the packed spheres (the actual
porosity is not physically modelled) and is only valid for a tortuosity that is
characteristic of their experiment.
Oshima et al. [15] investigated the transport of gases through nano-scale
channels that were filled with randomly generated spheres to a user-defined
porosity. A pressure gradient was applied across the channel, with the length
scales involved meaning that the Knudsen number is high. They measured
the mass flux across the channels at different values of porosity, pressure
gradient, and spherical particle diameters. Their results are qualitatively in
agreement with Darcy’s law [16] and it is demonstrated that the diameter
of the particles has a significant impact on the permeability, even when the
final porosity is the same, i.e. tortuosity is important.
Kalarakis et al. [17] created a physical representation of a porous
mi-crochannel geometry, where the blockage was created using a stochastic
pressure ratio of 2 were performed at different Knudsen numbers and the
Klinkenberg effect is clearly found as the permeability increases as the
Knud-sen number is increased. It is found that the permeability can increase by 2
orders of magnitude in the range of the transition Knudsen number regime,
showing how much the non-equilibrium effects can influence the fluid
trans-port properties.
Firouzi and Wilcox [18] carried out molecular dynamics simulations of
various gases through a porous carbon-based material. They found that
permeability increases with porosity and that there is a critical porosity for
their materials below which the permeability is zero due to poorly connected
pores.
2. Porosities, Numerical Meshing & Simulation Parameters
Micro-computed tomography (µCT) scans of the CPA-1 and CPA-2
ma-terials have been performed at the Austrian Foundry Research Institute
( ¨OGI) 1
, and the details of each scan are displayed in Table 1. The scans
have been performed on both materials in their virgin state, and after each
has been pyrolised at conditions corresponding to their intended operating
environments, i.e. the CPA-2 material has been pyrolised at 2000◦
C and the
CPA-1 at 1300◦
C.
1
Material nVoxels Resolution (µm)
Virgin CPA-1 1573 × 1554 × 996 3.411
Virgin CPA-2 1500 × 1500 ×1000 5.21
Pyrolised CPA-1 1000 × 1000 ×1000 6.111
[image:11.612.154.462.127.234.2]Pyrolised CPA-2 1000 × 1000 ×1000 6.111
Table 1: Details of the CT scans used in the current work.
In order to build numerical meshes that are a realistic representation of
the materials, it is first important to determine the porosities of the samples.
The CT scans give density values on a per voxel (where a voxel is a small
volume, analogous to a pixel in 2D) basis, but the scale does not represent
the physical density of the material at that point; it can only inform a user
of the relative densities of each voxel region. A trial and error procedure
was used to remove voxels with the density of air, which left voxels that
represent the ablative material and the drinking straw it was contained in
during the scanning process. This procedure involved finding a threshold
value of voxel density which removed the region of air outside of the drinking
straw material, but did not remove any of the straw or ablative material.
This threshold value was different for each µCT scan because the scale does
not represent real densities and is unique to each scan. A typical example of
this is shown in Figure 2. The CPA-2 material is displayed in red, with the
Ø 4.7 mm
Figure 2: µCT scan of the pyrolised CPA-2 material with the voxels representing air
removed. The CPA-2 material is shown in red, with the drinking straw container in blue.
The porosity of each material was then determined by extracting regions
of increasing size from the geometrical centre of the samples. From Figure2
it is clear that there are void regions between the straw and material. These
are not porosity and were introduced because the material could not be
machined to the exact shape of the straw, so care was taken to ensure the
extracted volume contained only the ablative material, not regions of the
straw or the empty volume between the straw and material. The final value
for each material was considered to be that at which the porosity becomes
roughly constant as the sample size increases, as shown in Figure 3. Each
material was scanned at three different resolutions; low, standard, and high.
The high resolution scans are used when possible in this work; a µCT scan
Figure 3(b) to ensure that a reliable value of porosity was derived for that
specific material. It has not been possible, due to the nature that particular
high resolution scan, to derive a settled value of porosity, so the porosity
from the standard resolution scan has been assumed to be the same as that
which would be achieved from the high resolution scan. Table2contains the
final values of porosity that have been used in the remainder of this work.
0.65 0.7 0.75 0.8 0.85
0 100 200 300 400 500 600 700 800 900 1000
Porosity
Size of sample volume (voxels3)
(a) 0.7 0.72 0.74 0.76 0.78 0.8 0.82
0 100 200 300 400 500 600
Porosity
Size of sample volume (voxels3) High resolution Standard resolution (b) 0.86 0.88 0.9 0.92
0 50 100 150 200 250 300 350 400
Porosity
Size of sample volume (voxels3)
(c)
0.88 0.9 0.92
0 50 100 150 200 250 300 350 400
Porosity
Size of sample volume (voxels3)
[image:13.612.124.481.271.579.2](d)
Figure 3: Porosities of the materials: (a)virgin CPA-1 material,(b)virgin CPA-2 material,
Material Porosity
Virgin CPA-1 0.714
Virgin CPA-2 0.742
Pyrolised CPA-1 0.909
[image:14.612.228.381.125.235.2]Pyrolised CPA-2 0.927
Table 2: Details of the CT scans used in the current work.
The results show that the carbon-phenolic material is more porous than
the cork-phenolic and as expected, both materials become significantly more
porous after the resin has been burned off.
With the porosity of each material known, regions of size 50 × 50 ×
50 voxels with a porosity equal to that displayed in Table 2 were identified
and exported. To ensure that the permeability returned from such a small
sample was reliable, regions of 100 × 100 × 100 voxels with have also been
extracted with the same porosity, in order to compare the results. Larger
sample sizes were not considered in the current work due to restrictions with
the computational expense of DSMC.
Once the 503 and 1003 voxel regions were extracted, they were used to
create numerical meshes within the OpenFOAM 2 software. OpenFOAM is
a C++, open-source fluid dynamics toolbox and one of its key features is
snappyHexMesh, an automatic meshing algorithm for use with complex 3D
structures. A background mesh of cubic cells with the dimensions of the
voxels described in Table 1 was created. Using the exported 3D geometry,
2
snappyHexMesh then automatically removed cells that corresponded to solid
material, leaving behind a mesh that includes all of the internal paths that
the gas could flow through within the sample. An example of the mesh for
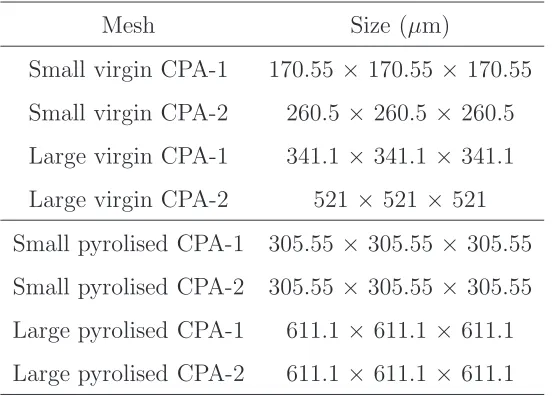
the pyrolised CPA-2 material is shown in Figure4. The physical sizes of each
305.55 μ m
solid material
[image:15.612.192.421.221.472.2]air
Figure 4: Screenshot of the numerical mesh created for the 1003
voxels pyrolised CPA-2.
The opaque areas are regions of air and the solid surfaces are the charred carbon material.
mesh are listed in Table 3 and are the number of voxels multiplied by the
Mesh Size (µm)
Small virgin CPA-1 170.55 ×170.55 × 170.55
Small virgin CPA-2 260.5 × 260.5 ×260.5
Large virgin CPA-1 341.1 × 341.1 ×341.1
Large virgin CPA-2 521 × 521 × 521
Small pyrolised CPA-1 305.55 ×305.55 × 305.55
Small pyrolised CPA-2 305.55 ×305.55 × 305.55
Large pyrolised CPA-1 611.1 × 611.1 ×611.1
[image:16.612.169.445.125.323.2]Large pyrolised CPA-2 611.1 × 611.1 ×611.1
Table 3: Physical size of each mesh for the DSMC simulations.
For each material, the inlets were considered, in separate simulations, to
be in thex−,y−, andz−directions to help define the degree of anisotropy in
the results. The remaining 4 outer boundaries were all set to be symmetry
planes, so in effect an infinitely large block of the material was simulated,
and the results were not influenced by the presence of the outer boundaries,
other than the inlets and outlets. The solid material inside the mesh, as
shown in Figure4, were modelled as fully diffuse walls held at a temperature
of 1500 K.
The pyrolysis gas composition was chosen from Table 1 in Reference [19]
at a temperature of 1500 K; this temperature was chosen both because there
is data available of pyrolysis gas composition for similar (carbon-phenolic)
materials [19], and to be representative of the operating conditions of both
In reality, both materials would have different pyrolysis gas compositions and
operate at different temperatures, but the aim of the current work is to show
that this numerical procedure can be used to help better understand the
material beaviour, so the choices of temperatures and gases are not considered
critical here. The stagnation pressure and gas composition is detailed in
Table 4. The gas may be chemically active, and so the influence of gas-gas
chemical reactions was included, with all of the reactions detailed in Table5
and Table 6. For the exchange reactions, the default activation energy Ea
for the forward reactions is the heat of reaction, and zero for the reverse
reactions. Each reaction has been compared to an Arrhenius rate from the
NIST database and Reference [20], and the dimensionless aandbparameters
(which adjust the default activation energies) chosen both to match these
rates and ensure that the ratio of the forward-to-reverse reactions remains
consistent with statistical theory.
The reaction set is by no means complete; for example, we are restricting
the current work to diatomic molecules and atoms. To the best of our
knowl-edge, this is the first time that reactions involving carbon species have been
considered using the quantum-kinetic (QK) chemical reaction model [21].
In order to calculate the permeability, information on the gas viscosity
is also required. For argon, the VHS viscosity index was used to calculate a
viscosity of 8.42 ×10⁻⁵
Nsm−2
. The pyrolysis gas is multi-species and
com-posed of gases with widely different masses; the viscosity was estimated using
the efficiency of momentum transfer in a gas: 1 µ = s X i=1 " s X j=1
yiyj
õ
iõj
E 1 3 i,j # , (5) where
Ei,j =
2√mi√mj
mi+mj
, (6)
and
yi =
Xi
√
Mi
Ps
m=1 Xm
√
Mm
. (7)
In the above relations, Miis the molecular weight of species i,mi is the mass,
and Xi the mole fraction. Using equation (5), the viscosity of the pyrolysis
gas mixture outlined in Table 4 was taken as 5.276 × 10⁻⁵
Nsm−2
in the
present work.
T (K) Pout (Pa)
Mole Fraction
H2 CO N2 NO C2H2
[image:18.612.200.500.152.296.2]1500 331.33 0.485 0.276 0.157 0.0522 0.0293
Reaction Heat of Reaction (K)
N2 + M →N + N + M -112,994
N2 +A →N + N + A -112,994
O2 + M → O + O + M -59,400
O2 +A → O + O + A -59,400
NO + M → N + O + M -75,544
NO + A→ N + O + A -75,544
H2 + M →H + H + M -52,440
H2 +A →H + H + A -52,440
CO + M → C + O + M -128,929
CO + A→ C + O + A -128,929
CN + M → C + N + M -107,199
[image:19.612.175.439.125.409.2]CN + A→ C + N + A -107,199
Table 5: Dissociation reactions considered in the current work.
Reaction Activation Energy (K) Forward Coeffs. Reverse Coeffs.
Forward Reverse a b a b
NO + O ↔ O2 + N 19,700 0 0.085 0.65 0.1 0.1
N2 + O ↔ NO + N 37,500 0 0.15 0.15 0.033 0.8
N2 + C ↔ CN + N 23,200 0 0.08 0.25 0.05 0.8
CO + O ↔ O2 + C 69,200 0 0.09 0.4 0.025 0.8
[image:19.612.113.540.466.620.2]CN + O ↔ NO + C 14,600 0 0.12 0.4 0.1 0.45
Species m (×10−27
kg) ω d (×10−10
m) Tref (K) Θv (K)
N2 46.5 0.74 4.17 273 3371
O2 53.12 0.77 4.07 273 2256
NO 49.88 0.79 4.20 273 2719
H2 3.34 0.67 4.17 273 6159
CO 46.5 0.73 4.19 273 3122
CN 43.19 0.8 4.00 273 2981
N 23.25 0.8 3.00 273
-O 26.56 0.8 3.00 273
-H 1.67 0.8 2.50 273
-C 19.94 0.8 3.00 273
-Ar 66.3 0.81 4.17 273
-Table 7: VHS parameters for the individual gas species [9].
Since the acetylene (C2H2) is polyatomic and only 2.93% of the total gas
composition, it was excluded from the DSMC simulations. The parameters
used in the simulations for each species are detailed in Table 7, where m is
the molecular mass, ω is the viscosity exponent, d is the molecular
diame-ter, Tref is the reference temperature for the viscosity model, and Θv is the
characteristic vibrational temperature.
The outlet boundary conditions are fixed pressure outlets held at the
chosen pressure of 331.33 Pa. This is a very low pressure, but it designed to
simulate the very early stages of re-entry, where the external flow is rarefied,
[image:20.612.129.480.127.388.2]a further point in the re-entry where the vehicle has decelerated significantly
and the stagnation pressure has reduced again, as shown in Reference [8].
These represent points in the re-entry trajectory well before and after the
peak heating point.
The outlet boundary condition used is described in Reference [23] and its
dsmcFoam implementation has previously been validated in Reference [24]
-this boundary condition calculates the gas composition at the outlet from the
number fractions in the cells attached to the outlet boundary, so can account
for new species that are introduced by chemical reactions as the simulation
proceeds. At the inlet, a defined inlet pressure boundary condition was used,
as described in Reference [25]. As the simulation proceeds, this boundary
condition works in a manner described in References [23,24] to find velocities,
temperatures, and densities at the boundaries that return the user defined
pressure. The inlet temperature was set the same as for the solid material,
1500 K.
Before performing simulations with the gas mixture outlined in Table4,
the simulations were first run with argon gas to have a benchmark to
com-pare further results against. All of the simulations used the variable hard
sphere (VHS) collision model [26] and the Larsen-Borgnakke
phenomeno-logical model [27] to redistribute energy between the rotational and
transla-tional modes. IndsmcFoam, a pair-wise implementation of this redistribution
model is used, with a constant relaxation probability of 1/Zrot, where Zrot
was set constant at 5 for all gas species in the current work. Vibrational
energy is handled with a harmonic oscillator model and redistribution
argon gas all used a constant timestep of 1 × 10⁻⁹
s, and to account for the
smaller molecular mass of hydrogen, a timestep of 1 ×10⁻¹⁰
s is used for all
simulations with the pyrolysis gas.
An inlet-to-outlet pressure ratio (Pin/Pout) of 2 was used for each case,
with Pin = 331.33 Pa. Using the same pressures for all cases ensures that
the permeabilities are being measured at the same Knudsen numbers; this is
required for a fair comparison as, unlike permeability to a liquid, it has been
shown [13, 15] that the permeability to a gas is a function of rarefaction.
The inlet Knudsen numbers for the cases with argon are 40.3 and 23.4 for
the virgin CPA-1 and CPA-2, respectively. The mean free pathλ is taken as
the VHS value, and the characteristic length D as the size of a voxel in the
CT scan (i.e. the scan resolution). Despite the large Knudsen numbers, these
are not free-molecular flows: the average pore diameter is likely to be much
larger than the scan resolution, but the scan resolution gives the smallest
possible pore diameter. For both pyrolised materials, the Knudsen number
is 22.5.
The mass flow rate was monitored at multiple cross-sections and the
sim-ulation was considered converged once all of the measured mass flow rates
were within ±1% of each another. In addition, the number of particles in the
system and the average linear kinetic energy is monitored to ensure a steady
state solution has been reached before statistical sampling takes place.
Sam-pling is performed in bins along the streamwise flow direction, with each bin
covering up to 50 × 50 (for the small samples) and 100× 100 (for the large
The simulations were run on the ARCHIE-WeSt supercomputer facility3
at the University of Strathclyde. The small sample sizes had around 2.5
mil-lion DSMC simulator particles at steady state and typically required around
250 CPU hours to get the final results for both gases, while the larger
sim-ulations used 25 million particles and around 1700 CPU hours for the argon
gas and 3360 CPU hours (i.e. 70 hours on 48 cores) for the pyrolysis gas.
3. Validation
In order to validate this method for measuring the permeability of porous
materials, a simulation was performed on a CT scan of Berea sandstone
mate-rial [29]. Previous experimental studies of this material found its permeability
to be between 0.48 Darcys [30] (using distilled water as the permeant) and
0.65 Darcys [31] (1 Darcy = 9.869233×10⁻¹³m2). Complementary methods
from the same authors, to determine the permeability of the same material
found it analytically, based on caclulations of transport properties applied to
scanning electron microscope scans, to be 0.56 Darcys [30], and 1.111–2.668
Darcys [31] using a numerical method to extract pore and throat networks
and using these as an input in a pore-scale model.
The DSMC simulation here considers a 100× 100 × 100 voxel
represen-tation of the Berea sandstone, with a resolution of 5.345µm. The porosity of
the sample volume after removing voxels that represent air is 0.199. Argon
gas was used as the permeant and, in order to minimise the Klinkenberg
effects on the permeability, the pressures used are as high as possible
with-3
out making the simulation prohibitively computationally expensive. An inlet
pressure and temperature of 2026.5 Pa and 300 K were used, respectively.
The pressure gradient was applied in thex-direction, with an outlet pressure
of 1013.25 Pa, and the four remaining faces were symmetry planes. All solid
surfaces were considered to reflect particles diffusely at 300 K. The Knudsen
number, based on the inlet pressure and the average pore radius previously
calculated for this µCT scan [31], is 0.17. The simulation was performed
in parallel on 60 CPUs and required a run time of 3.5 days to reach steady
state and a further 2.5 days of sampling to reduce the statistical scatter in
the measured mass flow rate. There were around 14 million DSMC particles
at steady state and a timestep of 2 × 10⁻⁹
s was used. Figure 5 shows the
[image:24.612.154.462.412.621.2]contours of pressure measured inside the pores of the Berea material.
The defined inlet and outlet pressures, Pin and Pout, and the measured
mass flow rate, were used with Equation (1) to define the permeability of the
sample. The outlet volume flow rate ˙Qis given from:
˙
Q= m˙
ρout
, (8)
where ˙m is the mass flow rate in the system and ρout is the mass density of
the gas at the outlet.
From the exit volumetric flow rate, the DSMC simulation gives a
perme-ability of 0.54 Darcys. It is important to note that this value of permeperme-ability
is only valid for these specific conditions and that no attempt to calculate
the rarefied permeability function has been made here. The calculated
per-meability compares well with the two experimental values stated above, even
accounting for the fact that any Klinkenberg effects present may have
in-creased the permeability from the DSMC simulation, particularly compared
to the experimental value of 0.48 Darcys obtained using water. This result
confirms that the current method for determining permeability from DSMC
simulations can return realistic values, but also that the computational effort
required to obtain them can be high.
4. Results
No chemical reactions occurred in any of the simulations at 1500 K with
the pyrolysis gas mixture. Since nitrogen, in particular, has a relatively large
characteristic dissociation temperature, this is not a surprising result and
shows that gas phase chemical reactions are not likely to be an important
The normalised average cross-sectional pressure profiles in the stream
direction for four of the simulations are shown in Figure6. It is clear that all
simulations have the same inlet and outlet pressures. The pressure profiles
deviate from the simple straight line that would be expected for a continuum
gas flow, but they are also significantly different from the well known
0.8 1 1.2 1.4 1.6 1.8 2 2.2
0 0.2 0.4 0.6 0.8 1
P/P out x/L (a) 0.8 1 1.2 1.4 1.6 1.8 2 2.2
0 0.2 0.4 0.6 0.8 1
P/P out y/L (b) 0.8 1 1.2 1.4 1.6 1.8 2 2.2
0 0.2 0.4 0.6 0.8 1
P/P out z/L (c) 0.8 1 1.2 1.4 1.6 1.8 2 2.2
0 0.2 0.4 0.6 0.8 1
P/P
out
x/L
[image:27.612.114.489.136.454.2](d)
Figure 6: Average cross-sectional normalised pressure profiles for(a)argon gasx-direction
flow through the small pyrolised CPA-2 material sample,(b)pyrolysis gasy-direction flow
through the small virgin CPA-1 material, (c) pyrolysis gas z-direction flow through the
large virgin CPA-1 material, and(d)argon gasx-direction flow through the large pyrolised
CPA-2 material.
Figure7shows the average cross-sectional streamwise Mach number
pro-files through four of the samples. The Mach number magnitude increases
from inlet to outlet for all cases as expected, with greater Mach numbers
being reached in the flow through the pyrolised materials. This is expected
addition, the Mach number reached in the small pyrolised sample in
Fig-ure 7 (a)is greater than that of the large sample in Figure7 (d)because the
pressure gradient is greater in the small samples, leading to a larger
driv-ing force. The scattered nature of the profiles is not noise; the statistical
uncertainties have been calculated [35] as fractions of a percent. Taking the
cross-sectional average of the profile reduces the scatter to an acceptable level
by including a large number of cells (typically around 8,000 for the large
sam-ples depending on the local porosity) in the measurement volume for each
bin, giving a minimum of 32000 particles in a single bin. Rather, the scatter
0.06 0.07 0.08 0.09 0.1 0.11 0.12 0.13 0.14 0.15
0 0.2 0.4 0.6 0.8 1
Ma z/L (a) 0.02 0.03 0.04 0.05 0.06 0.07
0 0.2 0.4 0.6 0.8 1
Ma y/L (b) 0.005 0.01 0.015 0.02 0.025
0 0.2 0.4 0.6 0.8 1
Ma y/L (c) 0.05 0.06 0.07 0.08 0.09 0.1
0 0.2 0.4 0.6 0.8 1
Ma
z/L
[image:29.612.116.489.140.452.2](d)
Figure 7: Average cross-sectional streamwise Mach number profiles for (a)pyrolysis gas
z-direction flow through the small pyrolised CPA-1 material, (b) argon gas x-direction
flow through the small virgin CPA-2 sample, and (c) argon gasy-direction flow through
the large virgin CPA-2 material sample, and(d)pyrolysis gasz-direction flow through the
Sample Permeability (m
2
)
Argon Pyrolysis Gas
Small virgin CPA-2
x 1.34 ×10−9
1.43 × 10⁻⁹
y 9.38 × 10⁻¹⁰
9.94 × 10⁻¹⁰
z 1.12 ×10⁻⁹
1.18 × 10⁻⁹
Large virgin CPA-2
x 8.91 × 10−10
8.89 × 10⁻¹⁰
y 5.14 × 10⁻¹⁰ 5.32
× 10−10 z 1.20 ×10⁻⁹
1.32 × 10⁻⁹
Small pyrolised CPA-2
x 9.89 ×10−9
1.14 × 10⁻⁸
y 5.36 ×10⁻⁹ 6.23
× 10−9 z 6.43 ×10⁻⁹
7.20 × 10⁻⁹
Large pyrolised CPA-2
x 5.48 ×10−9
6.10 × 10⁻⁹
y 4.62 ×10⁻⁹ 5.04
× 10−9 z 4.06 ×10⁻⁹
[image:30.612.152.462.132.432.2]4.41 × 10⁻⁹
Table 8: Calculated permeability values for the CPA-2 samples.
The permeabilities of each material to both argon and the gas mixture
were calculated using Equation (1). Table 8 contains the results of
perme-ability for the CPA-2 material samples. Firstly, considering only the argon
gas results, the permeability of the pyrolised material is significantly larger
than that of the virgin material, because its porosity is greater, and so
trans-port of a gas through the material is easier than in the corresponding virgin
material. The permeability in they-direction of the large virgin CPA-2
regular pattern during manufacture, or perhaps preferential alignment of the
fibres at the micro and nano scale. This was not found in the smaller sample
size, although the larger sample sizes likely give a more accurate value of the
permeability as they can capture a geometry that is more representative of
the µCT scan. Ideally, simulations on even larger sample sizes would be
per-formed, but the relatively expensive numerical nature of the DSMC method
has prevented this in the current work.
It is found that the permeability of the samples to argon is smaller
com-pared to that with pyrolysis gas, despite using the same inlet pressure and
pressure gradient. Although the current work does not investigate the
pres-ence of the Klinkenberg effect in these materials, this result is consistent with
the Klinkenberg effect, where the permeability is given from Equation (9),
k =k0
1 + b
P
, (9)
wherek0is the permeability of the material to a liquid,P is the pore pressure,
and b is a slip correction factor that is a function of gas rarefaction. The
value of b will vary between argon and the gas mixture; there is a significant
molar fraction of hydrogen in the pyrolysis gas, which gives it a larger mean
free path than the argon and could account for the increased permeability.
However, it is important to note that these values of permeability (and those
in Table9) are only valid for these specific conditions and that no attempt to
calculate the rarefied permeability function of Equation (9) has been made
Sample Permeability (m
2
)
Argon Pyrolysis Gas
Small virgin CPA-1
x 4.10 × 10−10
4.49 × 10⁻¹⁰
y 3.93 × 10⁻¹⁰
4.32 × 10⁻¹⁰
z 3.73 × 10⁻¹⁰
4.07 × 10⁻¹⁰
Large virgin CPA-1
x 2.49 × 10−10
2.35 × 10⁻¹⁰
y 2.83 × 10⁻¹⁰ 2.68
× 10−10 z 2.29 × 10⁻¹⁰
2.16 × 10⁻¹⁰
Small pyrolised CPA-1
x 5.41 ×10−9
6.02 × 10⁻⁹
y 2.76 ×10⁻⁹ 3.08
× 10−9 z 2.35 ×10⁻⁹
2.62 × 10⁻⁹
Large pyrolised CPA-1
x 3.68 ×10−9
3.93 × 10⁻⁹
y 3.21 ×10⁻⁹ 3.40
× 10−9 z 2.73 ×10⁻⁹
[image:32.612.152.462.132.432.2]2.86 × 10⁻⁹
Table 9: Calculated permeability values for the CPA-1 samples.
The results for the CPA-1 material follow a similar trend to the CPA-2
results, with the pyrolised material having a much greater permeability than
the virgin material. However, the large virgin CPA-1 results show a slightly
lower permeability for pyrolysis gas compared to argon, which is in contrast
the rest of the results in the current work.
5. Conclusions
simulations was established. This allows for the flow of rarefied gases through
a porous heat shield material to be investigated using a physically realistic
geometry. The problems with the size limits imposed by the computational
expense of the numerical method were discussed, and a reasonable attempt
to overcome them and obtain meaningful results from smaller geometries was
described. The porosities of both CPA-2 and CPA-1 were then calculated
in their virgin and pyrolised forms, with the porosity significantly increasing
once the material has been pyrolised.
The permeability of a Berea sandstone sample was calculated, in order
to validate the permeabilities of the ablative materials. The value of 0.54
Darcys is in good agreement with published experimental data and is in fact
more reliable than some previous attempts to numerically determine the
per-meability of Berea sandstone. The results for the perper-meability of the ablative
materials show some expected behaviour; the pyrolised material samples are
more permeable because their porosities are greater, and so transport of a
gas through the material is easier than in the corresponding virgin material.
The CPA-1 becomes around ten times more permeable in its pyrolised form
compared to its virgin form. The CPA-2 also becomes significantly more
permeable, but not to the same extent: it becomes around five times more
permeable according to the current results.
It is found that the permeability of the samples to argon is smaller
com-pared to that with pyrolysis gas, despite using the same inlet pressure and
pressure gradient. Although the current work does not investigate the
pres-ence of the Klinkenberg effect in these materials, this does show the
that include rarefied gases.
The current analysis is restricted only to gas-phase chemical reactions
and those employed in this work have not had an affect on the permeability
values, but for other gas combinations there may be reactions with lower
activation energies, so gas-phase chemical reactions should not be neglected.
The presence of gas-surface chemical reactions has not been investigated here
and may be an important factor.
6. Acknowledgements
This work was supported by the EU/FP7 ABLAMOD program, grant no.
FP7-SPACE-2012-312987. Results were obtained using the EPSRC funded
ARCHIE-WeSt High Performance Computer (www.archie-west.ac.uk).
EP-SRC grant no. EP/K000586/1. The authors wish to thank Erhard Kaschnitz
of the Austrian Foundry Research Institute ( ¨OGI) who performed the CT
scans of the materials as part of the ABLAMOD program.
7. References
[1] D. E. Brownlee, P. Tsou, J. D. Anderson, M. S. Hanner, R. L. Newburn,
Z. Sekanina, B. C. Clark, F. Hrz, M. E. Zolensky, J. Kissel, J. A. M.
McDonnell, S. A. Sandford, and A. J. Tuzzolino. Stardust: Comet and
interstellar dust sample return mission.Journal of Geophysical Research:
Planets, 108(E10):1–15, 2003.
[2] H. K. Tran, C. E. Johnson, D. J. Rasky, F. C. L. Hui, M.-T. Hsu,
im-pregnated carbon ablators (PICA) as thermal protection systems for
discovery missions. Technical Report TM 110440, NASA, 1997.
[3] H. Weng and A. Martin. Multidimensional modeling of pyrolysis gas
transport inside charring ablative materials. Journal of Thermophysics
and Heat Transfer, 28(4):583–597., 2014.
[4] W. Tanikawa and T. Shimamoto. Klinkenberg effect for gas
permeabil-ity and its comparison to water permeabilpermeabil-ity for porous sedimentary
rocks. Hydrology and Earth System Sciences Discussions, 3(4):1315–
1338, 2006.
[5] L. J. Klinkenberg. The permeability of porous media to liquid and gases.
Drilling and Production Practice, American Petroleum Inst., pages 200–
213, 1941.
[6] J.C. Maxwell. On stresses in rarefied gases arising from the inequalities
of temperature. Phil. Trans. R. Soc. A, 170:231–256, 1879.
[7] M. Gad-el-Hak. The fluid mechanics of microdevices—the Freeman
Scholar lecture. J. Fluids Eng., 121(1):5–33, 1999.
[8] J. Lachaud, I. Cozmuta, and N. N. Mansour. Multiscale approach to
ablation modeling of phenolic impregnated carbon ablators. Journal of
Spacecraft and Rockets, 47(6):910–921, 2010.
[9] G.A. Bird. Molecular Gas Dynamics and the Direct Simulation of Gas
Flows. Oxford Science Publications, Oxford University Press Inc, New
[10] G.A. Bird. Approach to translational equilibrium in a rigid sphere gas.
Physics of Fluids, 6(10):1518–1519, 1963.
[11] W. Wagner. A convergence proof for Bird’s direct simulation Monte
Carlo method for the Boltzmann equation. Journal of Statistical
Physics, 66:1011–1044, 1992.
[12] T. J. Scanlon, E. Roohi, C. White, M. Darbandi, and J.M. Reese. An
open source, parallel DSMC code for rarefied gas flows in arbitrary
ge-ometries. Computers & Fluids, 39(10):2078–2089, 2010.
[13] L. M. de Socio and L. Marino. Gas flow in a permeable medium. Journal
of Fluid Mechanics, 557:119–133, 2006.
[14] W. Steckelmacher. Knudsen flow 75 years on: the current state of the
art for flow of rarefied gases in tubes and systems. Reports on Progress
in Physics, 49(10):1083–1107, 1986.
[15] T. Oshima, S. Yonemura, and T. Tokumasu. A numerical study for
transport phenomena of nanoscale gas flow in porous media. AIP
Con-ference Proceedings, 1501(1):809–815, 2012.
[16] S. Whitaker. Flow in porous media I: A theoretical derivation of Darcy’s
law. Transport in Porous Media, 1(1):3–25, 1986.
[17] A.N. Kalarakis, V.K. Michalis, E.D. Skouras, and V.N. Burganos.
Meso-scopic simulation of rarefied flow in narrow channels and porous media.
[18] M. Firouzi and J. Wilcox. Molecular modeling of carbon dioxide
trans-port and storage in porous carbon-based materials. Microporous and
Mesoporous Materials, 158:195–203, 2012.
[19] A. Martin and I.D. Boyd. Chemistry model for ablating carbon-phenolic
material during atmospheric re-entry. In48th AIAA Aerospace Sciences
Meeting Including the New Horizons Forum and Aerospace Exposition,
2010.
[20] E. Farbar, I.D. Boyd, and A. Martin. Modeling ablation of charring
heat shield materials for non-continuum hypersonic flow. In 50th AIAA
Aerospace Sciences Meeting including the New Horizons Forum and
Aerospace Exposition, 2012.
[21] G.A. Bird. Chemical reactions in DSMC. In Rarefied Gas Dynamics
2010, 2010.
[22] T.A. Davidson. A simple and accurate method for calculating viscosity
of gaseous mixtures. U.S. Department of the Interior, Bureau of Mines,
1993.
[23] W.W. Liou and Y. Fang. Implicit boundary conditions for direct
simula-tion Monte Carlo method in MEMS flow predicsimula-tions. CMES: Computer
Modeling in Engineering & Sciences, 1(4):119–128, 2000.
[24] C. White, M.K. Borg, T.J. Scanlon, and J.M. Reese. A DSMC
investi-gation of gas flows in micro-channels with bends. Computers & Fluids,
[25] M. Wang and Z. Li. Simulations for gas flows in microgeometries using
the direct simulation Monte Carlo method. International Journal of
Heat and Fluid Flow, 25(6):975–985, 2004.
[26] G.A. Bird. Definition of mean free path for real gases. Physics of Fluids,
26(11):3222–3223, 1983.
[27] C. Borgnakke and P.S. Larsen. Statistical collision model for Monte
Carlo simulation of polyatomic gas mixture. Journal of Computational
Physics, 18(4):405–420, 1975.
[28] G.A. Bird. A comparison of collision energy-based and
temperature-based procedures in DSMC. In Rarefied Gas Dynamics 2008, 2008.
[29] H. Dong and M. Blunt. Pore-network extraction from
micro-computerized-tomography images. Physical Review E, 80:036307, 2009.
[30] E. M. Schlueter. Predicting the Transport Properties of Sedimentary
Rocks From Microstructure. PhD thesis, Lawrence Berekely Laboratory:
University of California, 1995.
[31] H. Dong. Micro-CT Imaging and Pore Network Extraction. PhD thesis,
Imperial College London, 2007.
[32] W.W. Liou and Y. Fang. Microfluid Mechanics. McGraw-Hill, Two
Penn Plaza, New York, 2006.
[33] Ehsan Roohi, Masoud Darbandi, and Vahid Mirjalili. Direct simulation
chan-[34] C. Cai, Q. Sun, and I.D. Boyd. Gas flows in microchannels and
micro-tubes. Journal of Fluid Mechanics, 589(-1):305–314, 2007.
[35] N G Hadjiconstantinou, A L Garcia, M Z Bazant, and G He. Statistical
error in particle simulations of hydrodynamic phenomena. J. Comput.
![Figure 1: Knudsen number regimes, adapted from Reference [7].](https://thumb-us.123doks.com/thumbv2/123dok_us/1618053.114847/6.612.121.487.281.363/figure-knudsen-number-regimes-adapted-reference.webp)


![Table 7: VHS parameters for the individual gas species [9].](https://thumb-us.123doks.com/thumbv2/123dok_us/1618053.114847/20.612.129.480.127.388/table-vhs-parameters-individual-gas-species.webp)
