1
High-Temperature Rapid Devolatilization of Biomasses with
Varying Degrees of Torrefaction
Jun Li1*, Giorgio Bonvicini2, Leonardo Tognotti2, 3, Weihong Yang1, Wlodzimierz Blasiak1
Division of Energy and Furnace Technology, KTH-Royal Institute of Technology, Brinellvägen 23, 10044 Stockholm, Sweden
Tel: +46 8 7908458; Fax: +46 8 20 76 81; Email: jun2@kth.se
2 International Flame Research Foundation, Via Salvatore Orlando 5, 57123 Livorno, Italy
3 Dipartimento di Ingegneria Chimica, Universitá di Pisa, Via Diotisalvi 2, 56100 Pisa, Italy
Abstract
Torrefied biomass is a coal-like fuel that can be burned in biomass boilers or co-fired with coal in co-firing furnaces. To make quantitative predictions regarding combustion behaviour, devolatilization should be accurately described. In this work, the devolatilization of three torrefied biomasses and their parent material were tested in an Isothermal Plug Flow Reactor, which is able to rapidly heat the biomass particles to a maximum temperature of 1400 °C at a rate of 104 °C/s, similar to the conditions in actual power plant furnaces. During every devolatilization test, the devolatilized biomass particles were collected and analyzed to determine the weight loss based on the ash tracer method. According to the experimental results, it can be concluded that biomass decreases its reactivity after torrefaction, and the greater of torrefaction conducted, the lower the biomass reactivity. Furthermore, based on a two-competing-step model, the kinetic parameters were determined by minimizing the difference between the modeled and experimental results based on the least-squares objective function, and the predicted weight losses exhibited a good agreement with experimental data from biomass devolatilization, especially at high temperatures. It was also detected that CO and H2 are the primary components of the released volatile matters from the devolatilization of the three torrefied biomasses, in which CO accounts for approximately 45 to 60%, and H2 accounts for 20 to 30% of the total volatile species.
2
1 Introduction
Biomass has a large potential to act as major substitution of fossil fuels in the future
because of its renewability and carbon-neutrality [1, 2]. Unlike coal, the physical and chemical
properties of biomass, such as a high moisture content, high volatile content, and low bulk
density, complicate its transportation and processing. As a result, the large-scale application of
biomass is limited [3].
To expand the thermal applications of biomass, a key challenge is to develop a
conversion technology that allows biomass to compete with fossil fuels. Currently, pre-treatment
process of torrefaction has shown its potential for upgrading biomass properties and therefore
offers a possible solution [4]. Compared to raw biomass, torrefied biomass exhibits higher energy
density, good grindability, higher flowability and uniformity [5-9]. Accordingly, many studies on
biomass torrefaction have been reported. For example, the weight loss kinetics of biomass during
torrefaction have been investigated [9], as well as the effects of the torrefaction conditions on the
products and their chemical properties [8, 10]. The grindability, reactivity and grinding energy
consumption of torrefied biomass have also been investigated [6, 11].
Conventionally, fuel analyses are performed at relatively low temperatures (<1000°C) and
low heating rates (<1°C/s). However, when the biomass particles enter a pulverized-fuel flame,
they are rapidly heated to a final temperature in the range of 1400 to 1600°C at a rate of
approximately 104 °C /s. Early in 1977, the high-temperature devolatilization of coals has been
studied under rapid heating conditions was studied by Kobayashi et al., who found that the
volatile yields increased significantly with high temperatures, and the high temperature volatile
matters (HTVM) yields noticeably exceeded the standard volatile content that is given by
standard proximate analysis, and thus, an empirical model of two-competing overall reactions was
3
studies on high temperature-rapid coal devolatilization were performed focusing on the yields of
gaseous products and tar; the effects of particle size, oxygen coefficient and pressures; and model
development [14-19].
Recently, studies of biomass devolatilization at high temperatures and high heating rates
have also begun. Biagini et al. developed a satisfying method to study the size and morphology of
biomass fuels and their chars after rapid devolatilization, with which the structural variations
caused by the fast release of a high amount of volatile products can be evaluated [20]. Biagini et al.
also characterized residues of biomass fuels after the initial devolatilization for their reactivity;
and concluded that chars produced during the rapid pyrolysis were more reactive to oxidation
than chars produced in medium conditions done by thermogravimetric balance [21]. Nora et al.
investigated the influence of peak temperature (500-1300 °C), heating rate (600-1000 °C/s) and
hold time at peak temperature on devolatilization focusing on the fate of the main gaseous and
nitrogen species [22]. Xiu et al. studied the devolatilization characteristics of biomasses during
flash pyrolysis on a plasma-heated laminar entrained flow reactor with average heating rates of
104 °C/s; the corresponding kinetic parameters of the studied biomasses were determined and
analyzed[23]. Jiménez et al. performed a complete set of devolatilization and combustion
experiments with pulverized biomass in an entrained flow reactor under realistic combustion
conditions, and the obtained experimental data were used to derive the kinetic parameters for
best-fitting observed behaviors[24]. However, there is a general lack of quantitative information
collected in reactors, which operate in conditions sufficiently close to the actual environments
encountered in pulverized biomass combustion.
In large-scale applications, torrefied biomass is supposed to be a coal-like fuel that is
eventually burned in biomass boilers or co-fired with coal in co-firing furnaces. Specifically,
finding a suitable torrefaction degree of raw biomass for stable high-temperature devolatilization
and combustion is critical because light torrefaction is always preferable for saving energy and
4
behavior, such as biomass thermal conversion, heat transfer, and pollutant formation, the
high-temperature devolatilization should be accurately described because applying the kinetics
obtained from low-heating-rate tests are not sufficiently reliable to make a precise prediction of
volatile matter yields, gaseous products, and their releasing rates. In this work, the devolatilization
of three torrefied biomasses and their parent fuel were studied experimentally in an isothermal
plug flow reactor (IPFR), which is able to simulate conditions similar to those found in actual
power plant furnaces. The effects of the degree of torrefaction on the devolatilization behaviors,
apparent kinetics, and gaseous products of the studied biomasses were discussed.
2 Experiments
2.1 Torrefaction facility
In this study, a horizontal rotary furnace was used for biomass torrefaction. The rotating
furnace is equipped with an electrical heating unit. To assure perfect thermal insulation, refractory
fibers are used in the form of a ceramic blanket surrounding the inner tube. The rotational speed
is changeable within the range of 2-12 rpm, and the tilt angle can be adjusted from horizontal up
to 20º, which allows the selection of optimum conditions for process efficiency and residence
time, as well as the elimination of material accumulation risk.
The studied biomass material is palm kernel shell (PKS). The original moisture content of
PKS is in the range of 11-13%, which is low compared to other biomass residues. PKS has a
slightly higher heating value than average lignocelluloses biomass because it contains palm oil
residue. In this study, the raw PKS was torrefied at temperatures of 200°C, 250°C, and 300°C in
the torrefaction furnace with the same residence time of 30 minutes, to produce solid products,
three torrefied PKS materials with different degrees of torrefaction. To simplify, these three
torrefied PKS materials are abbreviated as torrefied biomass #1, #2, and #3, respectively. The
5 <Table 1>
2.2 IPFR reactor
All devolatilization tests of biomasses were carried out in an IPFR reactor. The IPFR
reactor is a 4 m long drop-tube reactor used to characterize solid fuels under conditions similar to
those of real combustion applications with heating rates on 104-105 °C/s and a maximum
temperature of 1400°C. The scheme of the IPFR reactor is shown in Figure 1: eight electrically
heated modules are installed for furnace temperature adjustment, and each of them can be
controlled independently. A K-tron solid fuel feeder is used to provide a continuous mass flow of
approximately 100 g/h of pulverized fuel, which is fed to the reactor through one of the 19 ports
at different heights. The same ports can also be used to measure the flue gas temperature and
chemical composition by using a suction pyrometer and gas-sampling probe. The chemical
composition of the atmosphere entering the IPFR (mainly the oxygen concentration) can be
changed by varying the different mass flows fed to the natural gas-fired pre-combustor located
on the top of the IPFR. Once the velocity of the flue gases is fixed, the desired residence time of
particles inside of the IPFR is achieved by changing the feeding port and the position of the
sampling probe at the bottom of the reactor. The solid sampling probe consists of a water-cooled
jacket where the collected particles are quenched with nitrogen in few milliseconds at a
temperature below 300°C to stop all the reactions.
<Figure 1>
During each devolatilization test, the devolatilized biomass particles were collected and
then analyzed to determine the mass conversion according to the ash tracer method, which
assumes ashes to be inert and thermally stable. Eq. (1) was used to determine the weight loss on a
dry-ash-free basis.
6
In the IPFR, devolatilization tests were carried out under an almost oxygen-free
atmosphere (with oxygen below 0.5%), with a residence time between 30 and 1000 ms. In this
work, to fully understand the effects of torrefaction degree on biomass devolatilization behaviors,
a total of 47 tests were carried out with varying devolatilization temperatures, residence times and
biomass materials, as presented in Table 2.
<Table 2>
3 Results
3.1 Torrefaction products
Prior to devolatilization studies, the three torrefied PKS materials (#1, #2, and #3) together
with their parent material, raw PKS, were ground in a cutting mill and then sieved to select
particles in a size range of 62 to 105 m. The proximate and ultimate analyses of four biomass
samples were then performed using a standard programmed procedure, as shown in Table 3.
<Table 3>
The torrefaction process can be evaluated by the degree of torrefaction, which is defined as
the released volatiles divided by the initial volatile content of the raw material on dry-ash-free
basis. Table 3 shows that a greater torrefaction caused a clear increase in torrefaction degree:
when the raw PKS was torrefied at 300 °C, the torrefaction degree increased to 28.21%, meaning
that 28.21% of volatile components were released during the torrefaction process. Simultaneously,
the O/C ratio decreased when increasing the torrefaction degree, meaning that the releasing rate
of oxygen was faster than that of carbon during the torrefaction process. According to Tumuluru
et al., the decarboxylation reactions of the acid groups in biomass dominated in lower
7
3.2 Devolatilization
The investigation of high heating rates and high-temperature devolatilization requires
advanced facilities like the IPFR, which is able to give parameters that can be more suitable for
practical applications than those obtained in traditional characterization. For example, the HTVM
is higher than the volatile matter measured in proximate analysis. This is important especially for
biofuel with a higher volatile matter content. IPFR tests are also useful to evaluate
devolatilization kinetics at a high heating rate that can be significantly different from the kinetics
obtained in a TG balance. Furthermore, the produced char particles can be reasonably more
similar to those encountered in full-scale plants.
Prior to studying the devolatilization of torrefied biomasses, their parent material was
investigated in the IPFR reactor, and the resulting weight loss trends are presented in Figure 2. In
a short residence time, it can be clearly noticed that the temperature plays an important role in
the devolatilization process. After 300 ms devolatilization tests at 900°C and 1200°C, weight
losses of 78.96% and 87.80% were respectively measured, this indicates a difference of
approximately 10% attributable to the effect of temperature. In the early stage, the conversion at
900°C was higher than that at 1200 °C, which was most likely caused by the coalescence of pores
and thermal annealing, resulting in the area and reaction rates decreases at the high temperature
up to 1200°C. This may also due to the experimental uncertainties associated with mass loss
calculations based on the ash tracer method and the residence time; a more detailed discussion
will be given in a later section of this paper.
<Figure 2>
To make a clear comparison, the torrefied biomass #3, with greatest torrefaction degree,
8
shows the mass conversion of the selected torrefied biomass during the high-temperature and
high-heating-rate devolatilization processes. Figure 3 also shows that the increased temperature
significantly promotes weight loss in torrefied biomass. Furthermore, the devolatilization
temperature also plays an important role in the final weight loss of torrefied biomass at the
studied maximum residence time (1000 ms). Respectively, 12.2%, 37.0%, and 47.4% of the
original mass was released after 1 s high-heating-rate devolatilization at 500°C, 700°C, and 900°C.
The final released volatiles at 900°C case was slightly lower than the standard volatile content
based on the proximate analysis, while the final released volatiles at 500°C case was
approximately 1/4 of the standard volatile content.
Compared to raw PKS, the torrefied PKS material does not show any overlap of weight
loss curves in the early devolatilization stage. This might be attributed to the release of
hemicellulose during the torrefaction process, or to the fact that the particles are relatively clean
compared to the raw biomass and can therefore avoid the coalescence of pores and thermal
annealing in the subsequent devolatilization process. This could be a merit of torrefied biomass
in further combustion. Furthermore, according to Figure 3, the temperature did not influence the
high-temperature volatile matter (HTVM) in the rapid devolatilization of torrefied biomass #3.
The volatile yields were much higher than that the standard volatile content during raw material
devolatilization; it may therefore be concluded that part some carbon was also released due to the
high temperature condition.
<Figure 3>
3.3 Devolatilization kinetics
As mentioned above, the HTVM yield was higher than the standard volatile matter
revealed by proximate analysis. The accurate prediction of the volatile matter yield as function of
the temperature is thus important for combustion models. Two-competing-step model was
9
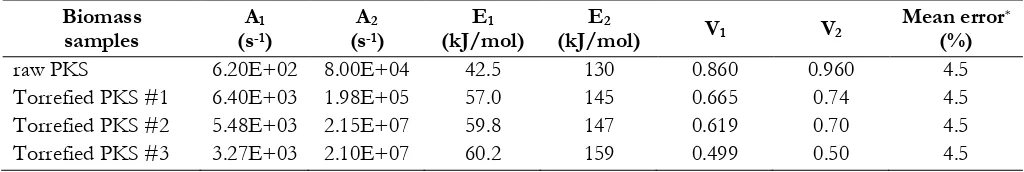
In the two-competing-step model, the first reaction (A1, E1, and V1) is used to calculate
the devolatilization rate at low temperature, whereas the second reaction (A2, E2, and V2) plays a
dominant role at higher temperatures. The aim of the IPFR devolatilization tests is to evaluate
the HTVM yield in an oxygen free atmosphere and to elaborate global kinetics for torrefied
biomasses. To determine these kinetic parameters, tests must be carried out at least at two
different temperatures. The values of V1 and V2 are equal to the fraction of volatiles released
during the proximate analysis and the highest temperature IPFR test, respectively. Finally, a
fitting model and a target function must be fixed. In this study, the apparent kinetic parameters
were determined by minimizing the residuals between the modeled and the experimental results
according to a least-squares method.
Once the pre-exponential factors and activation energies are known, the model provides
the rate of volatile evolution and volatile yields. The two kinetic rates are weighted to yield an
expression for the devolatilization according to the following equation:
(Eq.2)
where mv(t) is the volatile yield over time (kg); mp,0 is the initial particle mass at injection on dry-ash-free basis (kg); and the reaction rates (k1 and k2) are expressed in Arrhenius form:
(Eq.3)
In this work, the detailed devolatilization kinetics for the studied torrefied biomasses are
given in Table 4. As described by Kobayashi [12], an important feature of the model is that
E1<E2. The activation energy can be roughly used for estimating the reactivity of fuel: a fuel with
lower activation energy normally shows a higher reactivity [26, 27]. According to Table 4, the
activation energy E1 increased when increasing the degree of torrefaction, meaning that the
10
process. This is mainly caused by the rearrangement of biomass structures, due to the release of
hemicellulose and the changing of cellulose structure during the torrefaction process. Compared
to raw biomass, torrefaction biomass is characterised by anhydrous weight loss, a higher energy
content and a lower reactivity [11], which are desired to form a stable flame during
pulverized-fuel combustion.
<Table 4>
4 Discussions
4.1Quantification of experimental uncertainties
4.1.1 Uncertainties of mass loss
In this work, to determine the weight loss of biomass during high-temperature rapid
devolatilization, the ash tracer method was used with the assumption that the ash of biofuel is
inert and thermally stable during the tests. Thus, physical and chemical phenomena such as ash
volatilization were not taken into account. This is a crucial issue when characterizing biomass
devolatilization because of its low ash content. Therefore, it is crucial to evaluate the error
affecting the experimental results in this work.
Two main sources of error can be identified: the uncertainty of the determination of the
ash content (of both the parent biofuel and the collected samples), and the possible loss of ashes
during the test. Eq. (4), Eq. (5), and Eq. (6) express the uncertainty of the calculated conversion
as a function of the uncertainties on the two ash contents.
Eq. (4)
Eq. (5)
11
The uncertainty of the initial ash content of the parent fuel and of the samples is
determined by repeating at least five proximate analyses in a macro-TGA of both the parent fuel
and the produced residuals.
Concerning another source of error, the conversion calculated with Eq. (1) can be
correlated to the real one, expressed by Eq. (7), by introducing a coefficient α, whose value is
below unity because it corresponds to the ratio between the ashes remaining after the loss and
the real ones, as expressed in Eq. (8).
Eq. (7)
Eq. (8)
It is worth noting that the latter source of error affects the experimental results only as a
positive error bar because the measured conversion can only be higher than the real value. On
the other hand, the uncertainty of the ash content leads to an error that can be either positive or
negative. The uncertainty of the ash content can be reduced by sieving the pulverized fuel into a
narrow granulometry fraction and by increasing the number of proximate analysis repetitions.
4.1.2 Uncertainties of residence time
Concerning the high-temperature rapid devolatilization tests in the IPFR, two main
sources of error may cause the uncertainties in the residence time. First, the sampling probe
positioning accuracy has to be identified, which, during the experimental campaigns, was
approximately 3-4 mm. This positioning error can lead to an error of 1-2 ms on the residence
time, depending on the flue gas velocity inside the reactor. A higher error occurs in an
experimental test at a low flue gas velocity, whereas normally, a lower error might be expected
12
Moreover, all the calculations used to determine the particles residence time are based on
the measured mass flows. Normally, the main flow entering the IPFR has an accuracy of 2% for
the air mass flow measurements; as a result, an average error of approximately 2% should also be
considered for the residence time of particles.
4.2 Comparison of mass losses of three torrefied biomasses
Figures 4 shows the predicted mass loss trends for the three torrefied biomasses (#1, #2,
and #3) and their parent material by using the kinetics parameters of the two-competing-step
model presented in Table 4, and compares these predictions with their corresponding
experimental results. Here, it must be noted that the devolatilization tests of the three torrefied
biomasses were performed at the temperatures of 500, 700, and 900 °C, while the devolatilization tests of the parent biomass were carried out at the relatively elevated temperatures of 900 and
1200 °C. To determine the kinetic parameters according to Kobayashi's model for the raw PKS, the first two points of the conversion measured at 900°C were excluded as shown in Figure 2
because the model is not able to predict the experimental overlap of the curves.
The modeled results showed a good agreement with the experimental results at relatively
high temperatures, but the model underestimated the mass conversions at relatively low
temperatures for the three torrefied materials. This may be because in low-temperature
devolatilization, the first reaction occurs fast while the second reaction is negligibly slow.
Furthermore, in rapid devolatilization at 900°C, the weight loss of the parent material is much
faster when compared to the torrefied biomasses. At a very short residence time of 30 ms,
64.88% mass of the raw PKS was released, while the mass release for the torrefied materials was
less than 30% of their original weight. The order for the devolatilization rates of the four studied
biomass materials was rPKS>rTPKS #1>rTPKS #2>rTPKS #3; that is, the higher the volatile matter content
of the biomass, the faster the complete volatile release in high temperature devolatilization
13
temperature of 700 °C. Furthermore, high temperature enhances the volatile release rate; for
example, the weight loss curves become constant after 300 ms devolatilization at 900 °C for all
cases, while weight loss ended after approximately 1 s when the devolatilization temperature was
700 °C.
<Figure 4>
4.3 High temperature volatile matter (HTVM)
4.3.1 Effects of heating rate on the release of volatiles
Figure 5 plots the comparison of the amounts of volatiles released in rapid and slow
devolatilization processes with the same final temperature, to understand the effects of heating
rate on the yields of volatiles. Tests in the IPFR reactor were performed at a heating rate of
104 °C/s to a nominal reactor temperature of 900 °C, and the heating rate in the TG balance was
kept slow at 0.3 °C/s with a final temperature of 900 °C for comparison. It is widely accepted
that hemicellulose is released in the biomass torrefaction at 200°C, while the release of cellulose is
highly dependent on the torrefaction temperature. Thus, the highly torrefied biomass (torrefied
PKS #3) contained less cellulose than the biomass exposed to light torrefaction (torrefied PKS
#1), and torrefied PKS #2 had an intermediate cellulose content. As a consequence, the degree
of torrefaction has a significant effect on the total volatile yields, which is independent of heating
rate, as shown in Figure 5. Furthermore, the higher the heating rate is, the more volatile matters
could be released. The amount of volatile matter released at a high heating rate is obviously
greater than the standard volatile content obtained from proximate analysis, while the volatile
matters released at a low heating rate approaches the standard volatile content. The residence
time at the final temperature for all three torrefied biomasses was 1000 ms, while only the HTVM
data was available for raw biomass at a residence time of 500 ms. However, it is still obviously
14
which is much higher than that for the three studied torrefied materials: +6% for torrefied PKS
#1, +12% for torrefied PKS #2, and +2% for torrefied PKS #3.
<Figure 5>
4.3.2 Effect of torrefaction degree on HTVM
If the residence time is long enough, the volatile matter released at low-temperature
devolatilization should approach the standard volatile content, as indicated by the dotted line in
Figure 6. It is challenging to obtain the HTVM yield of biomass at high temperature, even when
applying the ash tracer method. Because the ash content is very low for biomass, residuals
collection after devolatilization is too sensitive to be controlled, and a very small uncertainty in
the measured ash content could cause a large error in calculated HTVM yields. Thus, the
calculated kinetic parameters of the two-competing-step model based on the experimental results
either underestimate or overestimate the predicted yield of HTVM during devolatilization, as
discussed in Section 4.1. Finally, the HTVM yields are summarized in Figure 6, to clarify the
trend of HTVM yields during high temperature devolatilization.
Figure 6 clearly shows that when the volatile content of the studied biomass is higher
than 50% on dry basis, the amount of volatile matters released during the high-temperature
devolatilization process is greater than the standard volatile content of the biomass sample.
Among the four studied biomass materials, the HTVM yield of torrefied PKS #3 is almost equal
to its standard volatile content. It is possible to extrapolate to the other end of the HTVM yield
curve, at which the biomass is composed of 100% volatiles and the HTVM yields is therefore
equal to the standard volatile content. Therefore, it is reasonable to identify a maximum
difference between HTVM yield and standard volatile content for biomass materials with similar
natures. The other extreme case supposes a biomass volatile content close to zero, in which the
15
previously removed during the pre-treatment processes. An extreme example of this situation is
the biomass material that contains fully fixed carbon; little to no volatile matters could be released,
even at high temperatures.
<Figure 6>
4.3.3 Gaseous species in volatiles
Given that the HTVM yield is higher than the standard volatile content for most
biomasses, it is relevant to analyze the released volatile components of torrefied biomasses during
high-temperature devolatilization. In this work, gas speciation was determined during
devolatilization tests in the IPFR reactor by means of on-line measurements with a micro-GC gas
analyzer, which is able to detect H2, CO, CO2, CH4, C2(C2H2, C2H4, and C2H6), and the measured
results are presented in Table 5. Obviously, CO and H2 are the main components of released
volatile matters in the devolatilization of the three torrefied biomasses studied; in particular, CO
accounts for approximately 45-60 % and H2 for 20-30% of the total volatile species. Less relevant,
CH4 and CO2 are in the ranges of 8-14% and 6-8%, respectively. According to Neves et al., the
heating rate has little effect on determining the composition of the pyrolysis gas[28], therefore,
the results might also be useful for cases at low heating rates.
Within the lower temperature range of biomass pyrolysis (normally below 550°C), CO2
and CO are major released gas species, followed by a small quantity of CH4 [28]. Compared to
low temperature devolatilization, as temperature increases above 550°C, the yields of combustible
species (CO, H2, and CH4) become a strong function of temperature. In this study, when the
devolatilization temperature reached 900°C, the volume fractions of CO, H2, and CH4 account
for approximately 90% of the total released volatiles, while the CO2 yield becomes less than 8%
because most CO2 was released during the torrefaction; the CO2 lost during torrefaction is
16
could be related to the secondary decomposition of preliminary tar formed at lower temperature.
When the biomass devolatilized at temperatures above 900 °C, the secondary reactions of the
volatiles become important.
<Table 5>
4.4 Effects of torrefaction degree on biomass devolatilization
To understand the devolatilization properties of different biomasses, the
high-temperature rapid devolatilization of torrefied biomasses with different torrefaction degrees was
studied at 900°C in an IPFR reactor and compared to the behaviors of their parent material. The
effect of torrefaction degree on weight loss at different residence times is shown in Figure 7. As
expected, the amount of released volatiles drops linearly with increasing degree of torrefaction at
a given residence time; results were calculated accurately at residence times of 300, 500, and 1000
ms, while relatively large error was evident at the residence time of 30 ms. This might be because
as the measurement uncertainty at a short residence time is more sensitive than that at relatively
long residence time; as a result, the mass loss of the biomass with a torrefaction degree of 6.31%
was less than that of biomasses with higher degrees of torrefaction. According to the discussions
of residence time uncertainties in section 4.1.2, positioning error can lead to an error of 1-2 ms of
the residence time, and thus the uncertainties of residence time can vary significantly from 0.1%
in 1000 ms tests to 8% in 30 ms tests.
Furthermore, according to the Figure 7, it could be concluded that the linear relation
between the weight loss properties of studied biomasses during high temperature-rapid
devolatilization and their torrefaction degree is highly influenced by residence time. The
differences in linear slope with varying residence time might correspond to the heating history
and structural changes during high-temperature devolatilization, such as swelling, thermal
17
the weight loss of biomass is independent of its initial torrefaction degree, because the volatile
matters would be completely released after a long period of devolatilization.
5 Conclusions
Torrefaction, a typical pre-treatment technology, has demonstrated its potential for
upgrading biomass properties. Torrefied biomass is a coal-like fuel that can be burned in biomass
boilers or co-fired with coal in co-firing furnaces. To make quantitative predictions of biomass
combustion behaviors, devolatilization should be accurately described. In this work,
devolatilization tests were conducted on three prepared torrefied biomasses and their parent
material in an isothermal plug flow reactor, which can be rapidly heated to a uniform temperature
in the range of 900 to 1400°C at a heating rate of 104 °C/s, similar to the conditions in actual
power plant furnaces. During every devolatilization test, the devolatilized biomass particles were
collected and analyzed to determine the weight loss based on the ash tracer method. According
to the experimental results, it can be concluded that biomass reactivity is reduced after
torrefaction, and the greater the torrefaction, the lower the reactivity. Furthermore, based on a
two-competing-step model, the kinetic parameters were determined by minimizing the residuals
between the modeled and experimental results based on a least-squares objective function, and
the predicted weight losses showed a good agreement with the experimental data from the
biomass devolatilization tests, especially at high temperatures. It was also detected that CO and
H2 were the major components of released volatiles in the studied devolatilization of the three
torrefied biomasses; in particular, CO accounted for approximately 45 to 60 % and H2 accounted
for 20 to 30% of the total volatile species.
6 Acknowledgments
The authors would like to thank the EU-Biofuels Research Infrastructure for Sharing
18
Author Jun Li also acknowledges the financial support from the China Scholarship Council
(CSC).
7 Symbol lists
Nomenclature
Ai Pre-exponential factor in Arrhenius expression, (1/s)
dp Particle diameter, (m)
D0 Diffusion rate coefficient, (m2/s)
Ei Activation energy, (J/kmol)
mv(t) Volatile yield up to time, (kg)
mp,0 Initial mass of biomass, (kg)
k1 Devolatilization rate at low temperature range, (kg/m2-Pa-s)
k2 Devolatilization rate at high temperature range, (kg/m2-Pa-s)
R gas universal constant, 8.3143 J/(mol-K);
Tm mean particle and gas temperature (K)
V1 Devolatilization stoichiometric coefficient for step 1 in Kobayashi Model, (-)
V2 Devolatilization stoichiometric coefficient for step 2 in Kobayashi Model, (-) Abbreviations
ash0 Initial ash content of biomass, (wt.%)
ash Ash content of residue, (wt.%)
daf Dry ash free basis
dry Dry basis
IPFR Isothermal Plug Flow Reactor
FC Fixed carbon
VM Volatile matter
HTVM High temperature volatile matter
Torrefied PKS #1 Torrefied biomass ( PKS after 30 min torrefaction at 200 °C) Torrefied PKS #2 Torrefied biomass ( PKS after 30 min torrefaction at 250 °C)
Torrefied PKS #3 Torrefied biomass ( PKS after 30 min torrefaction at 300 °C)
PSD Particle size distribution
RB Raw biomass
19 8 References
1. Werther, J., et al., Combustion of agricultural residues. Progress in Energy and Combustion Science, 2000. 26(1): p. 1-27.
2. Zhang, L., C. Xu, and P. Champagne, Overview of recent advances in thermo-chemical conversion of biomass. Energy Conversion and Management, 2010. 51(5): p. 969-982.
3. Biagini, E., F. Barontini, and L. Tognotti, Devolatilization of Biomass Fuels and Biomass Components Studied by TG/FTIR Technique. Industrial & Engineering Chemistry Research, 2006. 45(13): p. 4486-4493.
4. van der Stelt, M.J.C., et al., Biomass upgrading by torrefaction for the production of biofuels: A review. Biomass and Bioenergy, 2011. 35(9): p. 3748-3762.
5. Hakkou, M., et al., Investigations of the reasons for fungal durability of heat-treated beech wood. Polymer Degradation and Stability, 2006. 91(2): p. 393-397.
6. Arias, B., et al., Influence of torrefaction on the grindability and reactivity of woody biomass.
Fuel Processing Technology, 2008. 89(2): p. 169-175.
7. P. Bergman, A.B., R. Zwart and J. Kiel, Torrefaction for biomass co-firing in existing coal-fired power stations. ENC-C-05-013, 2005.
8. Prins, M.J., K.J. Ptasinski, and F.J.J.G. Janssen, Torrefaction of wood: Part 2. Analysis of products. Journal of Analytical and Applied Pyrolysis, 2006. 77(1): p. 35-40.
9. Prins, M.J., K.J. Ptasinski, and F.J.J.G. Janssen, Torrefaction of wood: Part 1. Weight loss kinetics. Journal of Analytical and Applied Pyrolysis, 2006. 77(1): p. 28-34.
10. Couhert, C., S. Salvador, and J.M. Commandré, Impact of torrefaction on syngas production from wood. Fuel, 2009. 88(11): p. 2286-2290.
11. Repellin, V., et al., Energy requirement for fine grinding of torrefied wood. Biomass and Bioenergy, 2010. 34(7): p. 923-930.
12. Kobayashi, H., J.B. Howard, and A.F. Sarofim, Coal devolatilization at high temperatures.
Symposium (International) on Combustion, 1977. 16(1): p. 411-425.
13. Anthony, D.B., et al., Rapid devolatilization of pulverized coal. Symposium (International) on Combustion, 1975. 15(1): p. 1303-1317.
14. Sørensen, L.H., O. Biede, and R.E. Peck, An experimental study of high-temperature, oxidative pulverized coal devolatilization. Symposium (International) on Combustion, 1994. 25(1): p. 475-483.
15. Tyler, R.J., Flash pyrolysis of coals. 1. Devolatilization of a Victorian brown coal in a small fluidized-bed reactor. Fuel, 1979. 58(9): p. 680-686.
16. Cliff, D.I., et al., Products from rapid heating of a brown coal in the temperature range 400– 2300 °C. Fuel, 1984. 63(3): p. 394-400.
17. Jess, A., Mechanisms and kinetics of thermal reactions of aromatic hydrocarbons from pyrolysis of solid fuels. Fuel, 1996. 75(12): p. 1441-1448.
18. Niksa, S., et al., On the role of heating rate in rapid coal devolatilization. Symposium (International) on Combustion, 1985. 20(1): p. 1445-1453.
19. Yan, B.-H., et al., Experimental investigation on coal devolatilization at high temperatures with different heating rates. Fuel, (0).
20. Biagini, E., P. Narducci, and L. Tognotti, Size and structural characterization of lignin-cellulosic fuels after the rapid devolatilization. Fuel, 2008. 87(2): p. 177-186.
21. Biagini, E., M. Simone, and L. Tognotti, Characterization of high heating rate chars of biomass fuels. Proceedings of the Combustion Institute, 2009. 32(2): p. 2043-2050.
22. Di Nola, G., W. de Jong, and H. Spliethoff, The fate of main gaseous and nitrogen species during fast heating rate devolatilization of coal and secondary fuels using a heated wire mesh reactor. Fuel Processing Technology, 2009. 90(3): p. 388-395.
20
24. Jiménez, S., et al., Kinetics of devolatilization and oxidation of a pulverized biomass in an entrained flow reactor under realistic combustion conditions. Combustion and Flame, 2008.
152(4): p. 588-603.
25. Shankar TumuluruJaya, S., HessJ. Richard, WrightChristopher T., and BoardmanRichard D.. , A review on biomass torrefaction process and product properties for energy applications.
Industrial Biotechnology, 2011. 7(5): p. 384-401.
26. Cumming, J.W., Reactivity assessment of coals via a weighted mean activation energy. Fuel, 1984. 63(10): p. 1436-1440.
27. El-Samed, A.K.A., et al., Variation of char reactivity during simultaneous devolatilization and combustion of coals in a drop-tube reactor. Fuel, 1990. 69(8): p. 1029-1036.
21
Tables
Table 1. Conditions applied for biomass torrefaction
Parent material Temperature (°C) Residence time (min)
Torrefied PKS #1 raw PKS 200 30
Torrefied PKS #2 raw PKS 250 30
[image:21.595.89.507.257.446.2]Torrefied PKS #3 raw PKS 300 30
Table 2. Devolatilization tests
Temperature (°C) Residence time (ms)
30 50 100 150 300 500 1000
500 -
TPKS #2 TPKS #3
- TPKS #1
TPKS #2 TPKS #3
- TPKS #1
TPKS #2 TPKS #3
- TPKS #1
TPKS #2 TPKS #3
700 TPKS #1
TPKS #2 TPKS #3
- TPKS #1
TPKS #2 TPKS #3
- TPKS #1
TPKS #2 TPKS #3
- TPKS #1
TPKS #2 TPKS #3
900 raw PKS
TPKS #1 TPKS #2 TPKS #3
raw PKS Raw PKS TPKS #1 TPKS #2 TPKS #3
raw PKS Raw PKS TPKS #1 TPKS #2 TPKS #3
raw PKS -
TPKS #1 TPKS #2 TPKS #3
1200 raw PKS raw PKS Raw PKS raw PKS Raw PKS raw PKS -
[image:21.595.47.550.500.616.2]Note: “TPKS” is the abbreviation of torrefied PKS.
Table 3. Analysis of pulverized biomass powder
Proximate analysis, wt% Ultimate analysis, wt% Torrefaction degree (%, daf)
O/C
(dry) LHV db MJ/kg MCar VMdb FCdb Ashdb Cdb Hdb Odb Ndb
raw PKS 7.20 72.78 22.99 4.23 51.83 6.28 37.03 0.44 0 0.54 17.28
Torrefied PKS #1 5.80 66.53 26.91 6.56 54.30 5.07 33.52 0.50 6.31 0.46 20.90
Torrefied PKS #2 5.60 61.87 30.82 7.31 55.43 4.90 31.83 0.50 12.17 0.43 20.50
22
Table 4. Devolatilization kinetics of the biomasses with different degrees of torrefaction
Biomass
samples (sA-11)
A2
(s-1)
E1
(kJ/mol) (kJ/mol) E2 V1 V2 Mean error
*
(%)
raw PKS 6.20E+02 8.00E+04 42.5 130 0.860 0.960 4.5
Torrefied PKS #1 6.40E+03 1.98E+05 57.0 145 0.665 0.74 4.5
Torrefied PKS #2 5.48E+03 2.15E+07 59.8 147 0.619 0.70 4.5
Torrefied PKS #3 3.27E+03 2.10E+07 60.2 159 0.499 0.50 4.5
* calculated as the mean of the absolute differences between the modeled and experimental results of the studied biomasses from
the high-temperature rapid devolatilization tests in the IPFR: mod exp 100%
n n
[image:22.595.111.485.321.421.2]X X error
Table 5. Detected gas species (vol. %) during 900°C devolatilization
Detected gases species (vol. %)
CO H2 CH4 CO2 C2H4 C2H2
Torrefied PKS #1 47.79 25.44 13.52 6.45 4.32 2.46
Torrefied PKS #2 45.50 27.99 13.58 6.14 4.44 2.41
Torrefied PKS #3 58.19 21.60 8.38 7.86 2.84 1.15
Figure captions
Figure 1. Scheme of the IPFR reactorFigure 2. Comparison of weight losses of raw PKS at two different devolatilization temperatures
Figure 3. Comparison of weight losses of torrefied PKS #3 at three different devolatilization temperatures
Figure 4. Devolatilization properties of biomasses with varying degrees of torrefaction
Figure 5. Comparison of the volatile matter released in rapid and slow devolatilization processes
Figure 6. HTVM yields of different fuels with varying volatile contents