City, University of London Institutional Repository
Citation
:
Kulesza, T., Stumpf, S., Wong, W-K., Burnett, M., Perona, S., Ko, A. & Oberst, I. (2011). Why-Oriented End-User Debugging of Naïve Bayes Text Classification. Transactions on Interactive Intelligent Systems, 1(1), .2. doi: 10.1145/2030365.2030367This is the accepted version of the paper.
This version of the publication may differ from the final published
version.
Permanent repository link:
http://openaccess.city.ac.uk/12414/Link to published version
:
http://dx.doi.org/10.1145/2030365.2030367Copyright and reuse:
City Research Online aims to make research
outputs of City, University of London available to a wider audience.
Copyright and Moral Rights remain with the author(s) and/or copyright
holders. URLs from City Research Online may be freely distributed and
linked to.
City Research Online: http://openaccess.city.ac.uk/ [email protected]
**ref chk, fig chk, table chk, section # chk, spell chk, smart quotes layout chk, ** chk **Vocab: No more learned programs, we’re dealing with intelligent assistants. In some cases, “adaptive software” seems appropriate as well.
**Vocab: “data” is plural. So, need “data are” instead of “data is”. **Vocab: It’s a Why-oriented approach (capitalized)
**Vocab: It’s naïve Bayes (lower-case ‘n’)
**Vocab/numbering: change the following globally: Principle (i) -> Principle Representation-1 Principle (ii) -> Principle Representation-2 Principle (iii) -> Principle ML-1
Principle (iv) -> Principle ML-2
**Length: TiiS suggests manuscripts be between 10,000 and 15,000 words.
Why-Oriented End-User Debugging of
Naïve Bayes Text Classification
*
Todd Kulesza1, Simone Stumpf2, Weng-Keen Wong1,
Margaret M. Burnett1, Stephen Perona1, Andrew Ko3, Ian Oberst1
1Oregon State University
School of Electrical Engineering and Computer Science Corvallis, OR 97331 USA
1-541-737-3617
{kuleszto,wong,burnett,peronas,obersti}@eecs.oregonstate.edu
2City University London
Centre for Human-Computer Interaction Design London, UK EC1V 0HB
++44-20-7040 8168 [email protected]
*
3The Information School
DUB group
University of Washington Seattle, WA 98195 USA
Abstract **D2.5
Machine learning techniques are increasingly used in intelligent assistants, software
targeted at and continuously adapting to assisting end users with email, shopping, and other tasks. Examples include desktop SPAM filters, recommender systems, and handwriting recognition. Fixing such intelligent assistants when they learn incorrect behavior, however, has received only limited attention. To directly support end-user “debugging” of assistant behaviors learned via statistical machine learning, we present a Why-oriented approach that allows users to ask questions about how the assistant made its predictions, provides answers to these “why” questions, and allows users to
interactively change these answers to “debug” these assistants’ current and future
predictions. To understand the strengths and weaknesses of the approach, we conducted an exploratory study to investigate barriers that participants would encounter when debugging an intelligent assistant using our approach, and the information those participants requested to overcome these barriers. To help ensure the inclusiveness of our investigation, we also explored how gender differences played a role in barriers and information needs. We then use these results to consider opportunities for Why-oriented approaches to address the users’ barriers and information needs.
1. Introduction **D2
Machine learning is increasingly being used to power intelligent assistants, software
fewer e-mails, recommendations find interests quickly, and handwriting recognition tools do a good job of typing up the user’s notes.
What happens, however, when a user’s assistant adapts itself in unhelpful ways? A straightforward answer might seem to be “provide more training examples,” but such an approach can be unrealistically time-consuming for an end user, and may not solve the particular misbehaviors the user cares most about. We posit instead that, just as with regular software, when an intelligent assistant fails, it should be possible to debug it directly. Further, since intelligent assistants do not return to the hands of programming specialists, the only people in a position to debug intelligent assistants are the end users themselves, because they are the only ones using that specific adaptation.
Enabling end users to debug their assistants is non-trivial: most users have little knowledge of how systems based on machine learning operate. Prior work, however, has shown that end users can learn to understand how a learning system makes its decisions [Tullio et al. 2007]. We therefore prototyped a new approach that aims to support end users in guiding and correcting—i.e., debugging—automated text classification. The domain we chose to explore was classification of e-mail messages into e-mail folders, as supported by the widely used naïve Bayes algorithm.
Our work makes three primary contributions. First, we present a new Why-oriented
approach to allow end users to debug their intelligent assistants. The approach not only
focuses on answering end-user questions about why the program is behaving in its current
manner; it also provides interactive explanations that serve as a debugging mechanism.
Because end users are directly debugging the assistant (as opposed to providing new training examples), our approach presents information that a programmer would expect when directly debugging other kinds of software: representations of both the intelligent
assistant’s logic (i.e., its source code) and runtime state. The essence of the approach is
simple: if the users do not like the explanations that answer their “why” questions, they can change the explanations to direct the assistant to behave more accurately.
Second, our work explores the difficulties experienced by end users attempting to debug an assistant in this Why-oriented manner. We present an exploratory study that
identifies and categorizes barriers users encountered while debugging using a prototype
end-user debuggers expressed, and when they needed this information. Finally, because of recent evidence of gender differences in debugging (e.g., [Grigoreanu et al. 2008, Subrahmaniyan et al. 2008]), we investigated differences in barriers and information needs by gender to highlight design considerations that could differently impact these subsets of end users.
Third, we consider how to progress further with Why-oriented debugging by
identifying machine learning solutions and open research questions as to how machine
learning systems can address the information needs and barriers of end users attempting to debug their intelligent assistants.
2. Related Work **D2.9
As part of its support for debugging, our Why-oriented approach explains the logic of an intelligent assistant to end users so that they can understand how to debug it. There are thus two major classes of prior work: techniques that support end-user debugging, and techniques that support communication between users and machine learning systems. We next discuss each, identifying the foundations that informed the design of our own prototype.
2.1 End-User Debugging **D2.75
Outside of machine learning, there are a number of debugging systems that help end users find and understand the causes of faulty behavior. For example, in the spreadsheet domain, WYSIWYT [Burnett et al. 2003] has a fault localization device that helps users reason about successful and unsuccessful “tests” to locate cells whose formulas are likely to be faulty. Woodstein [Wagner and Lieberman 2004] helps users to debug e-commerce problems by explaining events and transactions between services.
The Whyline [Ko 2008] pioneered a method (also outside the realm of machine learning) to debug certain types of programs in an explanation-centric way. Because the Whyline informs our approach, we present it in some detail.
program output by allowing them to select an element of the program and receive a list of why and why not questions and answers in response. These “Why?” questions and answers are extracted automatically from a program execution history, while “Why not” answers derive from a reachability analysis to identify decision points in the program that could have led to the desired output. In the Crystal prototype, rather than presenting answers as sequences of statement executions, answers are presented in terms of the user-modifiable input that influenced code execution. In all of these Whyline tools, the key design idea is that users select some output they want to understand, and the system explains the underlying program logic that caused it.
Some researchers have focused on the problems and needs end users encounter when
they debug. For example, Ko et al. explored learning barriers that novice programmers
encountered when learning how to solve problems in a programming environment [Ko et
al. 2004]. Researchers from the WYSIWYT project have categorized the information
needs of end users debugging [Kissinger et al. 2006], enumerating the types of information that end users sought in attempting to debug spreadsheets. These barriers and information needs may also relate to non-traditional debugging, such as fixing intelligent assistants. **MMB to anyone: R1 wanted more on Kissinger. Potentially this is the right place to put that, or perhaps it goes better later? (And if later, maybe we should hint at that here?) **TDK: I was planning on discussing this later, in the Information Needs section.
2.2 Communicating with Machine Learning Systems **D2.75
Much of the work in explaining probabilistic machine learning algorithms has focused on the naïve Bayes classifier [Becker et al. 2001, Kononenko 1993] and, more generally, on linear additive classifiers [Poulin et al. 2006]. Explanation of these algorithms is relatively straightforward and computationally feasible on modern hardware. Tullio et al. reported that, given some basic types of explanations, end users can understand how machine learning systems operate [Tullio et al. 2007], with the caveat that overcoming any preliminary faulty assumptions may be problematic. More sophisticated, though computationally expensive, explanation algorithms have been developed for general Bayesian networks [Lacave and Diez 2002]. Finally, Lim et al. [Lim et al. 2009] investigated the usefulness of the Whyline approach for explaining simple decision trees and found that the approach was viable for explaining this relatively understandable form of machine learning.
Regarding allowing end users to actually influence behaviors in machine learning
settings, some Programming by Demonstration (PBD) systems learn programs interactively, via machine learning techniques, based on sequences of user actions (see [Lieberman 2001] for a collection of such systems). When debugging these kinds of programs, end-user corrections are limited to the addition or removal of training data— unless the user reverts to a traditional programming language such as Lisp (e.g., [Vander Zanden and Myers 1995]). For example, Gamut allows users to “nudge” the system when it makes a mistake, leading to the addition or deletion of training examples [McDaniel and Myers 1999]. Recent work with PBD systems allows some debugging of programs [Chen and Weld 2008], but again, their technique only allows the user to retract actions in a demonstration, which results in adding missing values to the training data rather than directly modifying the classifier’s logic. Still other systems allow users to patch up specific mistakes by an intelligent assistant, but do not take these corrections into account when the assistant makes future decisions. For example, if CoScripter/Koala programs misidentify web page objects, the user can specify the correct object for a particular page; the fix, however, will not affect how the program identifies similar objects on different pages [Little et al. 2007].
both a visualization of a classifier’s accuracy and the means to adjust its logic. EnsembleMatrix, however, is targeted at machine learning experts developing complex ensemble classifiers, rather than end users working with the resulting classifiers. ManiMatrix [Kapoor et al. 2010] provides an interactive visualization of a classifier’s accuracy, but user interactions are restricted to the modification of a classifier’s cost matrix.
Our own prior research has begun to explore end-user interactions with intelligent assistants, to understand how to effectively enable end users to debug such programs. Using a paper prototype, we previously investigated three different types of explanations (keyword-based, rule-based, and similarity-based) that machine learning systems could provide to end users regarding why it was behaving in a particular manner, as well as user reactions to these explanations [Stumpf et al. 2007]. This paper prototype was also used to elicit corrections to the logic from participants (e.g., adjusting feature weights), allowing us to design an interactive prototype supporting the explanations best understood by participants and the types of corrections they most requested [Stumpf et al. 2008]. The interactive prototype permitted us to run offline experiments studying the effects of the corrections provided by end users on prediction accuracy versus traditional label-based corrections. The results suggest that even when very simple corrections are incorporated into the assistant’s decision-making process, it has the potential to increase the accuracy of the resulting predictions [Stumpf et al. 2008, Stumpf et al. 2009]. For some users, however, the quality of the assistant’s predictions decreased as a result of their corrections; there were barriers that prevented them from successfully debugging the assistant.
In summary, the ability of end users to interactively debug machine-learned logic has been limited. Researchers have begun to investigate how such logic can be explained to end users, but user corrections, if available at all, has been heavily restricted to specific forms (e.g., addition of training data) or situations (e.g., the initial creation of a new program via PBD). In addition to explaining the underlying logic, this paper also
addresses supporting end users actually fixing the logic of a program learned by a
3. A Why-Oriented Approach for Debugging Intelligent
Assistants **D2
Inspired by the success of the Whyline’s support for debugging [Ko 2008, Myers et al. 2006] and favorable user feedback regarding “why” and “why not”-style explanations [Lim et al. 2009, Lim and Dey 2009], we developed a Why-oriented approach for end-user debugging of intelligent assistants. We applied this approach to the design of a prototype that allows end users to debug an assistant’s predicted folder classifications of an e-mail application.
Our approach is the first to combine the following elements:
(1) it allows end users to ask questions directly to statistical machine learning systems (e.g., “why will this message be filed to ‘Systems’?”),
(2) the answers to which explain both the current logic and execution state (e.g., a visualization that shows importance of features/words to this folder, and how certain the system is that it belongs in this folder) and
(3) can be changed: users can change these explanations by direct manipulation, to
debug the system’s logic. These changes result in real-time adjustments to the assistant’s logic and resulting predictions.
3.1 Design of the Why Questions **D2
Developing the set of why questions about the logic and execution state of the intelligent assistant comprised two stages. In the Generate stage, generated the set of all possible questions that could be asked via the creation of a formal grammar. Then, in the Filter stage, we filtered the set of questions generated by the grammar to remove
impossible questions, where impossible refers to situations that were not related to or
achievable by debugging an intelligent assistant. We chose this generate-and-filter approach, as opposed to handcrafting the questions ourselves, to be sure we would not miss any possible questions **2.12.
and its estimation of word importance. The first inventory (domain objects) is
enumerated in the Subjects section of Table **QueryGrammar, and the latter two
together are the Situations section of Table **QueryGrammar.
**MMB to Todd: I’d like to change “source code” to “logic” throughout -- ok? It makes the story line much easier to unravel...
Step four relates to past, present, and future program states. Thus, we enumerated
three question-word phrases -- why is, why did, and how can -- plus the negations of these
Table **QueryGrammar: The query grammar used to generate our Why questions.
Components Productions
Questions •Why...?
•How...?
Verbs •To be
•To do
•Can/Make
Modifiers •This
•All
•Many
•Recent
•Important
Subjects •Message
•Folder
•Word
•Change
•End user (i.e., “I”)
Situations •Current classification
•Change in classification
•Importance
•Availability (i.e., displayed in the UI)
Queries •[query] = [question] [verb] [subject] [situation] | [question] [situation] [verb] [subject]
•[situation] = [situation] | [situation] [subject] |
[subject] [situation]
•[subject] = [subject] | [modifier] [subject]
[image:10.612.99.513.265.718.2]phrases. We included “how can” questions to support debugging questions about future
states of the system: when the system explains why it did something, the answer often
implies how alterations could make the system do something different. We split these
three question-word phrases into two non-terminals (question words and verb words) to
make our query production more flexible. The Questions and Verbs sections of Table
**QueryGrammar generate a super-set of these types of question-word phrases. Finally,
in step five we added the Modifiers section to allow generated questions to be more
specific, e.g., a question about recently changed predictions, rather than all changed
predictions. The Queries section of Table **QueryGrammar describes how the various
components may be combined to form the universe of possible questions.
For example, our grammar defines a possible query as “[question] [verb] [subject]
[situation]”. Selecting the first listed production for [question], [verb], and [subject]
produces the production “Why will this message [situation]?”. The first production for
the Situations component (current classification) can then be substituted for [situation], resulting in the completed question, “Why will this message be filed to Enron News?”. **1.3, **2.11
In the Filter stage, we filtered the questions generated by the grammar in three ways. First, we removed questions about subject/situation combinations that could not be
accomplished by the intelligent assistant. For example, a message (a Subject) can change
its current classification (a Situation), but words and folders (also Subjects) cannot. We
further refined our list of questions by removing any questions not relating to debugging, such as “Why can important words be displayed?” Finally, we removed re-phrasings of similar questions; this explains why there are no questions beginning with “How can…”,
since asking “How can I make something happen?” is answered by the same information
provided by the “Why didn’t something happen?” questions. This decision is consistent
with the results of [Lim et al. 2009], who found that participants were more successful reasoning about intelligent assistants in the form of decision trees when presented with answers to either “Why…” or “Why not…” questions, than participants were when presented with answers to “How to…” questions **1.3.
required only six types of questions [Ko 2008] in the complex domain of Java programming.) Figure **WhyQuestionsMenu shows how these questions were presented in the prototype, including their context dependency (such as the ability of the user to select questions relating to specific folders).
Table **WhyQuestions: The Why questions and the query grammar productions used to generate them. Color is used to map each non-terminal production to the terminal English phrase it generated. Text in < > is dynamically replaced with the
word or folder the user has selected.
Why Questions Generating Production
Whywillthismessagebe filed to <Personal>?
[question] [verb] [modifier]
[subject] [situation] [subject]
Why won’t this message be filed to <Bankruptcy>?
[question] [verb] [modifier]
[subject] [situation] [subject]
Why did this message turn red? [question] [verb] [modifier]
[subject] [situation]
Why wasn’t this message affected by my recent changes?
[question] [verb] [modifier]
[subject] [situation] [modifier]
[subject]
Why did so many messages turn red?
[question] [verb] [modifier]
[subject] [situation]
Why is this email undecided? [question] [verb] [modifier]
[subject] [situation]
Why does <banking> matter to the <Bankruptcy> folder?
[image:12.612.101.511.254.595.2][question] [verb] [subject] [situation] [subject]
Why aren’t all important words shown?
[question] [verb] [modifier]
[subject] [situation]
Why can’tmake I this message go to <Systems>? 1
[question] [verb] [subject] [modifier] [subject] [situation]
[subject]
1
3.2 Design of the Interactive Why Answers **D2
In the original WhyLine, answers to “why” questions pointed to relevant places in the source code, but in intelligent assistants, there is no source code that represents the
assistant’s learned logic for end users to look at or modify. Thus, the interactive answer
content would have to represent the assistant’s logic by some device other than source code, while still allowing end users to edit it effectively to change the assistant’s logic.
Thus, we designed the interactive answers according to four principles:
Principle Representation-1: **2.6 Representations of both the assistant’s logic and execution state should be available to and manipulable by end-user debuggers.
Principle Representation-2: Explanations of the source code and execution state should not obscure or overly simplify the program’s logic.
Principle ML-1: The intelligent assistant should be explainable to end users. Principle ML-2: The intelligent assistant should heed end users’ corrections.
Principle Representation-1 was inspired by the information content that traditional debugging systems provide. Such systems provide a representation of the logic (source code) that the programmer can edit. They also provide ways to inspect concrete data about program execution states. For example, debuggers provide access to the value of variables and the stack.
Principle Representation-2 boils down to being fully truthful with the user about the assistant’s logic. Machine learning often uses complex statistical models, so there is a
[image:13.612.92.517.523.697.2]temptation to hide complex details from the end user in an effort to make the system easier to understand. Recent research [Tullio et al. 2007], however, showed that end users
couldunderstand the logic machine learning systems use to make their decisions, at least
in a rule-based system **2.9. Further, obscuring this logic would break the debugging “principle of immediacy” [Ungar et al. 1997] by creating an artificial division between the logic end users can view and interact with, and the underlying logic actually responsible for the assistant’s output. Thus, abstracting away portions of the assistant’s logic may hamper, rather than help, the user’s debugging efforts. **1.2, **2.8
Principle ML-1 is almost a corollary to Principle Representation-2. We wanted to support underlying learning algorithms more complex than the trivially explainable decision trees, but not algorithms so complex that supporting Principle Representation-2 would become impossible. Regarding Principle ML-2, we also required that the underlying learning algorithm must be responsive to the user’s interactive manipulations to the logic representation. We expand upon both of these points in the next subsection.
3.3 The Answer Design Principles and the Underlying Machine Learning Engine **D2? **MMB to WKW, pls chk wording of entire subsection.
With these four design principles in mind, we chose the naïve Bayes [Russell and Norvig 2003] algorithm for our prototype. Naïve Bayes is a widely used algorithm for text classification, more complex than ordinary decision trees, yet seemed potentially explainable to end users (Principle ML-1).
The machine learning features in our e-mail prediction application were the words embedded in actual e-mail messages. Given our choice of naïve Bayes as the learning algorithm, these features and their associated predictive value for a classification are a
complete representation of the assistant’s logic. The execution state of the assistant is
therefore the current set of predictions resulting from this logic, including the assistant’s degree of certainty in each prediction. This application of Principle Representation-1 thus results in user-manipulable logic (words and their associated importance), changes to which affect the assistant’s execution state (its predictions and their associated confidence).
stipulates that the explanation should accurately reflect the logic of the assistant. Thus, given our use of naïve Bayes, we chose keyword-based explanations consisting of words and their weights. To implement Principle Representation-2, the visualization is a truthful reflection of the logic of naïve Bayes and hence displays the union of all words in all e-mail messages. We allowed users to adjust the weights of any word. Because naïve Bayes classifiers also use class distribution to inform their predictions, the distribution of messages across folders is also shown to the end user. Hence, the visualization and manipulations allow the user to directly change the logic the assistant should follow, based on an accurate representation of how the logic works.
Principle ML-2 says that corrections end users give the system should be heeded. We had considered using user co-training [Stumpf et al. 2009] as the underlying algorithm. When user co-training receives new information from the user about a feature’s value to a
folder, this technique assigns a new weight, based on a combination of the user-assigned
value and the classifier’s internal weight—which could potentially be quite different from the user-assigned value. In our previous work with user co-training [Stumpf et al. 2008], we observed that this behavior was frustrating to users because it made the algorithm appear to “disobey” the user’s corrections. Thus, instead of user co-training, we modified the naïve Bayes implementation such that corrections can be integrated in a straightforward manner and, when the user modifies the weight of a word, the classifier can set the new value to be close to the value specified by the user. **2.1
approximately 6,000 different words contained in our email messages) would have little noticeable impact on classification.
3.4 End-User Debugging with Answers **D2
From these design choices, the answers took the following form. Textual answers are provided for all questions, giving high-level explanations about the logic of the assistant and general suggestions about how to debug the program, but three questions are also answered through detailed visualizations of the assistant’s logic: these answers formed the debugging mechanism for the end user.
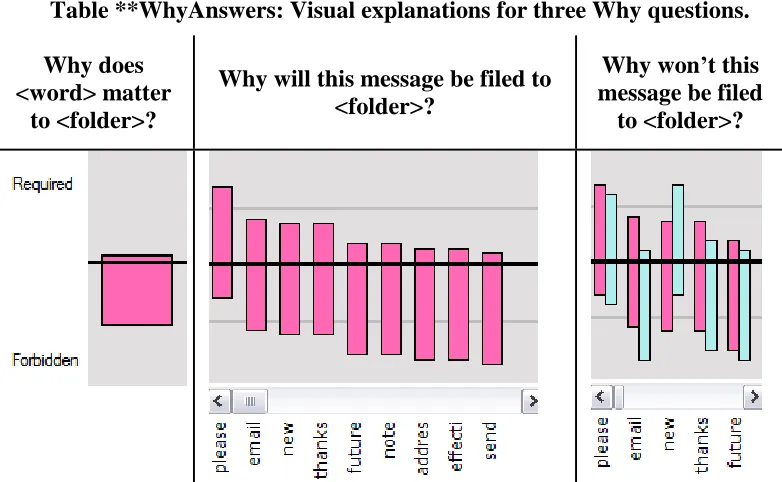
These answer visualizations are shown in Table **WhyAnswers. Similar to ExplainD [Poulin et al. 2006], bars represent the importance of each feature to a given classification. However, rather than using bar area to indicate a feature’s contribution toward the learning system’s prediction, we indicated importance via bar location. By changing a bar’s location, the feature’s weight can be adjusted in real-time **2.4, **2.5. The choice of bars, as opposed to points or some other representation, was because their large target size makes mouse-based interaction and visual discrimination easy. To debug the assistant’s faulty logic, users can change these answers by manipulating the bars, which operate like sliders or faders, with the weight of evidence represented by each bar being the midpoint of the bar **2.16.
Providing the necessary interactive aspect for these bar visualizations required support from the underlying machine learning algorithm. Before explaining how these visualizations were implemented, we formally define the following properties of the naïve Bayes algorithm. An e-mail message is represented as a “bag of words”, i.e., a
Boolean vector W = (W1, …, Wm) in which Wi takes the value true if the ith word of a
vocabulary of m words is present in the e-mail message and false otherwise. The
vocabulary in our experiment consists of the union of the words from the following parts of all the e-mails: the message body, the subject line, and e-mail addresses in the ‘To’, ‘From’ and ‘CC’ parts of the message header. Stop words, which are common words with little predictive value (such as “a” and “the”) were not included in the vocabulary.
In previous work [Stumpf et al. 2007] we observed that end users understood how the presence of keywords influenced a message’s classification, but they struggled with the concept of how the absence of words influenced the same classification. We addressed this difficulty in a novel way by showing the weight associated with each word in the
vocabulary via a bar positioned between the two extremes of Required and Forbidden,
shown in the leftmost images of Table **WhyAnswers. For folder f, the weight of a word
is the probability P(Wi = true | F = f) where Wi is the random variable for the ith word
and F is the random variable for the folder. The closer the bar is to Required, the more
important the presence of the word is to the prediction. If the top of the bar is at its
highest position, then P(W = true | F = f) = 1.0. If the top of the bar is on the black line in
the middle, then P(W = true | F = f) = 0.0. Since P(Wi = false | F=f) = 1.0-P(Wi = true |
F = f), the position of the bottom of the bar can also be interpreted as the probability of the absence of the word. If the bottom of the bar is at its lowest position, (i.e. closest to Forbidden), then P(W = true | F = f) = 0.0. In reality, although the end user is able to set
the bars to its highest or lowest positions, the probability P(W | F=f) is never set to the
extreme values of 1.0 or 0.0 due to the naïve Bayes algorithm’s use of Dirichlet priors to smooth the probabilities. As a result, the probabilities will be an epsilon different from
Table **WhyAnswers: Visual explanations for three Why questions.
Why does <word> matter
to <folder>?
Why will this message be filed to <folder>?
[image:17.612.106.497.457.698.2]the extremes and the bar will be positioned slightly below / above the Required / Forbidden level in the visualization.
Aside from the probability P(W | F), the naïve Bayes classifier also uses the class
probability P(F). We chose not to display P(F) because the training set consisted of an
equal number of emails in each folder.
3.4.2 Answering: “Why won’t this message be filed in <Folder>?” **D2
The answer to this question is in the form of a dual-bar view that allows the user to compare and contrast the importance of words between the two folders, shown in the right image of Table **WhyAnswers. The bars show the respective weights for the
currently predicted folder f, and the other folder f’ the user indicated, where the positions
of the bars correspond to P(Wi = true | F = f) and P(Wi = true | F = f’), respectively.
We can illustrate the degree that an e-mail “belongs” to either folder f or f’ using the
arrow, as shown at the top of Figure **DebuggingFeatures. The angle of the arrow
between the folders is based on the difference between P( F = f’ | W1, …, Wm) and P( F =
f | W1, …, Wm). This also serves to reveal the execution state to the end user. Since the bars
allow weights associated with the two folders f and f’ to be manipulated, changes to
individual words by the end user that result in P( F = f’ | W1, …, Wm) > P( F = f | W1, …,
Wm) will be shown by the arrow moving to point to folder f’ instead.
3.5 Debugging Scenario Using the Prototype **D2
If at some point the user wants to know why the program is behaving in a particular way, she can ask Why questions either through the global menu bar or a context-sensitive menu and receive an answer which supports debugging. Consider the following scenario:
A user notices that her intelligent assistant thinks a message about Systems belongs in the
Resumes folder. In Figure **DebuggingFeatures, this user has just asked why the
message is not filed under Systems. The keyword bar graph shows the system’s opinion
of the importance of each word to the Resumes folder (dark pink), which is the current
folder for this message, versus importance to the Systems folder (light blue). While
reviewing this explanation, the user quickly identifies a problem—her assistant thinks the word “please” is equally important to both folders. The user disagrees; she wants to tell her intelligent assistant that she rarely sees the word “please” in messages from the Systems group. Thus, she drags the light blue bar lower (second from left); how much
lower depends on her assessment of how important “please” should be to the Systems
folder. The dark blue bar indicates the original importance of “please”, allowing the user
[image:19.612.112.508.371.691.2]to see her change and its magnitude. **3.2
User changes to each bar graph entry cause the system to immediately recalculate its predictions for every message in the inbox, allowing users to instantly see the impact of their manipulations. These changed folder predictions are shown through a change in direction of the arrow between the two folders for the currently viewed message. They are also listed textually next to each message header in the inbox, highlighting headers whose predictions have changed. For every manipulation, the user immediately sees how both the source code (in terms of the importance of words), and the execution state (e.g., the resulting program’s predictions), have changed.
4. Addressing Debugging Barriers and Information Needs
using the Why-Oriented Approach **D1
To investigate obstacles end users might encounter while correcting an intelligent assistant using this new approach, we conducted an exploratory study using the prototype we have just described. Our purpose was not a summative evaluation of the prototype, but rather to investigate three questions to understand how our approach could be
Figure **DebuggingFeatures: Close-up of the visualization/debugging features. The user has just decreased the importance of “please” to Systems by dragging the blue
[image:20.612.166.461.70.324.2]extended to further support end-user debugging: when and where end-user debuggers
encounter problem areas (barriers), what could help users when they encounter these
problem areas (information needs), and how machine learning algorithms could help
address the barriers and information needs. Further, since researchers have recently found evidence of gender differences in debugging, we investigated gender as an aspect to highlight design considerations that could differently impact subsets of end users.
4.1 Exploratory Study Design
4.1.1 User Study Design and Participants **D1
The study used a dialogue-based think-aloud design, in which pairs of users talked to each other while collaborating on a task. The pair design was to encourage “thinking aloud” by leveraging the social norms that encourage people to voice their reasoning and justifications for actions when working with a partner.
Six pairs of female and five pairs of male students participated. The pairs were evenly distributed by gender across GPAs, years in university, and e-mail experience. All twenty-two participants were required to have previous e-mail experience and no computer science background. In order to eliminate a lack of familiarity with each other as a potential confound, pairs were required to sign up together. Pairs also had to be same-gender, so that we could clearly identify any gender differences that might arise.
We ran the study one pair at a time. Each session started with the participants completing a questionnaire that asked for background information and gathered standard pre-session self-efficacy data [Compeau and Higgins 1995]. We then familiarized the pair with the software and examples of classification through a 20-minute hands-on tutorial. The tutorial taught participants about the filing and classification abilities of the prototype, taught them how to ask the prototype questions, and gave an overview of the the prototype’s answers and how to change those answers **3.2.
quickly as possible, doing so in a way that would help improve later classification. Because the prototype’s classifier did not train on (and thus, did not learn from) messages the participants manually dragged to folders, the task encouraged participants to debug the system via the interactive explanations **3.2.
We used the publicly available Enron e-mail data set in our study. To simulate a shared mailbox, we combined messages that three users (farmer-d, kaminski-v, and lokay-m) had originally filed into five folders (Bankruptcy, Enron News, Personal, Resumes, and Systems). At the start of the session, each folder held 20 messages that were used to initially train the classifier. Participants were given five minutes prior to the main task to familiarize themselves with the existing categorization scheme, so that they would have an idea of how new messages should be filed **3.2, **3.4. The Inbox contained 50 more messages for the participants to work on. The amount of training data was small to simulate real-world situations in which users have not invested the time to label hundreds of training examples.
The pair worked on the main task for 40 minutes, with participants switching control of the mouse half way through the session. We used Morae software to capture video and audio of each user session, synchronized with their screen activity. Our prototype also logged each user action. After completing the main task, participants individually filled out a questionnaire gathering feedback about the prototype and their post-session self-efficacy.
4.1.2 Analysis Methodology **D1
Design barriers are situations where the end user does not know what they want the computer to do. When debugging an intelligent assistant, this means the user doesn't have a clear idea of how to go about fixing the assistant.
Selection barriers occur when the end user knows what they want the
computer to do, but does not know which programming tools will accomplish their goal. Our why-oriented approach's programming tool is the ability to adjust the assistant's logic via feature modification, so we mapped selection barriers to end user difficulties in selecting which feature to adjust.
Coordination barriers are times when the user knows the programming tools they want to use, but does not know how to make them work together. As with selection barriers, our programming tool is the ability to modify the features the assistant uses to classify items; such feature adjustments may alter multiple classifications. Thus, coordination barriers in this domain reflect the difficulty of coordinating how changes to the assistant's logic are reflected in updated classifications.
Usebarriers are situations where the end user knows which programming tools they want to use, but does not know how to use them properly. Our approach's UI affordance for feature modification is to drag a slider up (to increase the importance of a feature's presence) or down (to increase the importance of a feature's absence). Trouble deciding in which direction and to what extent to adjust this slider is our approach's version of use barriers.
Understandingbarriers occur when end users thought they knew what to do, but the results of their actions was surprising. This barrier very cleanly mapped to situations where the end user was surprised by the assistant's feedback.
2008] identified six common actions in fixing bugs in programming environments. We applied the two of these not involving data structuring or writing new source code, and also introduced a fault detection code. These codes are also given in Table
**BarrierCodes.
We applied the codes to “turns”. A turn consisted of sentences spoken by a participant until his or her partner next spoke. Speech by one participant that contained a significant pause was segmented into two turns. If the same barrier spanned multiple
Table **BarrierCodes: Coding scheme used to analyze our data. The examples are from actual participant transcripts **3.5.
Code Meaning Example
B
ar
rier
s
Design Uncertainty regarding overall debugging strategy (i.e., designing a solution to the problem).
“Can we just click File It?”
Selection Knows what to do, but is having trouble selecting which object to change.
“What kind of words should tell the computer to [file this] to Systems?”
Coordination Doesn’t understand how changes affect the rest of the system.
“Why... why it won’t go to Personal...”
Use Trouble determining
appropriate weights to use with the source code visualization.
“So is [this word] ‘unimportant’?”
Understanding Doesn’t understand the
system’s feedback. “Why is ‘web’ more forbidden for [the] Systems [folder]?”
De b u ggin g Ac tivitie
s Fault Detection Detecting an incorrect
prediction by the system.
“It’s going to [the] Systems [folder]; we do not want Systems.”
Diagnosing Diagnosing the specific cause of a detected fault.
“Well, ‘e-mail’ needs to be higher.”
Hypothesizing Hypothesizing a general solution for a detected fault.
[image:24.612.85.532.186.612.2]turns (for example, if one person was interrupted by the other), only the first occurrence of the barrier was coded. Only one code could be applied per turn.
Coding iteratively, two researchers independently coded a 5-minute random section of a transcript. We calculated similarity of coding by calculating the Jaccard index, dividing the size of the intersection of codes by the size of the union for each turn, and then averaging over all turns. Disagreements led to refinements in coding rules that were tested in the next coding iteration. Agreement eventually reached 82% for a five-minute transcript section, followed by an agreement of 81% for a complete 40-minute transcript. Given this acceptable level of reliability, the two researchers divided the coding of the remaining transcripts between themselves. A two-minute section of a coded transcript is include in Table **CodedTranscript to illustrate the application of our final code set.
Table **CodedTranscript: Example of our code set applied to a participant transcript **3.5.
Time Participant Utterance Code
11 P1
And then... [looking at another email] should this be in Personal? It'll be all right. EOL...dist-dist-distributions? How come everything is going to Personal?
Coordination
11 P2
Because we filed to Personal last time. The system learned from other email. [clicks on 'windows 2000/outlook delay'] But this email should go to...systems. So would we have to change every single one?
Selection
12 P1 Did we do something wrong in the
beginning? Design
12 P2 I think this one can go to Personal.
12 P1 Do we have to change the same thing again? Can we drag? If we drag we have to do it
for every one.
12 P2 Do we need to make them learn everything? Design
12 P1 But I don't want to have to do it every time
so like in next 10 minutes.
12 P2 So you adjust every single message. Hypothesizing
12 P1 Or maybe just this one. Maybe it will
learn...I don't know. Hypothesizing
13 P2 [ask 'why won't this message be filed to systems' and sorts words alphabetically.
Finds 'windows'] Oh look it should be
[image:25.612.89.527.332.720.2]important but it's not. [drags 'windows' up to increase importance] But I don't think we'll need that one that long. So can you go back?
13 P1 Are you sure it's enough? Use
4.2 Results: Debugging Barriers (When and Where)
4.2.1 Barriers Encountered **D1
Our participants’ attempts to debug ran into numerous barriers, encountering an average of 29 barriers during the 40-minute study (with a range from 7 to 66). The number of barriers encountered can be contrasted with the number of messages participants actually filed (mean=16.1, SD=8.3); participants were less likely to encounter a situation where they felt comfortable filing a message than they were to encounter an obstacle while attempting that task **3.4. These barriers were equally likely to be encountered at the beginning and end of the study, but were unequally encountered between participants: a strong relationship existed between participant self-efficacy and the number of barriers they encountered (normalized for the number of utterances each
participant made) (linear regression, F(1,9)=7.11, R2=0.44, beta=-0.005, p=.026) **3.4.
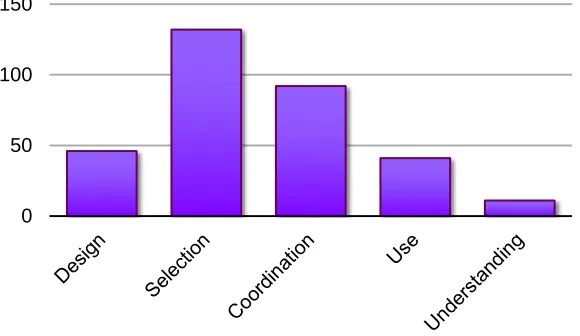
Everyone hit barriers, and the participants who encountered them the most had the lowest confidence in their ability to fix the assistant to begin with, thus underscoring the importance of addressing these barriers in approaches for debugging intelligent assistants. As Figure **BarriersEncountered shows, the most frequent barriers our participants
encountered were Selection barriers (40% of all barriers). Selection barriers relate to the
difficulty of selecting the right words or messages to modify in order to correct the program. In Ko et al’s work [Ko et al. 2004] on traditional programming environments, Selection barriers did not play a large role, but this kind of barrier seems to pose a substantial problem to debugging intelligent assistants. This participant, for example, was
having trouble determining which features are important for the Systems classification:
**1.4
P712: “Then ‘news’? Well, they like team players. Contributions? That would be more that you’d use for news than Systems.”
predictions, as well as coordinating how the system responded (or failed to respond) to their source code modifications:
P732: “Resume? [user finds word, makes ‘resume’ required] Why didn’t it change it?”
Further evidence that Selection and Coordination barriers were especially
problematic comes from participants’ questionnaire responses, where 16 of 22 respondents (72%) mentioned difficulty in determining which words were important when fixing misclassified mail.
Some barriers encountered frequently in traditional programming environments did not play as much of a role as expected in debugging intelligent assistants [Ko et al. 2004]; our findings also contradict specific problems with strategy in end-user debugging
[Kissinger et al. 2006]. Our participants ran into Design and Use barriers less frequently
(14% and 12%, respectively), possibly because debugging via our approach involved programming constructs (i.e., feature adjustments) which only had two options—a feature could be made either more or less important. Both [Ko et al. 2004] and [Kissinger et al. 2006] explored programming environments with a wider array of available constructs (Visual Basic .NET and spread sheet formulas, respectively). Their participants may thus have had more opportunities to strategize about their debugging approaches, and we would expect recalling the proper usage of each programming construct to be more difficult than the two options (e.g., dragging a bar up or down)
Figure **BarriersEncountered: Sum of barriers encountered in all transcripts. 0
[image:27.612.164.454.518.686.2]available to our participants. While Design and Use barriers should not be neglected, the
predominance of Selection and Coordination barriers in this domain suggests that end
users may have less trouble deciding on a strategy for how to give feedback (Design and
Use), than on where to give feedback (Selection and Coordination) **1.5.
Our results highlight that the kinds of barriers encountered while debugging intelligent assistants may be rather different than those seen in traditional programming environments, and hence require their own specialized support. Our Why-oriented approach provides explanations of source code and execution state, but the prevalence of the Selection and Coordination barriers suggests the need for debugging approaches to also help users identify the most useful places to change the source code (fault localization) as well as explaining the likely effects of executing such changes (run-time outputs).
The differences between the barriers our participants encountered and those faced by Ko's participants may also be related to differences in the programming environments. Our why-oriented approach included many instances of a single programming construct (feature importance); participants had relatively few problems using or understanding the results of interaction with this construct, but a great deal of difficulty in selecting which instances of the construct to interact with. The integrated logic of machine learning systems may have further contributed to these obstacles, causing confusion when multiple predictions changed as a result of a single feature modification. Our prototype's design may also have played a role: by showing feature weights in the context of particular messages, participants may not have expected adjustments to impact the
assistant's other predictions. Even if participants did expect such wide-ranging changes,
explain why our participants often encountered Selection and Coordination barriers, while Ko’s most frequently hit Use and Understanding barriers **2.3.
4.2.2 Gender Differences in Barrier Encounters **D1
Are barriers different for male and female end-user debuggers, and will overcoming them require different kinds of support? Interestingly, males and females did not appear to experience the same number of barriers: females encountered an average of 33.3 per session, versus the male average of 24.4 per session. This difference was despite the fact that males talked more (and thus had more opportunities to verbalize barriers) than females, averaging 354 turns per session, compared to 288 for females.
Figure **AverageBarriers shows the average barrier count per session (the same differences are also present in comparing the average barrier counts per turn). Females experienced more barriers in almost every category; the only exceptions were Coordination and Understanding. Selection barriers, the most common barrier type, had a large difference: females averaged 14 per session, about 1.5 times as many as the male average of nine. This difference was statistically significant despite the small size of our
sample population (Wilcoxon Rank-Sum Test: Z = 2.1044, p < 0.05). Design barriers,
too, exhibited a strong contrast, with females averaging 5.3 per session versus males
averaging 2.8. The differences in both the total number of barriers and Design barriers
encountered were not statistically significant, but this may be a result of our small sample size (totaling six female and five male pairs). A statistically oriented experiment with a larger sample is needed to provide more conclusive evidence.
One reason for the apparent differences may be that females expected more problems due to lower self-efficacy (a form of self-confidence specific to the expectation of succeeding at an upcoming task [Bandura 1977]). As referenced earlier, there was a significant, inverse correlation between self-efficacy and the number of barriers a participant encountered. Females came into the study with lower self-efficacy (measured via a self-efficacy question set [Compeau and Higgins 1995]) than males, scoring an average of 38 out of a possible 50, compared to 42 for males (Wilcoxon Rank-Sum Test:
Z = -2.64, p < .01). This is consistent with similar self-efficacy differences for end users
in barriers are consistent with prior research in another aspect as well: these prior works showed gender differences in both features used and the strategies end users employed to find and fix errors in spreadsheets.
Another possible cause of the observed disparities may be gender differences in information processing. For example, work on the selectivity theory of information processing [Meyers-Levy 1989] has shown a number of differences in how males and females process information. According to this theory, females are more likely to work with information comprehensively, whereas males are likely to pursue information more selectively. The following quotes illustrate the tendency our female pairs showed toward examining several words from a message before moving on, versus males’ propensity for advancing to the next message as quickly as possible:
Female Pair
P1131: “So that [word is] really important. And then, um, probably ‘updates’ would be important. And then, um... [the word] ‘virus’?”
P1132: “Yeah. And then, uh, [the word] ‘login’.”
Male Pair
P1211: “Its [classification is] correct. It’s learned something, eh.”
P1212: “Um hmm.”
P1211: “Lets go to the next message.”
Figure **AverageBarriers: Average number of barriers per session encountered by males (dark blue bars) and females (light pink bars).
[image:30.612.184.461.71.245.2]The selectivity theory is also consistent with our frequency data: females worked with a larger set of words than males did (106 unique words for females vs. 62 for males), perhaps to perfect the algorithm’s performance. Males, conversely, may have been more inclined to move on to the next message as soon as they obtained the desired effect. Supporting this hypothesis is the average number of messages each group filed—male pairs averaged 19.8 messages filed in each 40-minute session, while female pairs averages 13.0. This suggests that in order to successfully support a wide range of end users, debugging features should be designed so that both of comprehensive and selective strategies can lead to success **1.6.
4.2.3 Barrier Transitions and Gender Differences **D1
When a participant encountered a barrier, what happened next? Were there different patterns of what male and female participants did after a hitting barrier? Encountering a barrier may have sent participants spiraling into non-productive repetition, or maybe they were able to overcome the barrier by themselves. Understanding how barriers are encountered and resolved (or not) can provide insight into their severity and impact on debugging intelligent assistants, and highlight when additional support may be most necessary.
To answer these questions, we investigated the sequence of barriers encountered and looked for differences between male and female participants. The barriers and debugging activities coded in participants’ verbalizations are simply states between which they can transition. To calculate the probability of each state (barrier or activity) following an initial barrier, we divided the number of occurrences of a particular subsequent state by
the total number of states that followed the initial barrier. For example, if Selection
followed Design once and Diagnosing followed Design twice, then the probability of
Selection following Design was computed as 1/(1 + 2) = 0.33, or 33%, and the
probability of Diagnosing following Design was computed as 2/(1 + 2) = 0.66, or 66%.
We use these probabilities only for clarity; our graphs (Figures **Transitions1, **Transitions2, **Transitions3, and **Transitions4) show the exact number of instances for completeness.
perhaps most users would flip between Design and Understanding barriers at the beginning of the task. Once those early hurdles were overcome, they might cycle through Selection, Coordination, and Use barriers until they understood the assistant’s logic, after which barriers would be encountered with considerably less frequency. When examining our participants’ data, however, we saw no discernible tendency for users to encounter barriers in specific orders or at consistent times during their debugging session. Nor did barrier frequency change in any significant way over time; users were just as likely to
encounter Design barriers in the first five minutes of the study as they were in the final
five minutes. This suggests that an approach aiming to support end-user debuggers in
overcoming barriers must support finer-grained patterns of barriers as they are
encountered, instead of basing its explanations on an expected common path.
Both male and female end users exhibited finer-grained patterns for many of the individual barriers. Although no single barrier stood out as a frequent transition from Design (Figure **Transitions1), when we examined gender differences, we found that
males reacted to Design barriers with some form of debugging activity on average 70%
of the time, versus 46% for females. Thus, it appears that Design barriers proved less of a
problem to males than females, since they were able to move on to a debugging activity
instead of encountering another barrier. Since Design barriers relate to a user lacking a
debugging strategy, an implication of this gender difference is that our approach’s explanations for overcoming these barriers should be certain to include strategies other researchers have identified as frequently employed by female end-user debuggers [Subrahmaniyan et al. 2008].
Figure **Transitions2 shows that the most common action following a Selection
barrier was the debugging activity Diagnosing, which occurred after 40% of Selection
barriers. The next most prevalent code was a second Selection barrier (19%), suggesting
that Selection barriers were either quickly overcome, leading to Diagnosing, or they
discussed the high number of Selection barriers overall, but Figure **Transitions2 points
to these barriers specifically stalling participants. This suggests the need for our approach
Figures **Transitions1, **Transitions2, **Transitions3, and **Transitions4 (from top to bottom): Number of transitions from barriers to other barriers or debugging
activities. Light squares indicate one instance by a female pair; dark squares indicate one instance by a male pair. Barrier nodes are colored light purple;
[image:34.612.181.453.81.637.2]P732: “And what about ‘interview’? Oh, we just did that, so no. ‘Working’, maybe?” [finds word]
P731: “Well, no because ‘working’ could be used for anything really.”
P732: “True.”
P731: “‘Work’, no.”
P732: “What about... [scrolls left] ‘scheduling’. No, that could be News.”
P731: “That could be News, too.”
P732: “What about ‘scientist’?”
P731: “That could be Personal.”
What about those users who did not stall on Selection barriers? Males had a higher
tendency of Hypothesizing following a Selection barrier than females, 26% to 11%.
Recall that Hypothesizing was coded when the pair discussed a possible fix but didn’t
include a specific word, whereas Diagnosing indicates that the pair specified the word
they intended to modify. Thus, males were more likely to follow a Selection barrier with
a general solution, while females tended to first agree on a word to alter. Why this difference? We know our female participants came into the study with lower self-efficacy than our male participants, and prior research [Beckwith 2007] has revealed female end users to be more risk averse, in general, than male end users. Both low self-efficacy and risk-aversion may have been alleviated by the pair coming to agreement about the best way to proceed; a participant’s self-efficacy could be boosted by discovering her partner agrees with her idea, and this improved confidence may in turn lower the perceived risk of the proposed debugging fix. Our approach could use the same solution proposed to
help users overcome Selection barriers (directing end users toward words which will have
the strongest effect on message reclassification) to help low self-efficacy users as well, by reducing the choice of which words to modify down to a more manageable, less intimidating subset.
Like Selection barriers, Coordination barriers often led to Diagnosing (30%) (Figure
**Transitions3). Taken together with the other two debugging actions, Fault Detection
(14%) and Hypothesizing (20%), this barrier was followed by a debugging action 65% of
the time. Males, however, tended to follow Coordination barriers with more Diagnosing
following confusion regarding the impact of their changes, female participants were more likely to step back and attempt to coordinate how their changes will impact the entire system, whereas males tended to stay focused on a specific failure. This would be yet another indication of the comprehensive problem-solving strategy associated with females [Meyers-Levy 1989], providing further evidence of the need to support both comprehensive and non-comprehensive problem-solving strategies in end user debugging environments.
Finally, Use barriers (Figure **Transitions4) were strongly tied with a transition to
Diagnosing (44%); all other transitions were below 15%. It seems that when a Use barrier was encountered, our participants’ response was to adjust their specific solution, rather than move to a different problem or generalize a solution. This was equally true for males and females. It appears that participants can frequently overcome this barrier by themselves and only need additional help in a few instances.
4.3 Results: Information Needs (What Could Help)
4.3.1 What Participants Wanted to Know **D1
What information would have helped our participants overcome these debugging barriers? To explore this, we manually compiled a list of every question participants asked during the course of the study, and two researchers iteratively grouped the questions based on the type of information being requested **3.6. This grouping resulted in the seven knowledge bases described in Table **InformationNeeds; the example questions in each category were taken verbatim from participant quotes. The information needs were nearly always in transcript segments that also contained a learning barrier (as described in section **4.1.2). We thus were able to calculate the relationship showing a categorization of participants’ verbalizations expressing what they wanted to know when they encountered each barrier. This information is presented via the graphs in Table **InformationNeedsFigure: each graph illustrates the percentage of learning barriers where participants explicitly requested a specific type of information to overcome the barrier **3.6. Figure **InformationNeedCounts shows the frequency of each category.
Figure **ExampleTransitions: An example participant pair’s path through the debugging barriers. The width of the arrows indicate the percentage of transitions: thinnest = 6%, thickest = 20%. Transitions accounting for 5% or less of the total are
[image:37.612.112.502.428.646.2]