A Location Scale Based CFAR Detection Framework for
FOPEN SAR Images
Marco Liguori∗, Alessio Izzo∗, Carmine Clemente†, Carmela Galdi∗, Maurizio Di Bisceglie∗ and John J. Soraghan† ∗ Department of Engineering, University of Sannio, 82100 Benevento, Italy
E-mail: marco [email protected], [email protected], [email protected], [email protected]
† University of Strathclyde, CeSIP, EEE, 204, George Street, G1 1XW, Glasgow, UK
E-mail: [email protected], [email protected]
Abstract—The problem of target detection in a complex clutter envir-onment, with Constant False Alarm Ratio (CFAR), is addressed in this paper. In particular an algorithm for CFAR target detection is applied to the context of FOliage PENetrating (FOPEN) Synthetic Aperture Radar (SAR) imaging. The extreme value distributions family is used to model the data and exploiting the location-scale property of this family of distributions, a multi-model CFAR algorithm is derived. Performance analysis on real data confirms the capability of the developed framework to control the false alarm probability.
I. INTRODUCTION
Among the different applications of Synthetic Aperture Radar Imaging, FOliage Penetration (FOPEN) is one of the most challenging [1]. The fundamental characteristic of FOPEN Radars is the capability to collect returns from scatterers under foliage. This goal is achieved by using relatively low frequencies for typical radar systems (UHF and VHF) that are able to penetrate the vegetating layer. The ability to “see” through foliage canopies makes FOPEN radar a powerful tool for military purposes, in particular, if SAR techniques are used a FOPEN SAR sensor becomes capable to detect, track and recognize vehicles hiding in forests [1].
However, due to the nature of the imaged scene, several issues are still present for the complete and reliable exploitation of such a sensor. In particular, canopies and hidden vehicles are not the only possible reflecting targets in a forest scene; trunks are present and contribute significantly to the intensity of the signal returned to the radar. Reflections from trunks result in detection if an accurate strategy of control of false alarms is not adopted. Solutions or partial solutions to this problem have been provided in literature. In particular, clutter modelling has been identified as a viable solution to mitigate tree trunks detections: physical, statistical and the combination of the two approaches were used to model forest clutter in FOPEN SAR [2], [3], [4], [5], [6]. The models proposed in [2], [3], [4] consider electromagnetic modelling of forests to extract deterministic clutter models. These models are useful in terms of understanding of the scattering phenomenology, but are not applicable in statistical detec-tion frameworks. The model in [5], introduce statistical properties in the model in [3], however this model is not robust with respect to presence of tree trunks dominating a scene.
In [6] a model for VHF clutter generation was proposed, integrating both background scatterers and large-amplitude discrete clutter (trees). Despite the flexibility and the model proposed in [6], unfortunately, it is not available in a closed form and is not suitable to derive detectors with false alarm rate control.
Starting from a statistical modelling of the FOPEN SAR clutter, in this paper we introduce a novel framework for CFAR detection in FOPEN SAR images. In our approach, the clutter is statistically modelled and exploits distributions that belongs to the location-scale family of distributions. The heavy-tailed distributions are used due physical
considerations of the forest scene [1], [6], while the location-scale (LS) family is a requirement of the CFAR detection algorithm [7] that is exploited in this work.
After modelling the forest clutter as location-scale distributed, the CFAR detection algorithm introduced in [8], [9] and applied to high resolution SAR images in [7] can be embedded in a framework that is able to select the best heavy-tailed location-scale distribution to be used to compute the adaptive threshold and that will ensure the Constant False Alarm Rate in the highly inhomogeneous FOPEN SAR image environment.
The reminder of the paper is organized as follows, Section II introduces the multi-Model CFAR detection framework, addressing the specific cases of Gumbel Maximum and Weibull distributed background. The performance in terms of distribution fitting of the two above mentioned models are assessed and discussed in Section III using real VHF FOPEN SAR data. Section IV discusses the CFAR detection algorithm performance analysis on real data, demonstrating the capability of the proposed approach to control the false alarm probability.
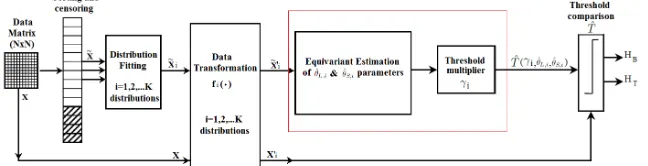
II. MULTI-MODELCFARDETECTOR INLSENVIRONMENT The architecture of the proposed algorithm is detailed, with par-ticular focus on the amendments applied the algorithm in [7] to deal with the specific FOPEN challenge. The selection of this algorithm is motivated by the fact that it is flexible and reliable, allowing different statistical models and using an adaptive threshold setting aimed to control the false alarm probability.
The proposed framework has been designed in order to ensure a major robustness and reliability of the results, with respect to the single model approach performed in [7], by considering K possible statistical distributions of the background. Hence, it has the capability to automatically adapt with respect to the distribution that fits better the real data in a specific reference window, introducing robustness with respect to inaccurate a-priori knowledge of trees density in a spatial window under test.
Its final goal is to perform the binary hypothesis test:
HB :X′
i<Tˆ
γi,θL,i,ˆ θS,iˆ
HT :X′
i≥Tˆ
γi,θL,i,ˆ θS,iˆ (1)
whereHB is the hypothesis of no target present (background only) and HT is the hypothesis of the presence of target,X′
i is the set of
samples associated to i-th selected distribution andTˆγi,θL,i,ˆ θS,iˆ
Figure 1: Architecture of the Multi-Model CFAR system in LS environment.
transformable into LS type. Without loss of generality the caseK= 2
is considered in this work.
The algorithm architecture is illustrated in Figure 1.
• The starting point is a window under analysis, composed of
N×N samples of intensity obtained from the complex SAR image.
• the data are organized into a vectorXthen sorted and censored obtaining the vectorX˜. The censoring consists in the removal ofr(censoring depth) pixels of data with the highest intensity values from the set used to estimate the distribution parameters representing the HB hypothesis. This is required in order to avoid self masking of targets, meaning that the presence of target pixels in the background parameters estimation would lead to a higher threshold that would produce detection misses.
• the statistical characterization of the background starts with the evaluation of the empirical cumulative distribution function (ECDF) of the real censored data. The aim is to find a statistical distribution that fits well the real data. To achieve this goal, a test on the goodness of fit is required. Among the approaches used to verify if a set of data is compatible with a design distributionF(x), in this work the Kolmogorov Smirnov (KS) test [10] is selected. The outcome of the KS test is defined by:
◦ H0: the selected distribution shows a good fit compared to the real data;
◦ H1: the null hypothesis is rejected, hence the selected distribution does not fit well the real data.
For the case in hand, data are extremely inhomogeneous due to the presence of trees in the scenario [6]. Hence, distributions with heavy tail characteristics are required. Several LS distribu-tions have been considered, but for conciseness in this section we discuss only the two distributions that resulted to provide better performance in terms of goodness of fit on real data and that are then exploited in this paper:
◦ the Gumbel for maximum distribution, with CDF
F(x;θL, θS) =exp
−exp
−x−θL θS
with θL∈R θS>0 (2)
which belongs to location-scale family;
◦ the Weibull distribution, with CDF
F(x;κ, λ) = (
1−e−(xλ) k
, ifx≥0,
0, ifx <0.
whose natural logarithm is LS.
These two distributions are particularly suitable for the case in hand as they provide good fitting on the tail and are LS, thus allowing the application of the desired algorithm. Performing a hypothesis test on a statistic, a p-value helps to determine the significance of the results, exploiting a threshold value called
the significance level of the test and denoted as α. In other words, if p-value is equal to or smaller than the significance levelα, it suggests that the observed data are inconsistent with the assumption that the null hypothesis is true, and thus that hypothesis must be rejected and the alternative hypothesis is accepted as true.
Letρibe p-value associated to i-th distributionDi, andαset to
5%, for each reference window the distribution selection rule is:
Di:i= arg max i=1,2,...,K
ρi (3)
• the Multi-Model CFAR algorithm is applied exploiting, for each reference window, the parameters (γi,θL,i,ˆ θS,iˆ ) of the specifici-th distribution. In this work, two kind of background distributions will be analyzed in order to design the CFAR detector, Gumbel for maximum distribution (i= 1) and Weibull distribution (i = 2). If the first distribution belongs to the Location-Scale family, the second one do not. In the latter case, using a log-transformation, the Weibull distribution can be transformed in a log-Weibull distribution, which belongs to the Location-Scale family. For the case in hand the data transformation block follows the following rule:
fi(·) =
1×(·) withi= 1
ln(·) withi= 2 (4)
Thus, the Best Linear Unbiased (BLU) estimates of the Loc-ation and Scale parameters are used to obtain the distribution parameters. By minimizing the variance, subject to the con-straints of unbiasedness, the BLU estimators can be obtained [9] as:
ˆ
θL,i ˆ θS,i
=HTiC−1 0,iHi
−1
HTiC−1
0,iX˜′i (5)
whereHi= (1µ0,i), whileµ0,i andC0,i are the mean vector and the covariance matrix of the standardized vector X˜′
0,i,
respectively. LettingG(m)i be them-th order derivative of the
inverse cumulative distribution function Gi(·) =F−1 i (·), the
approximate expressions of mean and covariance matrix of the ordered samples are [7]:
µ0(k),i≈Gk,i+ pkqk 2(n+ 2)G
(2) k,i+
pkqk (n+ 2)2
× 1
3(qk−pk)G (3) k,i+
1 8pkqkG
(4) k,i
,
C0(k,h),i≈ pkqh (n+ 2)G
(1) k,iG
(1) h,i+
pkqh (n+ 2)2 ×[(qk−pk)G(2)k,iG
(1)
h,i+ (qh−ph)G (2) h,iG
(1) k,i
+1 2pkqkG
(3) k,iG
(1) h,i+
1 2phqhG
(1) k,iG
(3) h,i
+1 2pkqhG
(2) k,iG
(2)
h,i], k≤h
withpk=k/(n+ 1)andqk = (1−pk)andGk,i=G(pk). The moments in (6) can be evaluated with reference to a specific reduced distribution by direct substitution of the derivatives, until the fourth order, of its quantile function (inverse CDF). Let Gi=1(x) be the quantile function associated with the reduced extreme value distribution of type I for maximum (Gumbel for maximum), the set of equations to substitute in (6), and containing the four derivatives under test include:
G1(x) =−ln(−ln(x)) ;
G(1)1 (x) =−
1 x ln(x)
;
G(2)1 (x) =
ln(x) + 1
x2ln2(x)
G(3)1 (x) =−
2ln2(x) + 3ln(x) + 2
x3ln3(x)
G(4)1 (x) =
6ln3(x) + 11ln2(x) + 12ln(x) + 6
x4ln4(x)
(7)
The same procedure has been done for the quantile function associated to the reduced extreme value distribution of type I for minimum (Log-Weibull) and the results are reported in (8).
G2(x) =ln(−ln(1−x)) ;
G(1)2 (x) =
1 (x−1)ln(1−x)
;
G(2)2 (x) =−
ln(1−x) + 1
(x−1)2ln2(1−x)
G(3)2 (x) =
2ln2(1−x) + 3ln(1−x) + 2 (x−1)3ln3(1−x)
G(4)2 (x) =
−
6ln3(1−x) + 11ln2(1−x) + 12ln(1−x) + 6
(x−1)4ln4(1−x)
(8)
It follows that, by using (6) with either (7) or (8), Location and Scale parameters related to the specific distribution under test can be estimated through (5). The adaptive threshold can be computed as:
ˆ
Tγi,θL,i,ˆ θS,iˆ = ˆθS,i( ˜X′
i)γi+ ˆθL,i( ˜Xi′) (9)
However, the evaluation of the adaptive threshold in (9) re-quires also the knowledge of the constantγi, calledthreshold multiplier: this constant is evaluated according to the desired false alarm probability.
The threshold multiplier is the solution of the equation:
PF A=P r (
˜ X′
i−θL,iˆ ˆ
θS,i > γi|HB )
, (10)
which is the(1−PF A)-quantile of the normalized test statistic
(( ˜X′
i −θL,iˆ )/θS,iˆ ). Obviously, if the statistical distribution
of the test statistic is known, then γi can be determined. Unfortunately, this distribution cannot be evaluated in a closed form because it requires the knowledge of the joint distribution of the variableX˜′
i and of the location and scale estimators. In
order to overcome this problem, the value of the quantile γi
has been computed via Monte Carlo simulation,Nprealizations of the test statistic have been generated and the threshold multiplier level has been estimated from the empirical CDF. In order to improve the estimators reliability, a suitable number of trials is needed. Precisely, it has been set toNP ∼=P10F A2 .
Summarizing, once the location and scale parameters have been estimated with (5), and the threshold multiplier, γi, has been computed via Monte Carlo simulation, all the requirements to extract the adaptive threshold in (9) are met.
• the decision rule is applied using the threshold value
ˆ
Tγi,θL,i,ˆ θS,iˆ associated to the specific distribution;
We can conclude that the algorithm automatically adapts with respect to the distribution that fits better the real data in a specific reference window, independently from an a-priori knowledge of trees density. Finally, exploiting the decision rule in (11), which compares each data pixel with the adaptive threshold just extracted
X′
i HT
≷
HB ˆ
Tγi,θL,i,ˆ θS,iˆ (11)
the detection problem can be solved and the detector’s false alarm rate can be assessed.
III. STATISTICAL CHARACTERIZATION OF BACKGROUND: PERFORMANCE ANALYSIS
In this section we present the results obtained in terms of goodness of fit to justify the selection of the statistical distributions for theHB
hypothesis. The dataset used in this work has been acquired using the Swedish low frequency SAR systemCARABAS-II VHF SAR[11]. The system transmits HH-polarized radio waves between 20-90 MHz, corresponding to wavelengths between3.3m and15m. In the imaged areas 25military vehicles are concealed by forest, in four different deployment (for reader’s convenience see [11]). Due to the presence of trees in the scenario, we deal with extremely inhomogeneous data. Hence, we have to consider different distributions, including heavy tailed and also light tailed distributions. Among the several distributions with these features, we have analyzed Log-Normal, Weibull, Extreme Value Distributions, Gamma, as well as more usual distributions like Rayleigh and Normal. However, not all result to provide good fitting with the data. For example, the Log-Normal distribution in low density forest results to be rejected in the42.33%
of the cells analysed. Weibull Distribution and the Gumbel for Maximum Distribution result to provide the best results for low and high density forests respectively. For this reason, and for conciseness of the paper, these two distributions have been selected and the results will be discussed in this section.
In order to analyze the performance of statistical characterization we consider an homogeneous area in forest 1 and 2 from Fredrik and Sigismund set of acquisitions respectively [11]. For these areas, a set of 29×29 reference windows is considered (841 in total), each window is composed of16×16pixels producing a set of256
samples. For each reference window, it is performed a KS test of the area under test to verify the compatibility of data into a cell with a specific distribution. In high density forest cases the Gumbel Maximum distribution is considered, while Weibull distribution is selected for the low density case.
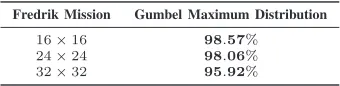
In the high density area the H0 hypothesis has been rejected 12
times, while the Gumbel Maximum distribution fits the data with the percentage of PH0 = 98.57%. For the low density case, the
H0 hypothesis has been rejected 7times; meaning that the Weibull Distribution provide a fit percentage ofPH0= 99.17%.
Table I: KS test outcomes for high density forests: percentage ofH0
hypothesis using Gumbel Maximum distribution.
Fredrik Mission Gumbel Maximum Distribution
16×16 98.57% 24×24 98.06% 32×32 95.92%
Table II: KS test outcomes for low density forests: percentage ofH0
hypothesis using Weibull distribution.
Sigismund Mission Weibull Distribution
16×16 99.17% 24×24 98.06% 32×32 96.64%
Further performances improvement are achieved through the imple-mentation of a multi model fitting approach, as described in Section II.
For the high density case, from a percentage PH0{GU M} = 98.57%ofH0hypothesis associated to the Gumbel Maximum single model, the multi-model approach allows to achieve PH0{M M}= 99.28%. Similarly, in the low density forest case, from a percentage
PH0{W BL}= 99.17%ofH0 hypothesis associated to the Weibull
single model, the multi-model approach provides PH0{M M} = 99.89%.
In conclusion, for each reference window, the combination of Weibull and Gumbel models enable to choose the statistical distribution that fits better the data, providing robustness in the model selection.
IV. CFAR DETECTOR:PERFORMANCE ANALYSIS In this section the performance of the proposed framework in terms of false alarm control and detection are analysed. In order to assess the performance of the CFAR detector, the variation of 3 parameters is considered:
• dimension of the reference window;
• censoringh depth;
• type of statistical distribution.
The CFAR detector requires choosing the dimension of the reference window and the depth of censoring. A reasonable rule is to take the number of samples in the reference window much greater than the maximum expected object dimension and, at the same time, to discard a number of samples that is at least equal to the overall size of the objects.
The algorithm’s efficiency has been tested for different reference windows, censoring depth values and false alarm rates. For reader’s convenience, among all the cases analyzed, the attention will be focused on the flight pass number 1 of each flight mission/target deployment [11] with design PF A=10−4, N = 16 and r =
[0 32 64 96 115 128].
A. False alarm rate performance
The main purpose of this section is to assess the false alarm rate when the designed CFAR algorithm is applied to a specific area within forests1and2, in absence of targets. The single-model CFAR detector for high density forest is performed using a Gumbel for maximum distribution for forest1and Weibull distribution for forest
2.
Considering the same areas used for the distribution fitting, the multi-model approach is also evaluated. False alarm probabilities for single
and multi-model CFAR detector are reported in Tables III and IV, for a nominal false alarm rate equal to 10−4 and for different values of
[image:4.612.106.246.182.224.2]the censoring depth. The estimatedPF Aafter detection is compatible with the design PF A, hence the CFAR property is ensured for both From Table III,PF Avalues are comparable, even if the multi-model approach ensures major robustness, hence a major reliability of the results is obtained. Moreover, in the low-density case (Table IV), the Multi-Model CFAR algorithm achieves better performance in terms of false alarm probabilities then the Weibull CFAR algorithm, for each of the considered censoring depths.
Table III: False alarm probabilities: single-model (Gumbel Max) vs multi-model CFAR detector for various values of the censoring depth.
Censoring Depthr PF AM M PF A GU M
0 5.08×10⁻⁵ 5.55×10⁻⁵
32 6.75×10⁻⁴ 0.97×10⁻⁴
64 1.20×10⁻⁴ 1.20×10⁻⁴
96 2.91×10⁻⁴ 1.66×10⁻⁴
115 1.29×10⁻⁴ 1.99×10⁻⁴
[image:4.612.356.532.331.394.2]128 1.75×10⁻⁴ 2.40×10⁻⁴
Table IV: False alarm probabilities: single-model (Weibull) vs multi-model CFAR detector for various values of the censoring depth.
Censoring Depthr PF AM M PF A W BL
0 5.55×10−05 1.11×10⁻⁴
32 9.25×10−05 3.00×10⁻⁴
64 2.77×10−04 4.53×10⁻⁴
96 1.39×10−05 5.87×10⁻⁴
115 1.39×10−05 4.81×10⁻⁴
128 1.39×10−05 5.97×10⁻⁴
B. Detection Probability Performance
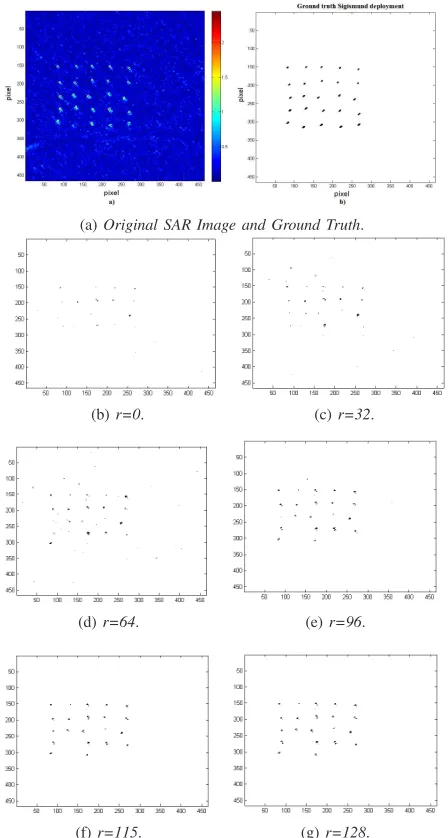
The detection capability of the CFAR detector is performed in an area within forests 1and 2in the presence of targets. Precisely, the Fredrik deployment has been tested in forest 1 while the Sigis-mund deployment has been considered for forest 2. In both cases the performance are evaluated for both the single and multi-model approaches. The single-model CFAR detector performance have been assessed setting thePF Ato10−4and with different censoring depths,
in order to avoid self-masking problem. When no censoring is applied the targets are not detected, due to a self-masking effect of the targets. Increasing r up to 128 samples, the detection capability of the algorithm improves remarkably. Further increasing the depth of censoring does not introduce additional features to the targets detection but, otherwise, generate underestimation of the distribution parameters. In Table V the probabilities of detection for a single -model CFAR Gumbel for maximum detector with PF A set to10−4
are reported along with the probabilities of detection of a multi-model CFAR detector referred to the same area under test. Precisely, they have been extracted with respect to the target ground truth of Fredrik deployment. From the results in Table V, the Multi-Model CFAR algorithm achieves equivalent performance in terms of detection probabilities to the Single-Model CFAR algorithm. In Table VI the probabilities of detection for a single - model CFAR Weibull detector with PF A set to 10−4
Table V: Detection probabilities for a single-model CFAR Gumbel for maximum detector vs multi-model CFAR detector for Fredrik targets’ deployment.
Censoring Depthr PD GU M PD M M
[image:5.612.97.255.101.159.2]0 0.076 0.068 32 0.124 0.122 64 0.170 0.236 96 0.209 0.225 115 0.220 0.221 128 0.233 0.233
Table VI: Detection probabilities for a single-model CFAR Weibull detector vs multi-model CFAR detector for Sigismund targets’ de-ployment.
Censoring Depthr PD W BL PD M M
0 0.045 0.101 32 0.121 0.169 64 0.277 0.281 96 0.396 0.359 115 0.434 0.373 128 0.468 0.397
Empirical Ground Truth.
In these results it can be appreciated that increasingrmore detections are obtained, moreover the capability of the algorithm to detect extended targets as demonstrated in [7] is confirmed.
V. CONCLUSION
In this paper a novel framework for CFAR detection in FOPEN SAR images has been proposed exploiting a multi-model approach. The novel framework exploits a CFAR detection algorithm based on location-scale and heavy-tailed distributions. The proposed framework is able to control the False Alarm Probability in the FOPEN SAR scenario, adapting the best heavy-tailed location-scale distribution fitting the secondary data. The effectiveness of the proposed approach has been demonstrated on real data, demonstrating that the framework able to adapt both the model and the threshold provides a high level of reliability. Future work will deal with the generalization of the statistical model of the background, exploiting the existing relationship between the extreme value distributions and the forest densities.
ACKNOWLEDGMENT
This work was supported by the Engineering and Physical Sciences Research Council (EPSRC) Grant number EP/K014307/1 and the MOD University Defence Research Collaboration in Signal Pro-cessing and the University of Sannio.
REFERENCES
[1] Davis, M. E., Foliage Penetration Radar. Detection and Characteriza-tion of Objects Under Trees, Scitech Publishing, 2012.
[2] Fransson, J., Walter, F., Ulander, L., “Estimation of forest parameters using CARABAS-II VHF SAR data,”IEEE Transactions on Geoscience and Remote Sensing,, vol. 38, no. 2, pp. 720–727, Mar 2000. [3] Smith, G. Ulander, L., “A model relating VHF-band backscatter to stem
volume of coniferous boreal forest,” IEEE Transactions on Geoscience and Remote Sensing, vol. 38, no. 2, pp. 728–740, Mar 2000. [4] Williams, M., Manninen, T., Kellomaki, S., Ikonen, V.-P., Sievanen,
R., Lehtonen, M., Nikinmaa, E., Vesala, T., “Modeling the SAR response of pine forest in Southern Finland,” in Proceedings. 2003 IEEE International Geoscience and Remote Sensing Symposium, 2003. IGARSS ’03., July 2003, vol. 2, pp. 1350–1352 vol.2.
(a)Original SAR Image and Ground Truth.
(b)r=0. (c)r=32.
(d)r=64. (e)r=96.
(f)r=115. (g)r=128.
Figure 2: Original SAR image, Empirical Ground Truth and detection maps for multi-model CFAR detector, for the Sigismund deployment (Forest 2), with various censoring depths, PF A= 10−4
and the cell size to16×16.
[5] Kononov, A. Ka, M.-H., “Model-Associated Forest Parameter Retrieval Using VHF SAR Data at the Individual Tree Level,”IEEE Transactions on Geoscience and Remote Sensing, vol. 46, no. 1, pp. 69–84, Jan 2008. [6] Jackson, J. A. Moses, R. L., “A Model for Generating Synthetic VHF SAR Forest Clutter Images,” IEEE Transactions on Aerospace and Electronic Systems, vol. 45, no. 3, pp. 1138 – 1152, 7 2009. [7] Bisceglie, M. D. Galdi, C., “CFAR Detection of Extended Objects in
High-Resolution SAR Images ,” IEEE Transaction on Geoscience and Remote Sensing, 2005.
[8] Longo, M., Guida, M., Lops, M., “Biparametric linear estimation for CFAR against Weibull clutter,” 1992.
[9] Conte, E., Lops, M., Tulino, A., “Hybrid procedure for cfar in non-gaussian clutter,” IEE Proceedings Radar, Sonar and Navigation, vol. 144, no. 6, pp. 361–369, Dec 1997.
[10] D’Agostino, R. B. Stephens, M. A.,Goodness of fit techniques, Marcel Dekker Inc., 1986.