IETE
T
echnical Review
• V
olume
29
• Issue
5
•
September-October
2012 • Pages
355-???
ISSN : 0256-4602
www.ietejournals.org
Subscriber Copy : Not for Resale
IETETELECOMMUNICATION ENGINEERS THE
INS TIT
UT ION
OF E
LE CT
RO N ICS
AN D
The Institution of Electronics and
Telecommunication Engineers
Technical Review
IETE
The Impact of Mobility Models on the Performance of
Mobile Ad Hoc Network Routing Protocol
Megat Zuhairi, Haseeb Zafar1 and David Harle2
Systems and Networking Section, Universiti Kuala Lumpur, 50250, Malaysia, 1Department of Computer Systems Engineering,
University of Engineering and Technology, Peshawar, Pakistan, 2Department of Electronic & Electrical Engineering,
University of Strathclyde, Glasgow, United Kingdom
Abstract
A mobility model represents nodes distribution and movement over the network. Several research works have shown that a selection of mobility model can affect the outcome of routing performance simulation in Mobile Ad Hoc Networks. Thus, a routing protocol may only be effective in a particular mobility model or sce‑ nario but performs inferiorly in another. As a result, analyses of routing protocol performance are often based on inadequate information leading to inaccurate argument and conclusion. In this paper, three different mobility models have been selected, where each of them is highly distinctive in terms of nodes movement behavior. In addition, a new measurement technique called probability of route connectivity is introduced. The technique is used to quantify the success rate of route established by a routing protocol. Extensive simulation runs are done and results are compared between each mobility model.
Keywords
MANET, Mobility model, Performance, Routing, Simulation.
1. Introduction
A mobility model represents nodes distribution and movement over the network and is used to simulate the performance of routing algorithms in Mobile Ad Hoc Networks (MANETs) [1]. In previous research, it has been shown that the choice of mobility model may be detrimental to the outcome drawn by simulation. The work done in [2,3] clearly shows the impact of mobility models on routing protocols simulation output. Stepanov et al. [4] present the significant impact of realistic mobil -ity models on MANET simulation results. Their research work has shown that a realistic mobility model could substantially affect the output of simulation experiment. In other research work by J. Yoon et al. [5], mobility models in MANETs are categorized into two; synthetic based and traced based. The paper argues that synthetic mobility model may be unreliable, as they are not realistic and represent unhuman‑like movement. On the other hand, trace‑based mobility model relies on the idea of move -ment stability, where nodes move in a regular pattern. For instance, a moving vehicle accelerates and turns, which is dependent on its previous speed and direction. Therefore, sharp turns and sudden stops are not likely to occur.
We evaluate the performance of Ad Hoc on demand distance vector (AODV) [6] routing protocol in a net -work consisting various intensity of unidirectional links against three mobility models; Gauss Markov [7], Ref
-erence Point Group Mobility (RPGM) [8], and Manhat -tan [9], which are widely used in the MANET research community. The presence of unidirectional links may frequently arise, resulting from non‑homogeneous wire -less properties in MANET. In addition, we introduce a new performance metric measurement called the prob -ability of routing connectivity to compute the success rate of route established and the result is analyzed against the link connectivity measurement investigated by C. Bettstetter [10]. The proposed measurement is based on Monte Carlo method [11], where simulation is repeated over a large number of topology samples.
The remainder of the paper is structured as follows. Section 2 presents an overview of the mobility mod -els. Analysis on the impact of mobility models on the performance of AODV routing protocol is presented in Section 3. Probability of routing and link connectivity is presented in Section 4 and Section 5, respectively, and concluding remarks are made in Section 6.
2. Mobility Models
2.1 Gauss Markov Mobility Model
-Zuhairi M, et al.: The Impact of Mobility Models on the Performance of MANET Routing Protocol
less, Gauss Markov model is not particularly common in simulation studies. This is due to its complexity in computation of nodal movement which means it has a larger size model (i.e., trace file) compared with RWP. To define a Gauss Markov mobility model, consider nodes placed in random locations in the network. The node is initially assigned with a mean speed and mean direction to determine future node movement. At every predetermined time interval, the node computes its next movement based on past speed and direction along with different speed to provide certain degree of randomness. The value of speed and direction at the nth instance can be calculated by the Equation (1) and (2):
sn=asn−1 −a s+ −a sxn−
2
1 1 1
( ) ( ) (1)
dn=adn−1+ −a d+ −a dxn−
2
1 1 1
( ) ( ) (2)
The instance of past speed (sn−1) and past direction (dn−1)
at (n−1)th time interval influence the computation of cur -rent speed (sn) and direction (dn) where 0 ≤ α ≤ 1. The
value of α=0 sets the mobility to be completely random, whereas α=1 generate nodes with linear mobility. The parameters s and d are constants representing the mean value of speed and direction as n→ ∞; where sxn−1and dxn−1are random variables from Gaussian distribution. In addition, a node’s next location is calculated based on the current location, speed, and direction of movement. Equations (3) and (4) compute node location at nth time interval based on nodes position at (n-1)th time interval:
xn =xn−1+sn−1cos.dn−1 (3) yn =yn−1+sn−1sin.dn−1 (4)
2.2 Reference Point Group Mobility Model
The RPGM model [8] is based on the analysis that group motion occurs frequently in MANETs. This model may represent the group movement of several rescue teams in a disaster area such as earthquake, where each team movement is directly associated with the group leader movement.
The RPGM is a different entity compared with RWP and Gauss Markov. In this model, individual node movement is influenced by the group movement pattern. Nodes are clustered into groups and their random speed (Vnode(t)) and random direction (θnode(t)) revolve around a pre‑ defined individual reference point, which depends on the group motion vector (Vgroup(t), θgroup(t)). In order to control the deviation value of individual node’s speed and direction, a speed standard deviation (SSD) and angle standard deviation (ASD) must be defined. Thus, the nodes movement can be calculated by Equations (5) and (6) below.
|Vnode| |= Vgroup|+rand SSD V.* * max (5)
|node| |=group|+rand ASD.* *max (6)
The Vmaxis the maximum limit of allowable speed and
θmax is the turning angle for each node.
2.3 Manhattan Mobility Model
In Manhattan mobility model [9], nodes could only move along a predefined paths arranged in a block pattern. It is widely used in simulation for modeling of mobile nodes mobility in a city streets environment. The mobile nodes are assumed to be uniformly distributed with only two directions available to be chosen (either horizontally or vertically). Although this model has high spatial and temporal independence, it has some limitations in that nodes move particularly is a straight line and moving at a constant speed, which is less realistic as compared with Gauss Markov.
3. Analysis on Impact of Mobility Models
For the purpose to investigate the impact of mobility models on simulation outcomes, we use AODV routing protocol with NS‑2 [13] simulation tools. The scheme is evaluated with respect to the three mobility models, where maximum speed of the nodes is set to 0 m/s, 10 m/s, and 20 m/s. The number of source and destina -tion pair is set to 6 and randomly selected from a group of 50 nodes. The selected source nodes transmit data packets at a randomly chosen start time and finishes at 250 seconds of simulation time. In each experiment, a constant bit rate of user datagram packet (UDP) traffic is used and set to be transmitted at a rate of 4 packets/ sec. Each UDP packet is fixed to 512 bytes.
To study the routing performance in network scenarios with different intensity of unidirectional links, we gen -erate 6 combination set, which contains a mixture of nodes assigned with two different levels of Pt. Basically, this method is sufficient to generate varying number of unidirectional links in the network. The two levels of Pt refer to a high‑power nodes assigned with 250 m radio range and low‑power nodes, which is set to 125 m radio range. The RXThresh for both nodes is fixed to 250 m. The MAC parameters are based on Lucent’s Wavelan radio propagation model interface, where the bit rate is set to 11 Mb/s operating at 2.422 GHz frequency.
-mined due to constant node movement, which results in route frequently being constructed and breaks.
To ensure consistency, the same set of protocol configu -ration parameters are used for all sets of experiment in each mobility model, given by Table 2.
3.1 Simulation Results
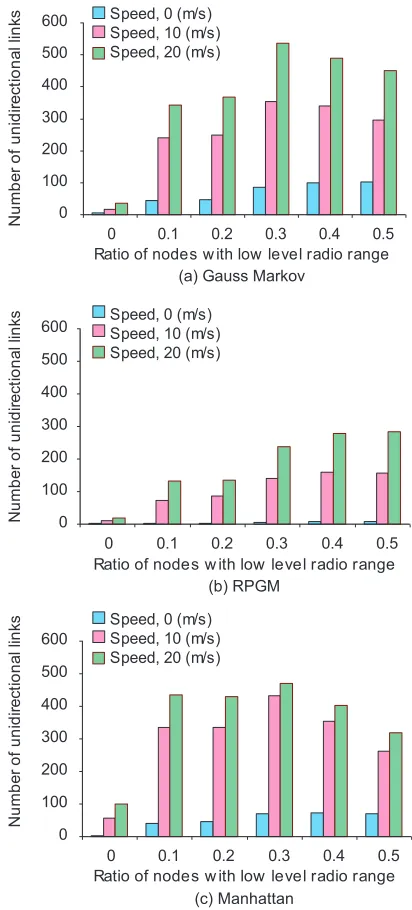
[image:4.612.332.538.228.683.2]We observed the number of unidirectional links gener -ated by AODV and the results show that at higher speed, the probability of unidirectional links occurrences is higher. At higher speed, routes become more unstable and potentially break, leading to unidirectional links. On average, the Gauss Markov mobility model produces more unidirectional links compared with Manhattan and RPGM mobility model. An interesting result which we found is the small existence of unidirectional links shown in Figure 1a-c at node speed of 0 m/s intersecting set 0. This might be caused by packet drop due to severe inter -ference by neighbor nodes. In addition, a high mobility node may also result in frequent link break, causing the routing protocol to interpret them as unidirectional. This is shown by Figure 1c, set 0 with speed of 20 m/s. In addition, there is an interesting observation from Figure 1a and c, where the number of unidirectional links drops at Pt>0.3. The slight drop is due to the fact that the number of RREQ packet sent by the source node decreases, and it indicates that either the routing paths has been successfully constructed, or there exists more bidirectional links in the network than the unidirectional links. In addition, increasing the number nodes with low radio ranges may not guarantee an increase of the
Table 1: Ratio of unidirectional links in each set
Set No. Set
0 Set 0.1 Set 0.2 Set 0.3 Set 0.4 Set 0.5 Number of nodes with low
[image:4.612.55.299.480.526.2]power Pt (i.e., 125 m) 0 10 20 30 40 50
Table 2: Configuration parameters of mobility models
Parameter Gauss Markov RPGM Manhattan
Number of nodes 50 50 50
Speed update frequency 2.5 s Na Na
Angle std deviation 45o Na Na
Speed std deviation 1.5 m/s Na Na
Group deviation Na 2 Na
Number of blocks (x,y) Na Na (5, 5)
Pause time Na 0 s 0 s
Number of groups Na 10 groups Na
Maximum node distance
from grp center Na 100 m Na
Cut off time 0-1000 s 0-1000 s 0-1000 s
The initial phase between 0-1000s is the cut off time. This is essential to avoid results ambiguity, which is commonly associated with non-uniform node distribution at the beginning of simulation [5]; RPGM – Reference point group mobility
Figure 1: The number of unidirectional links generated for each set varies for each mobility model varies. At higher node speed, frequent route breaks may occur and as a result the number of unidirectional links increases.
number of unidirectional link, since other factors such as the behavior of mobility model and nodes speed may also have an impact.
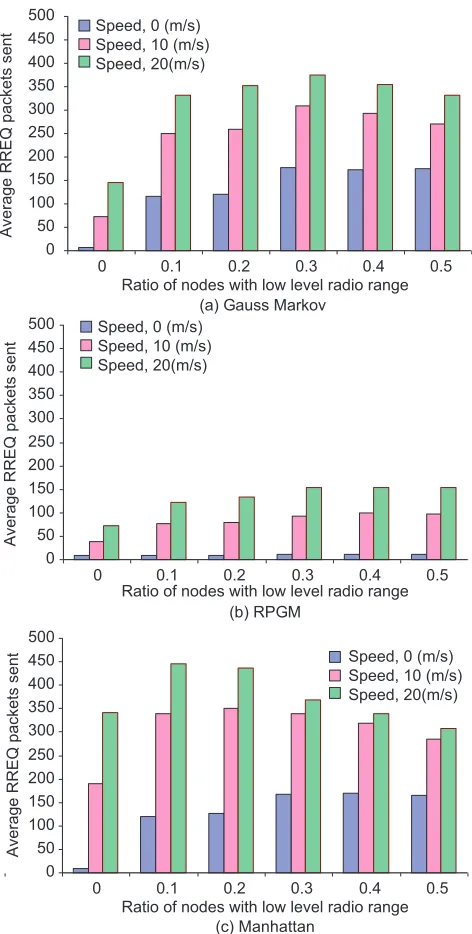
The graphs in Figure 2a‑c show the average number of RREQ packet sent by each source. The RREQ is sent by source at every route discovery and repeated for every failure of route establishment using the expanding‑ring search method. The trend observed in these results is similar to Figure 1, where higher nodes mobility results in more RREQ production. Further analyses on the simula -tion results reveal that more than 90% of routing packets in the scheme is generated by the RREQ packet. As a con
-0 100 200 300 400 500 600
0 0.1 0.2 0.3 0.4 0.5 Ratio of nodes with low level radio range
Nu
mb
er
of
uni
di
re
ct
io
na
l lin
ks Speed, 0 (m/s)
Speed, 10 (m/s) Speed, 20 (m/s)
Speed, 0 (m/s) Speed, 10 (m/s) Speed, 20 (m/s)
Speed, 0 (m/s) Speed, 10 (m/s) Speed, 20 (m/s) 0
100 200 300 400 500 600
0 0.1 0.2 0.3 0.4 0.5 Ratio of nodes with low level radio range
Nu
mb
er
of
un
id
irec
tion
al lin
ks
0 100 200 300 400 500 600
0 0.1 0.2 0.3 0.4 0.5 Ratio of nodes with low level radio range
Nu
mb
er
of
uni
di
re
ct
io
na
l lin
ks
(a) Gauss Markov
(b) RPGM
[image:4.612.55.298.553.695.2]Zuhairi M, et al.: The Impact of Mobility Models on the Performance of MANET Routing Protocol
sequence, the resultant routing overhead of AODV signifi -cantly increases with speed. The routing overhead can be defined by the ratio of total number of routing packets to the total number of data packets transmitted. It measures the efficiency of a routing protocol, the degree to which it will function in congested or low bandwidth environment.
In general, the performance of AODV drops with increas -ing number of nodes set with low radio range, Pt (i.e., set >0). As shown by these figures, the impact of RPGM mobility model on routing performance is minimal, compared with Gauss Markov and Manhattan. Such performance is due to nodes proximity, which restricts movement to within a small area around the reference
point. As a result, link connectivity increases, leading to less unidirectional links occurrences. On the other hand, nodes in Manhattan and Gauss Markov are uniformly distributed. Consequently, nodes are more vulnerable to form unidirectional link.
4. Probability of Routing Connectivity
A new routing performance metric called the probabil -ity of routing connectiv-ity is introduced. The metric measures the number of successfully constructed route over a random set of network topologies. To evaluate the probability of routing connectivity, the network topology of MANET can be typically expressed by undirected weighted graph, G=(V,E), among which V is a set of nodes and E is a set of wireless links. A bidi -rectional link between any two nodes exists if they lie within the transmission radius of each other. Also, the routing path between source and destination can only be set up if there are sufficient links to complete the connection. Since nodes are mobile in the network, E constantly changes over time and therefore performance measurement is not analytically feasible. For this reason, we use the Monte Carlo technique, based on repeated simulation experiment over large number of network scenarios.
At any instance, a set of wireless links in a network sce -nario can be defined as Et. Assuming all nodes (V) have sufficient energy to remain active throughout the simu -lation and they are kept bounded within the network region, the undirected graph at instance t can be given by Equation (7), where Gt is a subset of G.
Gt =( , )V Et (7)
Nodes mobility is an important factor which affects the computation of route construction, where routing paths continuously forms and breaks. For instance, a network scenario in which nodes mobility is not null (i.e., fre -quently mobile), the number of routes established will have to be computed and averaged over several snap -shots. In Figure 3, the mthscenario is equally partitioned with n=25 within 250 s of simulation time. The effective number of route established throughout the simulation is measured 25 times in succession of the mth subset. The value n can be of any real number, and setting n to a higher value may increase results accuracy.
Mathematically, the average success of route construc -tion in a scenario can be expressed by Equa-tion (8).
Et=E E E0+ + + +1 2 ... En−1 (8)
[image:5.612.58.294.58.525.2]To measure the probability of route connectivity, repeated over large set of scenarios, Equation (9) is derived. Figure 2: The number of route request packets sent by source
node increases with respect to speed.
Speed, 0 (m/s) Speed, 10 (m/s) Speed, 20(m/s)
0 50 100 150 200 250 300 350 400 450 500
0 0.1 0.2 0.3 0.4 0.5
Ratio of nodes with low level radio range
Average RREQ packets sent
Speed, 0 (m/s) Speed, 10 (m/s) Speed, 20(m/s)
Speed, 0 (m/s) Speed, 10 (m/s) Speed, 20(m/s) 0
50 100 150 200 250 300 350 400 450 500
0 0.1 0.2 0.3 0.4 0.5
Ratio of nodes with low level radio range
Average RREQ packets sent
0 50 100 150 200 250 300 350 400 450 500
0 0.1 0.2 0.3 0.4 0.5
Ratio of nodes with low level radio range
Average RREQ packets sent
(a) Gauss Markov
(b) RPGM
P
m rc
j m
= =
=
= = −
∑
∑
Ek,jk 0 k n-1)
j (
( )
0 1
(9)
The Prc is the success probability of route connectivity, m is the total number of scenarios, and n is the number snapshots obtained from the mth scenario. A unique case for which n=1 can be simplified by Equation (10) below.
P
E
m rc
j j m
= =
= −
∑
( )( )j 0 1
(10)
Equation (10) is equivalent to a measurement of route connectivity over an average of mth scenario without partitioning.
5. Probability of Link Connectivity
C. Bettstetter [10] presented a comprehensive analysis of link connectivity based on undirected graph. In the paper, a fundamental characteristic of MANET is investigated, which is the minimum node degree essential for multihop communication. Node degree (d) is defined by the number of neighbors associated with a node. In other words, a node with a degree d=0 is an isolated node and therefore has no neighbors. To achieve a fully connected network, the minimum requirement for any MANET is d=1. In this case, all nodes in the network are presumed to be reachable from the source. Analytically, the paper has also derived a mathematical expression to determine the probability of link connectivity, given by the Equation (11).
Plc e
r n
= − −
(1 ρπ2) (11)
The Plc is the probability of link connectivity, ρ is node density, r is node transmission range, and n is the number of nodes in the network.
The simulation result presented in the following subsec -tion will consider only the minimum node connectivity (i.e., d=1).
5.1 Simulation Setup
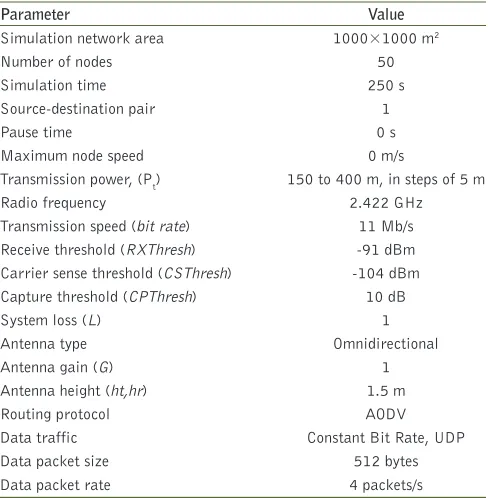
Table 3 shows the configuration setup for the analysis of Prc and Plc. Each simulation is repeated using 500 different scenarios generated from random seeds.
5.2 Simulation Results
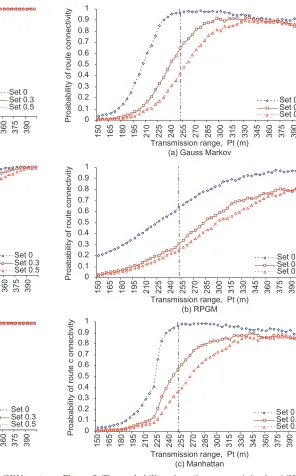
As shown in Figure 4, the Plc differs for each mobility model. In Figure 4a, the Gauss Markov mobility model is able to provide the highest percentage of Plc (80%) for set 0 (i.e., all bidirectional link scenarios) compared with RPGM (38%, Figure 4b) and Manhattan mobility model (70%, Figure 4c). Nevertheless, with the increase
[image:6.612.317.557.68.172.2]of the number of nodes assigned with low Pt, all three models demonstrate a steady decrease in the Plc (set 0.3 and 0.5). This is because reachability of the nodes has been reduced due to unidirectional links pres -ent. As shown by the vertical drop line in Figure 4a (i.e., at 250 m), the Plc drops as much as 37.5% between set 0 and 0.3. Based on the results, it also suggests that at such theoretical transmission range, the presence of all bidirectional links between the neighboring nodes may not guarantee a minimum fully connected network. A further increase in the number of low Pt nodes (set 0.5) has resulted in much lower percentage of Plc, a decrease by almost 76%. In such condition, in order to achieve a value equivalent to the Plc of set 0, the Pt has to be slightly increased.For example, based on the reference line in Figure 4c, a network assigned with set 0.5 will have to increase the Pt by as much as 40 m to gain a comparable performance to set 0 (i.e., at Pt=250 m, Prc=70%).
Table 3: Parameters of simulation scenario
Parameter Value
Simulation network area 1000×1000 m2
Number of nodes 50
Simulation time 250 s
Source-destination pair 1
Pause time 0 s
Maximum node speed 0 m/s
Transmission power, (Pt) 150 to 400 m, in steps of 5 m
Radio frequency 2.422 GHz
Transmission speed (bit rate) 11 Mb/s
Receive threshold (RXThresh) -91 dBm
Carrier sense threshold (CSThresh) -104 dBm
Capture threshold (CPThresh) 10 dB
System loss (L) 1
Antenna type Omnidirectional
Antenna gain (G) 1
Antenna height (ht,hr) 1.5 m
Routing protocol AODV
Data traffic Constant Bit Rate, UDP
Data packet size 512 bytes
Data packet rate 4 packets/s
[image:6.612.315.559.226.475.2]The transmission speed 11 Mb/s corresponds to IEEE 802.11 b
Figure 3: An mth scenario with nodes speed ≠ 0 is captured
with 25 snapshots.
Q Q Q Q Q Q
PWKVFHQDULR
Zuhairi M, et al.: The Impact of Mobility Models on the Performance of MANET Routing Protocol
Based on results, the RPGM offers the lowest connectivity compared with Gauss Markov and Manhattan mobil -ity model. It is also shown that at the nominal Pt (i.e., 250 m), which is used in many commercial outdoor radio interface, the unidirectional links may severely impact MANET communication. Expanding Pt beyond this value increases link connectivity, which is illustrated by these figures. However, such method would only result in channel load increase, an effect that is not desirable.
The results of Prc are shown in Figure 5a‑c. We quantify Prc by the number of successful route established to the number of successful RREP received at the source node. A reception of RREP by the source node indicates that
[image:7.612.252.548.237.713.2]the destination have successfully captured the RREQ packet (i.e., creating forward route) and responded by returning a RREP packet (i.e., creating reverse packet). The two‑way communications denote a successful route establishment.
Figure 5a shows the Prc of Gauss Markov mobility model in 500 different scenarios repeated for nodes Pt diversity between 150 to 400 m. This figure illustrates the precise impact of unidirectional links on routing protocol per -formance compared with the Plc shown in Figure 4a. As expected, the Prc for set 0 nodes show better performance compared with set 0.3 and 0.5. For example, at Pt set to 250 m, a route can be guaranteed to be established in
Figure 4: The probability of link connectivity for AODV rout -ing protocol.
Figure 5: The probability of routing connectivity for AODV
routing protocol. 0
0.1 0.2 0.3 0.4 0.5 0.6 0.7 0.8 0.91
150 165 180 195 210 225 240 255 270 285 300 315 330 345 360 375 390
Proabability of link connectivity
Set 0 Set 0.3 Set 0.5
Transmission range, Pt (m) (a) Gauss Markov
0 0.1 0.2 0.3 0.4 0.5 0.6 0.7 0.8 0.91
150 165 180 195 210 225 240 255 270 285 300 315 330 345 360 375 390
Proabability of link connectivity
Set 0 Set 0.3 Set 0.5
Transmission range, Pt (m) (b) RPGM
0 0.1 0.2 0.3 0.4 0.5 0.6 0.7 0.8 0.9 1
15
0
16
5
18
0
19
5
21
0
22
5
240 255 270 285 300 315 330 345 360 375 390
Transmission range, Pt (m) (c) Manhattan
Proabability of link connectivity
Set 0 Set 0.3 Set 0.5
0 0.1 0.2 0.3 0.4 0.5 0.6 0.7 0.8 0.91
150 165 180 195 210 225 240 255 270 285 300 315 330 345 360 375 390
Transmission range, Pt (m) (a) Gauss Markov
Proabability of route connectivity
Set 0 Set 0.3 Set 0.5
0 0.1 0.2 0.3 0.4 0.5 0.6 0.7 0.8 0.9 1
150 165 180 195 210 225 240 255 270 285 300 315 330 345 360 375 390
Transmission range, Pt (m) (b) RPGM
Proabability of route connectivity
Set 0 Set 0.3 Set 0.5
0 0.1 0.2 0.3 0.4 0.5 0.6 0.7 0.8 0.9 1
15
0
16
5
18
0
19
5
21
0
22
5
240 255 270 285 300 315 330 345 360 375 390
Transmission range, Pt (m) (c) Manhattan
Proabability of route c onnectivit
y
[image:7.612.59.293.237.704.2]483 of 500 trials. In Figure 5b, the RPGM’s Prc is com-paratively small. The Manhattan Prc is almost identical to Gauss Markov at Pt>250 m. Generally, the performance of AODV drops significantly for set 0.3 and 0.5 across all mobility models. On average, the Prc decreases as much 60% between set 0 and 0.5. The considerably low values result from high number of unidirectional links in the network. Consequently, since basic AODV has no uni -directional link detection mechanism, routing path will not be established, resulting in low Prc.
6. Conclusion
This paper made two contributions. First, AODV is ana -lyzed with respect to three difference mobility models to vary the effect of nodes movement pattern on the routing performance. In addition, the routing protocol is evalu -ated under severe link condition, which is unidirectional link. Results clearly show the impact of mobility models on routing protocols simulation output. Second, a new performance metric called probability of route connec -tivity is presented, which measures the success rate of route established in a network. To randomize network topology, different network scenarios are generated with different seed. Extensive simulation is done using Monte Carlo technique to find route success rate. A high probability indicates that a particular routing protocol is reliable and efficient in terms of routes establishment.
References
1. IETF Mobile Ad-hoc Networks (MANET) Working Group, available from: http://www.ietf.org/ [Last accessed on 2011 Nov 18].
2. A. Alshanyour, and U. Baroudi, “Random and realistic mobility models impact on the performance of bypass-AODV routing protocol,” Proc. IEEE/IFIP Wireless Days, Dubai, pp. 1-5, Nov. 2008. 3. J. Ariyakhajorn, P. Wannawilai, and C. Sathitwiriyawong,
“A Comparative Study of Random Waypoint and Gauss-Markov Mobility Models in the Performance Evaluation of MANET,” Proc. International Symposium on Communications and Information Technologies, Bangkik, pp. 894-9, Sept. 2006.
4. I. Stepanov, and K. Rothermel, “On the impact of a more realistic physical layer on MANET simulations results,” Ad Hoc Networks, Vol. 6, no. 1, pp. 61-78, Jan. 2008.
5. J. Yoon, M. Liu, and B. Noble, “Random Waypoint Considered Harmful”, Proc. IEEE INFOCOM, San Francisco, CA, pp 1312-21, Apr. 2003.
6. C.E. Perkins, E.M. Royer, and S. Das, "Ad hoc On-demand Distance Vector (AODV) Routing", RFC 3561, July 2003, available from: http://www.ietf.org/rfc/rfc3561.txt [Last accessed on 2011 Nov 18]. 7. L. Ben, and H. Zygmunt, “Predictive distance-based mobility
management for PCS networks”, Proc. IEEE INFOCOM, New York, NY, March 1999, pp. 1377-84.
8. H. Xiaoyan, G. Mario, P. Guangyu, and C. Chuan, “A Group Mobility Model for Ad Hoc Wireless Networks,” Proc. of the ACM International Workshop on Modelling and Simulation of Wireless and Mobile System, New York, NY, 1999.
9. European Telecommunications Standards Institute (ETSI), "Universal Mobile Telecommunications System (UMTS) - Selection procedures for the choice of radio transmission technologies of the UMTS," UMTS 30.03 version 3.2.0, TR 101 112. 1998.
10. C. Bettstetter, “On the Minimum Node Degree and Connectivity of a Wireless Multihop Network”, Proc. 3rd ACM International
Symposium on MobiHoc, Switzerland, pp. 80-91, June 2002. 11. S. Raychaudhuri, “Introduction to Monte Carlo simulation”, Proc.
Winter Simulation Conference, Dec. 2008.
12. J. Broch, D.A. Maltz, D.B. Johnson, Y. Hu, and J. Jetcheva, “A performance comparison of multi-hop wireless ad hoc network routing protocols”, Proc. Fourth Annual ACM/IEEE International Conference on Mobile Computing and Networking, Dallas, TX, pp. 85-97, Oct. 1998.
13. NS-2: The Network Simulator, available from: http://www.isi.edu/ nsnam/ns/ [Last accessed on 2011 Nov 18].
AUTHORS
Megat Zuhairi is a PhD student within the Department of Electronic and Electrical Engineering at the University of Strathclyde, Glasgow, UK. He received his M.S in Communication Networks and Software from the University of Surrey, UK in 2002 and B.Eng. degree in Electronic and Electrical Engineering from Universiti Tenaga Nasional, Malaysia in 1998. He is a lecturer and a certified Cisco Network Academy Instructor in the System and Networking Section at Universiti Kuala Lumpur, Malaysia. His research interests include computer data networking and wireless mobile ad hoc communications. E‑mail: [email protected]
Haseeb Zafar received the Ph.D. degree in Wireless Mobile Ad-hoc Networks from the University of Strathclyde, Glasgow, UK in 2009, the M.S. degree in Telecommunications and Computers from the George Washington University, Washington DC, USA in 2003, and the B.Sc. degree (with Honors) in Electrical Engineering from the University of Engineering and Technology, Peshawar, Pakistan in 1996. He is a Visiting Researcher in the Department of Electronic & Electrical Engineering at the University of
Strathclyde, Glasgow, UK and an Assistant Professor in the Department of Computer Systems Engineering at the University of Engineering and Technology, Peshawar, Pakistan. His research interests include data communications, computer networks, wireless communications, and mobile ad hoc, sensor, and mesh networks. He has authored and co-authored many research papers in journals of international repute including the IET Communications. He has presented his research work in various international conferences.
E‑mail: [email protected]
David Harle is currently a senior lecturer within the Broadband and optical Networks Group within the Department of Electronic and Electrical Engineering at the University of Strathclyde, Glasgow. He received his Ph.D. in Integrated Telecommunications from the University of Strathclyde in 1990, having previously been a Research Assistant in the same department. His current research interests within the Broadband and optical Networks group focus upon performance evaluation, design, and management issues associated with current and future broadband and optical communication systems. The author of over 100 research papers and undergraduate texts, he is also a member of the IET and IEEE.
E‑mail: [email protected]