Rochester Institute of Technology
RIT Scholar Works
Theses Thesis/Dissertation Collections
9-1-2010
Exploratory analysis of pathogen resistance
responsible genetic elements in two eudicots from
whole genome sequence
Aubrey Bailey
Follow this and additional works at:http://scholarworks.rit.edu/theses
This Thesis is brought to you for free and open access by the Thesis/Dissertation Collections at RIT Scholar Works. It has been accepted for inclusion in Theses by an authorized administrator of RIT Scholar Works. For more information, please [email protected].
Recommended Citation
Exploratory Analysis of Pathogen
Resistance Responsible Genetic Elements
in Two Eudicots from Whole Genome Sequence
Approved: ______________________________
Director of Bioinformatics
______________________________
Head, Department of Biological Sciences
Submitted in partial fulfillment of the requirements for the Master of Science
degree in Bioinformatics at the Rochester Institute of Technology.
Aubrey Bailey
2 | P a g e
Abstract
Agricultural products are becoming more homogenous in order to conform to consumer
expectations. In doing so, they have become a high-risk target for widespread crop failure due to
pathogens or other agricultural maladies. Presented here are a collection of tools and a work-flow
for the wholesale detection and characterization of disease resistance-associated proteins from
whole-genome sequences. These techniques were also adapted for identifying potential miRNA
regulatory sequences.
Putative R-gene sequences identified from the Malus x Domestica 'Golden Delicious'
genome were acquired for verification against wild apple species. Resistance gene analogs were
PCR amplified from R-gene associated domains (TIR, NBS, and LRR) in wild apple cultivars.
Known R-gene sequences were clustered alongside the PCR analogs and putative R-genes from
'Golden Delicious'.
A covariance model approach for the de novo detection of 3,187 putative pre-miRNA
regulatory sequences is also explored. Vitis vinifera sequences used to build this model were
retrieved with 38% efficiency.
Computational clusters may be useful in the physical mapping of sequences to the
chromosomally duplicated gene clusters characteristic of R-genes. Known R-genes included in
computational clusters may also clarify the function of the unknown sequences. A possibility
exists for the identification of resistance genes that have been lost in the selective breeding of
3 | P a g e
Thesis Committee Members:
Thesis advisor:
Dr. Sandra Connelly
Assistant Professor,
School of Biological and Medical Sciences, Rochester Institute of Technology
Thesis committee members:
Dr. Angela Baldo
Computational Biologist U.S. Department of Agriculture
Cornell University
Dr. Michael Osier
Associate Professor, Director of Bioinformatics School of Biological and Medical Sciences,
Rochester Institute of Technology
Dr. Gary Skuse
Professor, Department Head
4 | P a g e
Acknowledgments (in no particular order)
Kevin and Virginia Bailey, Muriel Hykes, and Paul Shuch – thanks for all the fish
Bryn, Devin, Ariel, Curran, Adam, and Erin – for motivating me in your own way
My teachers and professors, especially those who served as advisers and committee members –
for keeping me on track and my education up to this point
All of my friends and colleagues, especially my editor, April
Eighth grade ISCS – for teaching me to be comfortable in a laboratory
Camp Dittmer – for housing and feeding me summer 2009
The Internet – for all of its research and distractions
God – for everything. Literally.
Angela Baldo, Gennaro Fazio and the rest of the NYS-ARS and USDA – for a summer of
employment, the roots of this thesis and all of my data.
Cornell University – for their journals and IT resources
RIT – for a wonderful education and six years of adventure
Williamsport Area School District – for a good launch at college
The Town of Elimsport, esp. EUMC – for a stable foundation that has never changed
and Haley, my loving fiancée
5 | P a g e
Table of Contents
Abstract ... 2
Thesis Committee …... 3
Acknowledgments... 4
Table of Contents …...5
1. Introduction ... 6
1.1Overview ... 6
1.2 The Problem ... 6
1.3 Biological Background ... 9
1.4 Organisms of Interest …... 16
1.5 Computational Background …... 20
1.6 Hypotheses ……….. 23
2. Materials and Methods ... 24
2.1 Overview ... 24
2.2 Sequence Resources ... 25
2.3 Tools ... 27
2.4 Work Items ... 31
2.5 Failed Attempts …... 37
3. Results ... 39
3.1Sequence Cleaning and Verification …... 39
3.2 Alignment of sequences …... 40
3.3 Hierarchical Clustering ... 43
3.4 miRNA prediction ... 45
3.5 Collaborative Results ... 45
4. Discussion ... 46
4.1 Clustering of RGA domains ... 46
4.2 miRNA Prediction Comparison ... 47
4.3 Covariance Models in Gene Prediction ... 47
5.Conclusion ... 49
6. Supplemental Materials 6.1 Appendix A – Perl Modules Utilized ... 50
6.2 Appendix B – Index of terms and figures …... 51
6 | P a g e
1. Introduction
1.1 Overview
The field of genomics is one of the core competencies of a bioinformaticist. Complete
genome sequences and their associated data are being produced at an exciting rate, and that
speed is increasing. As the machinery for sequence production hits its stride in the industry,
better and more tailored algorithms are required to find regions of interest within this sea of data.
Genomically interesting regions may be genes, gene groups, and sequences regulating the
expression of those genes. Increasingly the lesson is being learned that it is not so much the gene
that is used, but how and when it is used. These genes and regulatory regions have been found to
be capable of expressing such facets of organism development as the shape, color, position,
number and protruding angle of appendages. (Harfe 2005)
High-level computational techniques such as machine learning should be embraced to fill
the role of genomic sequence identification. This category of algorithms can discern a pattern
responsible for a gene or its regulation from representative sequences of interest, rather than
requiring a researcher to find this pattern first. (Eddy 1998)
1.2 The problem
As our global society becomes more pressed for the biologically affected resources of
land, food, and water, the demand for efficiency in biological products stands to increase as well.
The most common and domestically visible of biological products are those of the agricultural
sector. The U.S. is the single largest national contributor to the global agriculture industry. Plant
agriculture alone comprises nearly 1% of the United States GDP. (Dimitri 2005) This position
7 | P a g e
significantly more production per land area than competitors. This edge has been further honed
through certain compromises in the industry. Synthetic fertilizers, monoculture and pesticide use
have helped to raise production rates dramatically but come with significantly negative
ecological impacts. Because of these ecological impacts many of these practices are being
deconstructed as ―unsustainable‖ and are being economically penalized through fines, taxes,
negative media attention, or even outright banned in vulnerable locations such as those near
wetlands.
While synthetic fertilizers and pesticides have their roots in the field of Chemistry, crop
monoculture comes as a result of biological and business processes. Monoculture is the
technique of focusing complete attention on a single product to the exclusion of all others. This
can be likened to the Henry Ford‘s assembly line business-model of producing only one type of
car. It allows for specialization in quantity far beyond normal methods at the cost of diversity and
flexibility.
Fortunately for farmers, consumers in the U.S. hold a certain fondness for the assembly
line model and have expressed through their purchasing patterns that certain varieties, or
cultivars, are preferred above all others. Iceberg lettuce, Portobello mushrooms, Haas avocados,
navel oranges, Golden/Red Delicious apples, Concord grapes, and sweet corn have all benefited
from the unflinching loyalty of their consumer base. Because of their popularity among
commercial producers these varieties have become known as ―commercial cultivars‖.
Commercial cultivars are usually selectively bred for traits such as size, shape, texture,
taste, color, and ease of preparation (seed-less, cling-free stones, etc.) as these are characteristics
on which consumers base their purchases. In a classic case of 'you get what you ask for', the
8 | P a g e
are ones that are not visible to consumers such as nutrient usage, weather tolerance, and disease
resistance. While nutrient use and weather tolerance are modifiable characteristics in plants, with
many options available to the farmers, the third choice, disease resistance, is less so.
The real danger of crop monoculture lies in the inherited basis for disease resistance that
is more strongly represented in plants than metaphyta. Many of these commercial cultivars are
reproduced clonally, by splitting off part of the living plant and rooting it elsewhere. Others are
only permitted to self-polinate or to be pollinated by members of their genetic lineage. This leads
to an extremely homogenous population, which is good for producer and consumer expectations,
but also good for viral and microbial expectations. (Buddenhagen 1977) If all descendants of a
commercial cultivar are closely related then it stands to reason that a virus or mold capable of
successfully infecting one individual will rapidly infect an entire harvest.
There exists a significant history of sweeping pathogenic destructions in mass-produced
crops such as the 1850's Irish potato famine and the Phylloxera plague that nearly eradicated
European Vitis vinifera (wine grape) cultivars at the end of the 19th century. These are precedents
for multi-billion dollar damages to U.S. agriculture from currently low impact diseases for which
commercial cultivars may widely lack resistance.
As a business practice, monoculture is far too successful to be warned against to any
effective measure, but as scientists we can identify disease risks and potentially modify these
commercial cultivars to be resistant against such incursions. As the demand for agricultural
products and global population continue to rise, so will high yield techniques. Industrial
producers are acutely aware of the risk of pathogen-induced crop losses and even using modern
techniques it is estimated that disease claims between 5 and 10% of any given agricultural yield
9 | P a g e
resist these losses. Improvements in this field would also help to offset the over 22 million acres
of land that were chemically treated as a preventive measure against these diseases in 2007 (2007
USDA Census of Agriculture, pg 59).
Genomic investigation of agriculturally significant organisms for genetic elements and
molecular markers is not only economically advantageous and environmentally responsible, but
also scientifically feasible for the small (~500Mb) genome sizes in question. Through
comparison to the markers identified in commercial cultivars and their wild relatives, selective
breeding initiatives can ensure that disease resistances are not lost or are reincorporated in the
process. The assessment of inherited risk factors and their appropriate responses must be
performed now before such a pandemic can be allowed to occur.
1.3
Biological Background1.3.1 Plant immune response
Plants respond to pathogenic or otherwise stressful stimuli differently from metazoans.
Disease resistance and abiotic stress response is inherited through genomically encoded signaling
cascades rather than the mobile immune
response of t-cells and antibodies common to the
animal kingdom. Genes coding for the initial
recognition of pathogenic factors and the
corresponding catalysis of the plant's response are
known as R(resistance)-genes. R-genes
usually code for extracellular or
transmembrane proteins, usually
[image:10.612.154.530.473.681.2]10 | P a g e
responsible states. These proteins then trigger a variety of immune responses dependent on the
detected state. (DeYoung & Innes 2006) Plant immune responses are frequently extracellular
messages that warn the uninfected cells of the organism to take action. Sometimes the response
is the localized, hypersensitive response: apoptosis of the infected cell to prevent further spread
of the disease. This response is contained within each somatic cell as detection, rather than
through a coordinated mobile defense (t-cells). Plant resistance genes typically occur in clusters
and may account for as much as 2% of the protein-coding genes in Arabidopsis thaliana. These
clusters are thought to be the results of linkage-groups of R-genes during ancestral chromosomal
duplication events. (Yin 2004)
Like most classes of genes, R-genes share similar motifs used for pattern recognition and
signal transduction. In plants some common elements are the TIR (toll/interleukin receptor),
which is similar to NOD (nucleotide-binding oligomerization) in mammals, and LRR
(leucine-rich repeat) domains terminal of an NBS (nucleotide-binding-site) domain. (Michelmore 1998)
By examining genes that are known to have these domains, and other known R-genes from
evolutionarily related species, researchers have produced computational models for the
identification of potentially novel R-genes as well as homologous forms of known genes in
11 | P a g e
12 | P a g e
1.3.2 Protein Domains
Protein domains are portions of a protein sequence between 25 and 500 amino acids in length,
usually around 200. Domains are usually self-stable despite attachment to the rest of their
associated protein. As such, domains mutate, act, and are selected pseudo-independently of the
rest of the molecule. The TIR, NBS and LRR domains are distinguished from other domains
through their involvement with the plant immune response. (Yin 2004) While the individual roles
of each domain are poorly understood, their involvement in the process is well-documented.
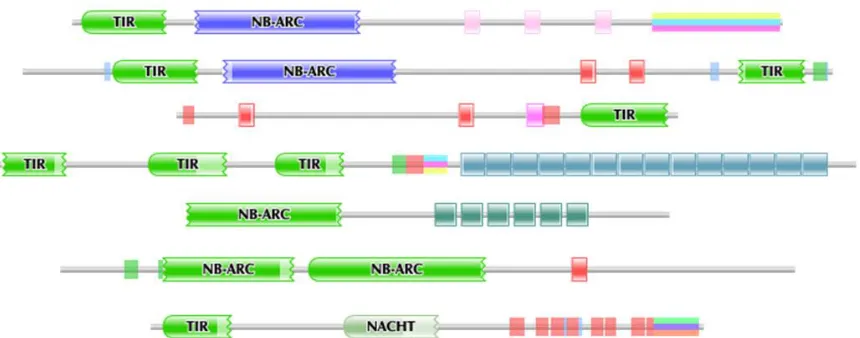
While all NBS-LRR-class gene products contain an NBS domain, the presence of the TIR
domain seems to be optional and the number of LRR repeats is highly variable (Figure 3).
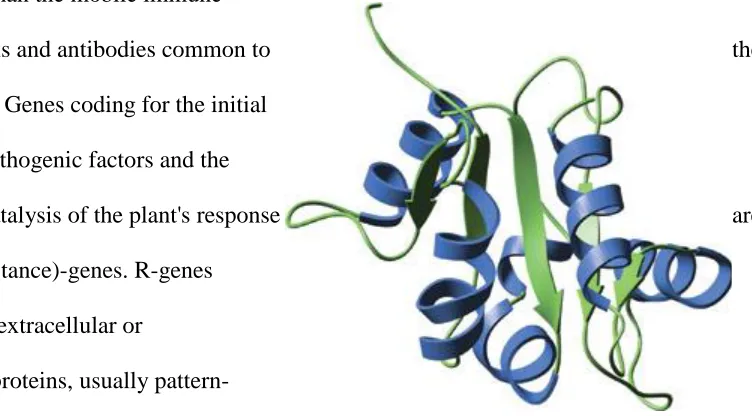
The TIR domain (Illustration 1) is part of the Toll-like receptor (TLR) family and
functions as a pattern recognition receptor. (Werling 2009) This domain is membrane-spanning
and non-catalytic. TIR domain interactions between receptors and adapters play a key role in
activating conserved cellular signal transduction and receptor signaling mediation pathways in
response to bacterial LPS, microbial and viral pathogens, cytokines and growth factors. (Xu
[image:13.612.83.513.356.525.2]2000) The central NB-ARC (Figure 4) domain in R-proteins has been proposed to function as a
13 | P a g e
molecular switch that, depending on the
nucleotide bound defines the activation state
of the R-protein.
The NB subdomain is the catalytic core of a
functional ATPase domain, and its
nucleotide-binding state is proposed to
regulate activity of the R-gene product.
The LRR is a versatile binding motif
that is particularly rich in hydrophobic
leucine amino acids. Each LRR repeat is 26-29 residues in length and forms a
―horseshoe-bent-spring-shaped‖ structure of external helices and internal sheets. Collections of these repeats can
form structures that are extremely flexible in terms
of accommodating rapidly changing and diverse
protein-protein interactions. (Hillig, RC. 1999) The
TLR domain includes as many as 10 such repeated
subdomains consecutively. (Figure 5) The protein
family database (Pfam) maintains an annotated
collection of such structures, multiple sequence
alignments, and profile HMMs for each of these
functional domains.
1.3.3 miRNA regulation
[image:14.612.78.433.73.283.2]Identifying the presence or absence of an R-gene in the genome of a cultivar is not
Figure 5: The curved leucine-rich repeat region of Toll-like receptors, represented here by TLR3. A versatile binding motif.
[image:14.612.321.547.411.600.2]http://commons.wikimedia.org/wiki/File:TLR3 _structure.png
14 | P a g e
sufficient to determine its phenotypic expression. A genomically coded, transcribed sequence can
be silenced post-transcriptionally by non-coding regulatory elements. For example, many avian
species have the genes responsible for the generation of tooth-like structures, but lack teeth due
to silencing by untranslated regulatory sequences. (Phillips 2008) To conduct a thorough study of
R-genes it is necessary to search genomic sequences for evidence of such post-transcriptional
regulatory elements.
At the start of the Human Genome project, it was believed that there would be close to
100,000 protein-coding genes identified at its completion. In the current literature there are now
predicted less than 25,000 protein-coding genes. This frustrated researchers for several years into
wondering what they were doing wrong. Regions previously discarded for not conforming to the
traditional notion of a genetic element are now being reexamined for transcription as regulatory
elements such as small interfering RNA (siRNA) and miRNA. (John 2004)
miRNA are small (~22nt), highly conserved, nucleic sequences. These short sequences
bind with stringent complementarity to mRNA transcripts, usually in the 3' UTR. Once bound,
miRNA affect expression of their target, usually by silencing it via miRNA directed cleavage.
Pre-mature, ―stem-loop‖ miRNA are formed from hairpin-like structures created as the result of
single stranded base-pairing in primary transcripts. This means that a reverse complementary
sequence (or some degenerate form of one) resides up or downstream of the site of a mature
15 | P a g e
Most miRNA genes have similar characteristics to genetic elements such as promoters,
repressors and intergenic regions. Like most RNAs, miRNA also undergo some form of
post-transcriptional splicing in their single-stranded state in order to attain their active geometry.
(Figure 6) Unlike most genes and mRNA, miRNA primary transcripts are usually polycistronic,
containing multiple discrete loops which will each go on to affect a different target. Enzymes
including Dicer and the miRISC play important roles in the maturation of the transcribed
[image:16.612.94.510.71.495.2]miRNA, and the facilitation of interaction between it and its target. The exact mechanisms are of
16 | P a g e
this process are the subject of an astounding amount of research but are currently poorly
characterized. (Krol 2004)
Such miRNA systems are being hailed as one of the key elements of eukaryotic genomic
regulation and are thought to be the answer to many of biology's unanswered questions regarding
organism level control and development. miRNAs play a paramount role in sequence specific
intracellular and extracellular expression modulation, both down (silencing) as well as up
(silencing a repressor). The physiological effects of miRNA regulation are observed in cellular
differentiation, apoptosis, proliferation, metabolism, hematopoiesis, limb morphogenesis and
other developmental patterning. (Chen 2004) Plant miRNAs are high-level regulators of gene
expression. Mutants impaired in miRNA biogenesis exhibit severe abnormalities across diverse
gene-groups. Similarly, plants that over-express particular miRNAs or express miRNA-resistant
versions of particular miRNA targets exhibit a wide array of unusual phenotypes.
(Jones-Rhoades 2006) The flexibility, specificity, and robustness of microRNA systems are such that
they are being recognized for their role in extracellular as well as organism-level modulation,
possibly including a method of systemic response to R-gene activation.
1.4 Organisms of interest
Currently eight whole-genome-sequences for plants have been completed and published
and more than 50 are in progress. Most of these sequencing efforts are focused on commercial
cultivars. Because of these efforts we are given a window into plant biology that makes specific
characterization and study of commercial cultivars possible. Identifying the genetic bases for the
phenotypes of interest is the first step in understanding and improvement.
1.4.1 Family Rosaceae
17 | P a g e
agriculturally significant herbs, shrubs, and trees including apples, pears, raspberries,
strawberries, peaches, plums, cherries, almonds, and of course roses from which the family
draws its name. This family is well represented both agriculturally as well as scientifically in
terms of the amount of data available in major repositories from several members of the family.
Spirally arranged, serrated leaves, brightly colored flowers, and a wide variety of fruit from
which it draws its astounding agricultural representation, characterize the family. (Shulaev 2008)
In the U.S. over $7 billion of rosaceous crops are produced yearly with projections to expand
especially in the global market. (Slovin 2006) Many crops in this family are reproduced clonally,
by grafting. This makes them good targets for study as well as high-risk targets for pathogenic
agents. Among these, the apple (Malus domestica) holds special representation for its current
status of having the most genes of any studied plant genome at 57000. (Velasco 2010) By tons
produced, it is also the most widely cultivated of any rosaceae. An Italian agricultural research
institute, IASMA, is close to finishing the Malus domestica x GD (Golden Delicious apple)
[image:18.612.72.496.529.657.2]genome and has provided some advance R-gene-candidate sequences for this project.
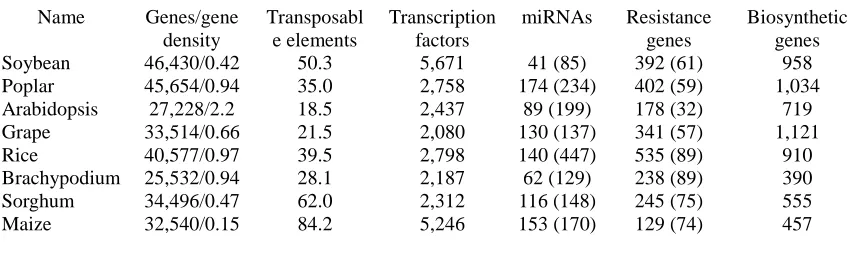
Table 1: Comparison of the apple genome to other sequenced plant genomes
Velasco et al. Nature Genetics (8/2010) | doi:10.1038/ng.654
Name Genes/gene density
Transposabl e elements
Transcription factors
miRNAs Resistance genes
18 | P a g e
1.4.2 Vitis vinifera
Genus Vitis is also agriculturally significant. This genus contains all grape species from
common edible varieties like 'Concord' and 'Cabernet Sauvignon', to inedible ones such as the
experimental 'Pixie' and fox grapes. Most of the grapes grown in the U.S. are table grapes;
however the U.S. also exports over $1 billion of wine annually. Globally this is about 6% of
market share, but as European countries lose ground and Prohibition-era laws are repealed, that
number stands to grow significantly. (Brunke 2003)
Vitis vinifera is the most cultivated and economically important grape species. Grapes are
not only consumed fresh but also processed in making juice and wine. Though new cultivars of
grapes have been developed over last few decades, their introduction into the market has been
difficult because of strict regulations governing the propagation of varietals and their
modification. For this reason, study rather than modification of these cultivars is an appropriate
course of action so that pathogenic consequences can be understood and prepared against.
V. vinifera is a diploid plant with 2n = 38 chromosomes. It has a comparatively small
genome of about 500 Mb which makes genome analysis feasible. Large scale ESTs are already
available for V. vinifera. The Pinot Noir grape, Vitis vinifera L. cv. Pinot Noir has two complete
genome sequences that are published and available, one with 8x (Table 2) (Refseq Project ID:
33471) and one with 12x coverage. The 8x sequence is directly comparable to the sequencing
19 | P a g e
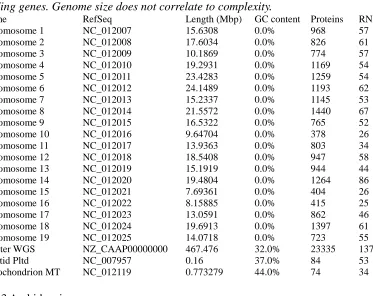
Table 2: Genome statistics for Vitis vinifera L. cv. Pinot Noir (Refseq Project ID: 33471). Although the genome is much larger than A. thaliana there is a comparable number of protein-coding genes. Genome size does not correlate to complexity.
Name RefSeq Length (Mbp) GC content Proteins RNAs
Chromosome 1 NC_012007 15.6308 0.0% 968 57
Chromosome 2 NC_012008 17.6034 0.0% 826 61
Chromosome 3 NC_012009 10.1869 0.0% 774 57
Chromosome 4 NC_012010 19.2931 0.0% 1169 54
Chromosome 5 NC_012011 23.4283 0.0% 1259 54
Chromosome 6 NC_012012 24.1489 0.0% 1193 62
Chromosome 7 NC_012013 15.2337 0.0% 1145 53
Chromosome 8 NC_012014 21.5572 0.0% 1440 67
Chromosome 9 NC_012015 16.5322 0.0% 765 52
Chromosome 10 NC_012016 9.64704 0.0% 378 26
Chromosome 11 NC_012017 13.9363 0.0% 803 34
Chromosome 12 NC_012018 18.5408 0.0% 947 58
Chromosome 13 NC_012019 15.1919 0.0% 944 44
Chromosome 14 NC_012020 19.4804 0.0% 1264 86
Chromosome 15 NC_012021 7.69361 0.0% 404 26
Chromosome 16 NC_012022 8.15885 0.0% 415 25
Chromosome 17 NC_012023 13.0591 0.0% 862 46
Chromosome 18 NC_012024 19.6913 0.0% 1397 61
Chromosome 19 NC_012025 14.0718 0.0% 723 55
Master WGS NZ_CAAP00000000 467.476 32.0% 23335 1374
Plastid Pltd NC_007957 0.16 37.0% 84 53
Mitochondrion MT NC_012119 0.773279 44.0% 74 34
1.4.3 Arabidopsis
Arabidopsis thaliana is a small flowering plant of the mustard family, brassicaceae, with
the smallest and most investigated plant genomic sequence to date. A. thaliana is a diploid plant
with 2n = 10 chromosomes. It became the first plant genome to be fully sequenced based on the
fact that it has a small genome of ~120 Mb with a simple structure having few repeated
sequences. Its short generation time of six weeks from seed germination to seed set and its large
number of seeds have facilitated its adoption as the model organism of plant molecular biology.
Though of no economic importance, it is an invaluable resource to agriculturally important
crops, particularly to members of the same family, which includes canola, an important source of
vegetable oil. Its full sequence is readily available and is frequently compared in most plant
20 | P a g e
[image:21.612.72.550.140.256.2]miRNAs are germane.
Table 3: Arabidopsis thaliana - The Arabidopsis Information Resource (TAIR9) Statistics showing a comparison of well characterized protein and miRNA genes in a small genome.
Chr chromosome
length (bp)
Protein
coding pre-tRNA rRNA snRNA snoRNA miRNA
Other RNA
Pseudo genes
TE
genes Total
1 34,964,571 7,054 240 0 2 18 52 107 242 683 8,398
2 22,037,565 4,237 96 2 0 15 29 75 218 825 5,497
3 25,499,034 5,436 93 2 7 15 29 67 201 878 6,728
4 20,862,711 4,214 79 0 0 11 28 48 121 711 5,122
5 31,270,811 6,318 123 0 4 12 36 53 144 804 7,494
All 134,634,692 27,169 631 4 13 71 174 350 926 3,901 33,239
The theory of evolution posits that organisms share common ancestors. It follows that
these organisms also share common genes. For this reason research in one organism is at least
partially relevant to any related organism. The process of locating these shared sequences is a
discipline known as 'homology searching', so-called for the technique's assumption of
evolutionary relatedness between species. Known R-genes can be located across classes and
families of agricultural significance in seconds using this technique, but a set of caveats comes
with such extrapolations.
1.5 Computational Background
Gene sizes are measured in hundreds to thousands of bases, while genomes are measured
in hundreds of millions to billions. A. thaliana, the current smallest green plant genome still has
in excess of 100 million nucleotide pairs in its genome.
Traditional computational techniques were suited to this scale of data, but not complex
enough to address the irregular and seemingly whimsical nature of biological features. To
address these problems brand new classes of algorithms were created using probabilistic models
and non-linear mathematics. These solutions rely on high quality biological observations and
21 | P a g e
evolutionary past. One of the most preeminent of these algorithms is a method for finding an
inexact match of one sequence inside of a second longer sequence.
1.5.1 BLAST
Computers have been easily able find an exact match between two strings of characters;
however, genomic sequences are known to change over time. This means that related sequences
will seldom match one another perfectly. The current solution is known as a 'local alignment',
and the de facto standard is the Smith Waterman algorithm, most famous for its implementation
in BLAST, the Basic Local Alignment and Search Tool. BLAST can pull any number of
needle-like objects from a genomic haystack within a matter of seconds and some iterations even
include rules for the likelihood that different types of changes occurred evolutionarily. It presents
the user with a ranking of how closely each ―hit‖ matches the queried sequence. Because
genomes are so large there exists a chance that arbitrary sequences will bear coincidental
resemblance to a shared sequence that in reality is not derived from a common ancestor. This is
controlled for through a statistic known as an expected-value (e-value) that represents the chance
that an arbitrary match of the queried sequence was presented as a result. (McGinnis S., &
Madden T.L. 2004) Even using these controls there is no guarantee that finding a sequence
similar to a known one is meaningful. No sequence is completely independent of other biological
features, such as morphology, which contribute substantial knowledge to conservation.
1.5.2 T-COFFEE
Once multiple hits have been established, comparing those sequences side by side is a
logical step. A second class of algorithms, known as MSA, or multiple sequence alignment, fills
this role. The currently favored implementation is known as T-COFFEE. T- COFFEE compares
22 | P a g e
an alignment. If the sequences that are being aligned were likely to return many hits, such as
searching for all sequences in a genome that have loose resemblance to the TIR domain, then the
alignment might have thousands of sequences to work with and require months to complete.
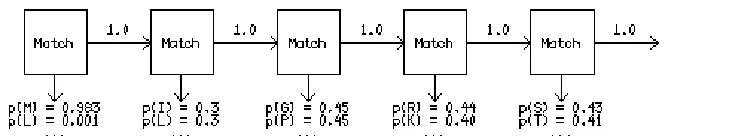
1.5.3 Profile Hidden Markov Models
One of the crowning achievements of computational biology steps in here. Profile Hidden
Markov models (Figure 7) are a statistical construct bordering on machine learning. Profiles are
constructed from consensus among a set of representative sequences, such as a small handful of
properly aligned sequences bearing a domain of interest. From this data the method models the
statistical probability of changing from one state (amino acid residue) to the next in a chain of
events, or sequence. Part of each of the two major HMM sequence suites, HMMER (Eddy SR.
1998) and SAM, (Hughey, R. and Krogh, A. 1995) is the ability to align sequences to a model.
This is significantly faster (arithmetic over geometric) than aligning the sequences to each other
because there is only ever one sequence at a time being aligned to the model. Such models can
also be used to score entire chromosomes for regions conforming to their profile. This has
become a standard for the prediction of previously uncharacterized genes or other sequences of
interest.
1.5.4 Hierarchical Clustering
[image:23.612.140.515.222.290.2]Even with a quality MSA, composing sequences may be located many sequences away
Figure 7: Basic form of a Markov probability chain showing transition probabilities between the various states of statistical recsidence.. Hidden Markov models make no assumption of
23 | P a g e
from their closest relatives. A phylogenetic estimation can infer evolutionary relationships from
differences between aligned sequences. The fewer the number of permutations, the more related
the sequences are likely to be. These same techniques can be used as a form of biologically
sensitive clustering. This is desirable if sequences of a known function are included as part of the
distance estimation because their collocation in clusters with unknowns predicates similar
sequence and hence a likely similar function. A package of tools for garnering phylogenetic
inferences is Phylip. (Felsenstein, J. 2005)
One of the most time consuming and robust features of the Phylip package is its ability to
jumble a data set and perform the same calculation multiple times. This is akin to performing
hundreds of the same wet-laboratory experiment. While a significantly different outcome is not
expected, it closes the door on irregular circumstances. Phylip attains this through a method
known as 'bootstrapping'. The multiple data sets generated in this fashion have the option to carry
their results through each of several associated programs; distance matrix calculation, phylogeny
estimation, and tree construction. Ultimately the assembled clusters produced bear significant,
high-quality evidence of their intra-relation. (Wang 1998)
1.6 Hypotheses
By identifying R-gene associated sequences we can create markers for selective breeding
or transfect commercial agricultural products with the missing or reactivated versions of genes
that their more hardy relatives possess without having to alter existing processes or expectations.
Here it is hypothesized that some NBS-domain-bearing RGAs identified in wild cultivars
will cluster more closely with NBS-domain bearing sequences from the IASMA identifications
than other arbitrary matches within the same organism. Furthermore, it is conjectured that there
24 | P a g e
may be found through homology searching of known RGAs against genomic sequence or ab
initio prediction of many putative miRNAs from genomic sequence and their subsequent
comparison to V. vinifera R-genes.
2. Materials and Methods
Presented here are the tools and techniques used to design in silico experiments for the
detection and characterization of large quantities of unknown sequences with a high likelihood of
being involved in agricultural crop disease resistance and abiotic stress response. Through the
combined use of these methods, clusters of sequences have been elucidated from genomic
sequence.
2.1 Overview
All of the work that follows extends from at least one of the five (Geneva, Rose, IASMA,
V. vinifera, and miRNA) sets of data described herein. The first set, collectively known under the
topographical moniker 'Geneva', was a collection of degenerate PCR primer results from wild
apple germplasm at the Geneva, NY ARS. This set represented empirically derived Malus
R-gene analogs (RGAs). This set was conceptually translated into AAs and later became a subset of
a larger collection of RGAs gathered from the NCBI representing the entire family Rosaceae,
'Rose'. The purpose of gathering the first two data sets was for their use in verifying, aligning and
clustering alongside a set of computationally predicted R-genes from the Italian IASMA. These
sequences were shared in collaboration between IASMA and the Geneva ARS in an effort to
validate the predicted genes. Since the full Malus genome was not yet available, a comparable
genome, Vitis vinifera, was drawn from the NCBI's refSeq. This provided a compatible sequence
25 | P a g e
2.2 Sequence Resources
2.2.1 IASMA
IASMA, the Agricultural Institute of San Michele all'Adige is a research institution in
northern Italy that specializes in agricultural genomics, mapping, and phenotyping. They have
previously published an 8x WGS of Pinot Noir (Vitis vinifera L. cv. pinot noir) and are currently
leading the Golden Delicious apple (Malus x domestica 'Golden Delicious') sequencing project.
IASMA has collaborated in the past with the USDA Agricultural Research Service (Geneva, NY)
for computational biology resources. For this reason it was possible to obtain access to
unpublished, conceptually translated, R-gene predictions from their Golden Delicious apple
sequencing project. IASMA researchers selected these sequences for being predicted genes using
'FgenesH', 'Twinscan', 'GlimmerHMM58' and 'GeneWise'. These sequences were also selected for
their conformation to the Pfam-defined NBS domain profile. Since genomic sequence was not
available for the Malus initiative yet, it was decided that miRNA gene finding would done in the
published V. vinifera sequence in order to maintain comparable sequencing technology and
techniques.
2.2.2 USDA-ARS
The US Department of Agriculture, Agricultural Research Service (USDA-ARS; Geneva,
NY, USA) was the source for the 'Geneva' and 'Rose' data sets. PCR amplification from
degenerate RGA-specific-domain primers also produced a small library (Geneva-set) of Malus
sequences from wild relatives of the genus. The 'Geneva' set consisted of a set of 788 apple
RGAs generated using four pairs of degenerate PCR primers based on the NBS domain
described by Baldi et al. 2004. Specimens were taken from the USDA's apple germplasm
26 | P a g e
domestica, asiatica, baccata, florentina, floribunda, fusca, halliana, honanensis, hupehensis,
kansuensis, micromalus, ombrophila, orientalis, prattii, prunifolia, pumila, robusta, sargentii,
sieboldii, sieversii, sikkimensis, sublobata, sylvestris, transitoria, zumi, yunnanensis, and
zhaojiaoensis), hybrid White Angel, and the rootstock Geneva 41. Roughly 30% of these NBS
identified sequences also included the TIR domain.
The second, 'Rose' set from the NYS-ARS was the product of previous RGA studies on
Rosaceous-related genera. This set includes 75 RGAs from Rubus, 236 from Prunus, 18 from
Fragaria, 151 from Rosa, 42 from Pyrus, and 252 from various wild apple species. More than
500 Rosaceae sp., 350 Populus tritocharpa, 390 V. vinifera, and 163 A. thaliana confirmed
R-gene sequences were retrieved from the NCBI and contributed to this set so as to provide a more
comprehensive collection of R-genes and their analogs. The combined set of these sequences
provide a foundation from which the R-gene candidates can be identified and verified through
sequence similarity.
2.2.3 Vitis vinifera and miRNA
In lieu of Malus nucleotide sequence, it was necessary to have a comparable substrate for
the development of a workflow for miRNA-gene prediction. Because of IASMA's role in both
the V. vinifera and Malus sequencing efforts, and the reasonable evolutionary distance between
the two genera, the NCBI's RefSeq version of V. vinifera was chosen for development.
There existed a second V. vinifera sequencing project at the time of this analysis.
Genoscope, the French National Sequencing Center, was working on a 12x run of inbred Vitis
vinifera L. cv. pinot noir. This sequence was designed to be significantly less heterozygous than
the IASMA iteration. These data are less likely representative of the cultivated grape, and less
27 | P a g e
time of this research the Genoscope sequence was still at 8x coverage and had not yet been
integrated into RefSeq. Because the mode of accession of this sequence was unknown and still
volatile, and to preserve the future reproducibility of the results herein, accession numbers
NC_012007.2 – NC_012025.2 from the IASMA effort were used. miRNA sequences for this
prediction were gathered from V. vinifera stem-loop sequences registered in the Plant miRNA
database (PMRD)(Zhang 2010) and miRBase (Griffiths-Jones S. 2004). These sequences in
combination with Rfam (S. Griffiths-Jones 2003) models and alignments were used to construct
the model for miRNA gene prediction.
2.3 Tools
The following tools were used in multiple ways throughout this investigation. What
follows is a brief description of each tool, their role/function, and version.
2.3.1 COMPUTER – PIECHERRY
Any large-scale computational analysis requires a good computer. All of the in silico
calculation was performed on a USDA server hosted at Cornell. This computer ran 16 Itanium
cores and 82GB of memory to perform these analyses. The operating system was Red Hat
Enterprise version 5.5.
2.3.2 BLAST
BLAST, The Basic Local Alignment and Search Tool(Zhang 2000) can quickly search
large sequences for pattern matches that normal text searches miss. It is also attentive to biology
specific details such as forward and reverse strands, nucleotide base-pairing, insertions/deletions,
and amino acid substitution frequencies. In this situation BLAST can be used to rapidly find
sequences close to known miRNA or RGAs for closer examination. Version 2.2.4 was used
28 | P a g e
2.3.3 SAM/HMMER
SAM (Hughey, R. and Krogh, A 2009) and HMMER (Eddy SR 1998) are two Hidden
Markov model sequence alignment and modeling suites. These programs use slightly different
algorithms to construct profile HMMs from input sequences. The models are useful for scoring
large sequences for their fit to the model as well as aligning sequences in arithmetic time. HMMs
have proven to be extremely useful in the field of gene prediction. SAM was used for the
construction of the full-scale alignments and HMMER was used early in the exploration of a
HMM method of miRNA detection. HMMer version 3.0 and SAM v3.5 were installed on the
server.
2.3.4 T-COFFEE
T-COFFEE (Notredame 2000) is a tool for pairwise, de novo, multiple sequence
alignment. It is more flexible than its predecessor, ClustalW, because of its ability to combine
protein, secondary structure, and DNA inputs in the same alignment. Although T-COFFEE is
slower than an HMM alignment, HMMs require quality aligned sequences for their input and as
such, cannot be used ab initio. T-COFFEE Version 8.93 was used for these alignments online at
the Swiss Institute for Bioinformatics servers.
2.3.5 Phylip
Phylip, (Felsenstein 2005) the phylogeny inference package, is a package for
computational phylogenetics. It is favored for its end-to-end pipeline of such useful and highly
integrated programs as 'protdist', 'fitch', 'protpars' and 'neighbor'. Phylip requires a quality
multiple sequence alignment as input. The various programs can then be used to compute
distance matrices between the sequences at each character-location. It clusters them using this
29 | P a g e
phylogeny) based on this data. Two of these algorithms are Fitch and Kitch. These are
―maximum-likelihood‖-based programs that allow a tree to be rearranged after each sequence
addition. Another algorithm, Neighbor Joining is significantly faster but does not allow for
rearrangement of the tree. Kitch differs from Fitch in its assumption of a constant rate of
evolutionary change throughout the tree. Fitch allows for different rates of change down each
branch. Fitch was selected as the tree-estimation tool for the hierarchical clustering analysis.
Phylip package version 3.6 was installed on the server.
2.3.6 INFERNAL/CMs
Hidden Markov Models are limited in their analysis of problems that involve multiple
data that fluctuate in correlation with one another. Because of this they are limited to estimating
transition probabilities in linear data sets. If a problem requires a second dimension in order to
make sense of the first, a covariance model, or CM, is required. This is valuable in cases where
secondary structure information, rather than primary sequence structure, is the conserved factor.
Such is the case with noncoding RNAs. CMs calculate transition probabilities in much the same
way as pHMMs but also measure the impact of changes in one variable on the other. INFERNAL
(Nawrocki 2009) is a recently developed CM-based analog of HMMER. It uses the familiar
interface of HMMER to build models using a combination of sequence consensus (profile) and
RNA secondary structure consensus. Similarly to HMMER, these models can be used to search
large sequences quickly and score regions for their fit to the model. INFERNAL version 1.0.2
30 | P a g e
2.3.7 Vienna Package
The Vienna Package (Gruber 2008) is the definitive
RNA secondary structure prediction package. It has become
so ubiquitous for the analysis of RNA that many other tools
list it as a dependency for their installation. One program,
'RNAfold', uses three kinds of dynamic programming
algorithms in order to predict the most likely folded
conformation; minimum free energy (MFE), the suboptimal
folding algorithm, and an RNA base pairing-sensitive
iteration of the partition function (Figure 8). Another
program in the package, LocARNA, performs
secondary-structure sensitive MSAs. A standalone 'RNAfold' version
1.8.2 was installed on a local computer. The Vienna package
version 1.8.2 was installed on the server and the University of Vienna's web-server running 1.8.2
was also used.
2.3.8 Perl/Bioperl
Perl is an extremely powerful computational scripting language for scanning and altering
text files. A set of bioinformatics modules known as BioPerl (Stajich 2002) provides a
framework for managing common biological data types such as sequences and alignments. It
also integrates into BLAST and other common programs to lighten the burden of code that must
be written from scratch. Perl version 5.8.8 and Bioperl 1.0.0.5 were installed on the server.
2.4 Work Items
[image:31.612.383.534.79.316.2]2.4.1 Verification of IASMA seq
Figure 8: The partition function - showing a partition along which an RNA may fold as a secondary
31 | P a g e
Because the IASMA sequences had been conceptually translated, they were slightly less
useful from a research point of view. Some quality assurances that the translations were done
with attention to the underlying biology needed to be made. Strictly computational translations
can overlook or misrepresent features that are biologically significant in the actual polypeptide,
such as frame-shifts.
Simple BLAST commands lack the ability to account for frame shifts. A Perl script was
written to check the sequences for frame-shifts and other confounding characteristics. It then
sorted the resultant hits by percent sequence identity. This program was written in Perl, using the
Bioperl BLAST and sequence handling modules and is fairly straightforward in its
implementation. These sequences were also screened for vector and low-complexity/repeatable
elements such as retrotransposons via BLAST against Univec and Repbase respectively.
Instead of attempting to convert IASMA's conceptually translated sequences back into
their frame-ambiguous nucleotide sequence, the nucleotide PCR reads were translated into amino
acid sequences. A translating iteration of BLAST (tBLASTx) was used against the IASMA
sequences. The PCR RGAs in the Geneva-set and the externally acquired Rose-set could be
six-frame-translated and locally aligned to the IASMA translated sequences. Geneva sequences
bearing >90% identity to some translated sequence were very likely to be the correct translation
and could then be kept for use in hierarchical clustering later.
2.4.2 Domain alignment
The full-sequences of resulting query/hit pairs were retrieved and aligned again using
T-COFFEE. This aligned the entire sequences and not just the 'hit' area. The highest scoring pairs
32 | P a g e
the sequences in this way would have been time prohibitive because of the aforementioned
geometric run-time requirements of MSA programs.
The resulting alignment was used to build a profile HMM using SAM. SAM's
'align2model' was then used to align all of the input sequences to the model at arithmetic (as
opposed to geometric) speeds. The resulting alignment organized all of the domains as
co-linearly as possible across all of the sequences.
IASMA sequences that bore similarity to 'Geneva' RGAs should present themselves
proximately to one another when clustered. Similarly, RGA candidates with orthologous targets,
form, or function should align along the same motifs and, later, be clustered accordingly.
This was repeated with 6 different permutations of the model being built: Rose, Italy, a
combined Rose+Italy, Rose+A.th., Italy+A.th., and Rose+Italy+A.th. The most informative of
these alignments, 'Rose' with A.thaliana, was taken to the Phylip package for clustering and
further analysis.
A second full-scale alignment was made using the domain specific models available from
Pfam. By concatenating these models using the -A switch (Eddy 1998) in HMMER, the models
for TIR, NBS-ARC, and LRR1/2/3 were synthesized into a single model consistent with the
domains considered to represent the majority of R-genes in plants. Although this model was
drawn from more evolutionarily distant organisms, it was considered to be relevant enough to
warrant exploration. This model was concatenated to the empirical model to tailor the sensitivity
to organism-level specific details.
The HMMER suite contains a program known as 'hmmpfam' to search for Pfam domains.
It functions much the same way as hmmscore. This program rapidly scans large amounts of
33 | P a g e
is supported. This program was used to determine and quantify the presence of each of the
domains in the IASMA sequences. This further secured their validity as TIR-NBS-LRR
domain-bearing R-genes.
A negative control was also constructed to ensure that the IASMA sequences were not
giving false positives for the TIR-NBS-LRR domains. Three arbitrary domains, (C1q,
Haemagg_act, and MA-Mit) were chosen from Pfam to construct another composite model that
would likely have nothing in common with the IASMA sequences. The IASMA sequences were
scored again with this model using hmmpfam.
In each alignment a handful of sequences were responsible for expansive sections
wherein no other sequence aligned. To prepare the file for a more expedient calculation of
evolutionary distances, these sequences were trimmed along the sites that were not informative
to the rest of the alignment. (Budd 2007) Where there is little or no co-aligned sequence there is
less information. Huge tracts of blank space require time and disk space.
To remove these uninformative sequences, a Perl script was written using the BioPerl
alignment modules. This script indexed the alignment, counted the number of nucleotides in each
column and output them in human-readable format. From there researcher discretion was used to
distinguish between a short run of unmatched sequence and a longer, removable insertion. These
removed sequences were kept for examination of similarity to known transposable elements from
Repbase (Kapitonov 2005) or other sequence via BLAST's bl2seq.
2.4.3 Phylip clustering
A clustering tree was constructed from the trimmed, aligned, IASMA R-gene candidates.
This tree illustrated the clustering and putative evolutionary distances between these sequences
34 | P a g e
lend their own characterization to the IASMA sequences. Association in this manner supports the
hypothesis that those sequences actually encode proteins with the function of disease resistance.
This association also presents clues as to which functional family of resistance they may belong
to. It may also provide insight into historic adversaries that the organisms once shared. The
location of a cluster without any of the unknown sequences as members may indicate that
R-gene families from the ancestral varieties have been lost in 'Golden Delicious'.
The Phylip suite was used to construct these clusters. The alignments were bootstrapped
with 'seqboot' to form 300 jumbled data sets for the further programs. A random seed of 7 was
given. The protein distance matrices were calculated using 'protdist' and the
Jones-Taylor-Thornton scoring method. The resulting distance matrices were each rotationally added to form
300 cluster-trees using 'fitch'. The input data were jumbled twice using a random seed of 7 and
executed following the Fitch-Margoliash, weighted least squares, method. Due to time (80k+
minutes) and data-storage constraints, the entire analysis was reduced from the intended 500
bootstraps down to the performed 300. These 300 trees were combined into a single consensus
tree using 'consense' and formatted with 'drawtree'. This entire process was carried out on both
the Pfam and the PCR based models. The resultant clusters are presented and discussed in their
appropriate sections.
2.4.4 The problem of the miRNA gene finder
Plant miRNAs have primarily been discovered through direct cloning and sequencing of
small cellular RNAs or through comparative genomics. Such efforts have fallen short of the rapid
pace of characterization afforded to other branches of genomic investigation. This is due in part
to the lack of a broadly accepted method for their de novo detection.
35 | P a g e
identifiable in EST collection efforts, their representation in EST libraries is close to 0.01%.
Most estimates suggest that miRNA should account for ~1% of expressed sequences.
Researchers believe that the preparation of cells for transcript collection is too hostile, or not
sensitive enough to preserve these sequences. (Lazzari 2009)
Plant miRNAs tend to occur in gene families encoding identical or nearly identical
mature miRNAs. There are at least 20 such miRNA families broadly conserved among flowering
plants. These miRNA loci are highly conserved against changes in sequence or genomic
positions. Only a handful of mutations at
miRNA loci have been identified in genetic
screens. (Jones-Rhoades 2006)
Although a number of methods were
explored for the prediction of pre-miRNA genes,
the only method that produced significantly
meaningful results used a combination of
secondary structure information alongside the
statistical framework of a pHMM.
The CM (covariance model)-based suite
INFERNAL was used to examine both of these
data in tandem.
Drawing from the 'miRNA' set of known
Vitis vinifera sequences from PMRD and
miRBase, an RNA secondary-structure-sensitive
[image:36.612.310.535.278.659.2]alignment was made using the 'locaRNA' web
36 | P a g e
application. It was feasible to perform an MSA of this size because there were so few (144)
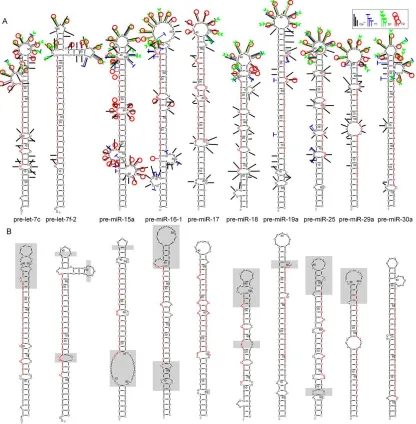
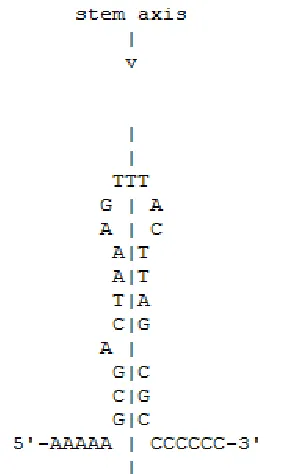
stem-loop sequences currently available for this organism. Following methods intentionally similar to
those of HMMER, a CM was constructed from the alignment. This CM was used to search
genomic sequences at arithmetic speeds for regions matching the composite structure and
sequence (Figure 9) of the known miRNA stem-loop structures. The predicted folding of the
sequences was calculated internally to INFERNAL using the Vienna package's 'mfold'.
A second model was drawn from a composite of three Rfam (RNA analog of Pfam)
families mir-399, mir-395, and mir-172 (Figure 10) and used to score sequences alongside the V.
vinifera derived model for comparison. These 'mir' families were chosen from among the
hundreds of other miRNA families registered in Rfam for their significance in literature as being
[image:37.612.83.520.382.706.2]associated with plant specificity. These models were scored against the V. vinifera chromosomes
37 | P a g e
in parallel. The resulting hits from each chromosome were parsed via Perl, from their tabular
output format into FASTA format and then concatenated into a single file.
Each putative miRNA was searched against the NCBI EST DB. Sequences with 50 or
more nucleotide identities were removed from the final set. Non-coding RNA are usually lost in
the EST identification process and therefore any sequences already identified as part of the EST
DB have a high probability of being coding RNAs that happen to have hairpin-like structures.
Sequences were also eliminated from candidacy for having predicted
secondary-structures with an MFE greater than -28kcal/mol as predicted by the Vienna package's 'mfold'.
Other disqualifying characteristics included sequences with fewer than 45 bases, less than 33%
and greater than 66% G/C content, more than 25 contiguous, ambiguous nucleotides, and
duplicate identification, in which case, only one was kept.
2.5 Failed Attempts and their setup
The study of non-coding RNAs is significantly less resolved than that of traditional genes
and their products. Where solid solutions for their detection or examination have cropped up
there exist deep but poorly connected wells of literature for each method. For this reason a
significant bit more exploration was required to find a successful process by which miRNA
genes could be elucidated. The most successful one has already been described; however the
other attempts are no less valid from an exploratory point of view.
It has been strongly established that among plants, the primary sequences of pre-miRNA
genes lack the evolutionary conservation seen among metaphyta. The information that is
conserved is the folded, single-stranded structure of the domains processed by the miRISC. For
this reason traditional sequence homology searching techniques would be insufficient in the
38 | P a g e
2.5.1 Homology
A search of the genome was performed using BLAST. This search retrieved
mature-miRNA target sites from similarity to targets in other organisms. Genes responsible for coding
products are still subject to the normal rules for genetic conservation. Naturally the mature
portion (Figure 11) of the miRNA, which is responsible for binding this region, should be
conserved as well. A Perl script was written to search 500nt up and downstream of each 'hit'
region using BLAST to check for sequences having loose reverse-complementarities to the
target. This script was tested on a manufactured data-set to ensure that it was capable of of
locating the reverse-complement before being turned onto genomic sequences.
2.5.2 HMM
A second attempt used the pHMM approach taken from the previous effort in RGA
domain scoring. A collection of related, immature miRNA stem-loop sequences was taken from
the PMRD and miRBase repositories. A small number of representative sequences were taken
from previously registered V. vinifera miRNAs and aligned using T-COFFEE. This alignment
was then used to build a model with SAM. The rest of the sequences were then aligned to this
model with 'align2model'. These aligned sequences were appended to the original model such
39 | P a g e
that all of the downloaded plant miRNAs were part of the model used to score the V. vinifera
genomic sequences.
A second model was constructed in the same way, but using letter-encoded (converted
from the parenthetical coding used by 'mfold') structure data derived from the Vienna package's
predictions. Because HMMER and SAM are not configured to translate coded structure data
from the genomic sequences, they too were converted using 'mfold'. Each chromosome was
segmented into 200nt pieces with a 10% overlapping the previous sequence and then translated
by 'mfold'. The model was then used to score each of the 200-nucleotide segments. This method
was loosely based on the methods described by Oulas et al. (2009).
Attempts to combine the sequence and structure models led to the discovery of alternate
MSA formats that incorporated consensus secondary structures such as STOCKHOLM and
SELEX, eventually leading to the use of the third method, INFERNAL.
3. Results
3.1 Sequence Cleaning and Verification
A thorough job of cleaning and preparing the sequences for analysis was done to to the
RGA candidates before their use in this work.
All but five of IASMA's 943 (99.5%) conceptual translations were successfully matched
to the Geneva PCR sequences using tBLASTx searching. The function of IASMA sequences was
supported by linking to in vitro PCR evidence. Consequently, linkage to IASMA's conceptual
translations indicated potential locations of the PCR-RGAs within the their respective genomic
sequence.
While there were a few statistically relevant (e-value) hits among the conceptually
40 | P a g e
sequences are not subject to degradation over evolutionary time and should have manifested as
perfect matches if they were present. Likewise, no sequences bearing statistically significant
resemblance to transposable or repeat elements were found.
While relating the 'Rose' RGAs to the IASMA sequences, 8 sequences out of the entire
IASMA set exhibited possible frame-shifts or alternative splicing. Similarities that contained
multiple fractionated hits that could have been interpreted as one of these features were few
enough to examine manually. No definitive frame-shift was isolated. Regardless of the exact
nature of these sequences, they were removed from further analysis so as to standardize
workflow and increase confidence in further results.
Several sequences from the NYS-ARS germplasm library corresponded to the same
conceptual protein and appeared as redundant sequences. This can be explained through the
mechanism of alternative splicing, and was expected. Because the focus of this experiment was
to verify the likelihood that each sequence was correctly translated and corresponded to a known
RGA, these redundant sequences were eliminated.
3.2 Alignment of Sequences
The 1,741 sequences from the combined sets were aligned using the described methods.
The best alignment from each of the two methods described was kept for clustering.
[Supplemental File 1 and 2] The trimmed, empirically derived model's alignment was 1,893
nucleotides in length, compared to the trimmed Pfam-domain-model derived alignment at 4,658
nt.
3.2.1 Informative Site Trimming
The informative site trimming process excised 222,278 nucleotides (17%) from the
41 | P a g e
distance comparisons during the following clustering. The combined model eliminated nearly as
many.
3.2.2 Transposon search of excised sequences
Of the excised sequences, only three met the statistical cutoff (e-value 0.01) for
consideration as transposons or other repeatable elements. These sequences were only loosely
matched; their similarity was probably coincidental and not investigated further.
3.2.3 HMMpfam Search Results
The initial 'hmmpfam' scores were so overwhelming that they prompted the construction
of the negative control model. Almost every sequence in the IASMA set conformed strongly to
the Pfam domain model, usually in 2 or more of the included domains. Due to their shorter
length, the PCR-RGA sequences had fewer scorable regions causing proportionally lower score
statistics than their IASMA counterparts. Scores of this level likely resulted from the IASMA
researchers' use of an NB-ARC-domain model derived from Pfam alignments as a large part of
their qualification criteria. The PCR-RGA primers were also designed to target the TIR and NBS
domains. This still provides evidence for the relatedness of the sequences to one another, and
also for the computational models' ability to isolate the same domains as the laboratory
techniques. The highest scoring 70 domain-bearing sequences (blended equally for each domain)
were parsed from the output file as representatives of the domains [Supplemental Files 3, 4, 5].
These sequences were collected for possible use in flagging clusters as strongly representative of
43 | P a g e
3.3 Heirarchial Clustering
The hierarchical clustering was performed using the Phylip package, according to the
methods described. The 'Rose' set was compared with the R-gene candidates found in the
genome of Malus x domestica. A tree of 75 clusters was generated based on the calculated
distance matricies. [Supplemental File 6] 'Rose' RGAs are located in a few, but not most of the
clusters in the cluster-tree. This result could be due to specificity in the design of the degenerate
primers for some specific cluster of NBS-coding genes.
Preliminary analysis shows that some NBS-coding sequences from the 'Rose' set cluster
together without any homologues in Malus x domestica. These may be R-genes for non-apple
pathogens. If they include wild apple species they may also be R-genes lost during the selection
of 'Golden Delicious'. These clusters may be new valuable sources of markers or resistance genes
for apple breeding.
Many of the 75 clades consisted of only IASMA identified sequences. These clusters may
be NBS-domain bearing sequences that correspond to other functions. They also may be R-genes
that have yet to be identified in the organisms of the ‗Rose‘ set.
A general feature of the cluster tree is that most clades are comprised of sequences from
two or more species. This implies that the sequences were multiply representative of the same
regions across Rosaceae, i.e, shared by the lineages through a common ancestor.One particularly
interesting clade consists of only Fragaria and Rosa RGAs. This clade may be representative of a
44 | P a g e
45 | P a g e
3.4 miRNA Prediction
Of the multiple attempts at miRNA precursor gene prediction, only the covariance
model-based approach produced meaningful results. By scoring the Rfam and V. vinifera-derived
models against each refseq chromosome, 4,603 and 2,394 sequences were generated
respectively. These sequences were pared down to 1617 (Suplemental File 7) and 1570
(Supplemental File 8) putative pre-miRNAs with the application of secondary filtering criteria.
Of these 3187 combined sequences, 8 were identically shared between the two models and
removed from the combined set to avoid redundancy.
Of the 144 sequences used to construct the V. vinifera-specific model, 64 (44%) were
re-identified from genomic sequence between the two models. Of the 64, 21 of the input sequences
were identified by both models, 28 were unique to the V. vinifera model and 15 were unique to
the Rfam model. The 21 co-identified input sequences were not truly identical because of
start/stop shifts due to variations in the model profiles.
A handful of the sequences used to build the V. vinifera model were detected by the initial
model search but were disqualified by later metrics. In a cursory search, the lowest scoring input
sequences still detectable by the models had a score of 20 and an e-value of 0.49, well below the
threshold of statistical significance. This illustrates that even low-scoring sequences may have
known positives among them.
Unfortunately, the web server responsible for hosting the results of Lazarri et al. (2009)
was no longer functioning. No genomic location or sequence comparisons could be made
between the two attempts because of this.
3.5 Associated Results