Micro-abrasion of Y-TZP in tea
S. Sharifi
1, M.M. Stack
1, L. Stephen
1, Wang-Long Li
2and Moo-Chin
Wang
3,
1
Department of Mechanical and Aerospace Engineering
University of Strathclyde
75 Montrose St.
Glasgow.
2
Institute of Nanotechnology and Microsystems Engineering,
National Cheng Kung University, no. 1 University Road, Tainan
City 701, Taiwan
3
Faculty of Fragrance and Cosmetics, Kaohsiung Medical
University, 100, Shihchuan 1st Road, Kaohsiung 80728, Taiwan
Abstract
1. Introduction
Inefficiency of masticatory system and poor contact between opposite teeth and chewing surfaces are the very common results of wear of teeth texture [1]. The tribological processes inside the oral cavity are categorised as: attrition (the act of wearing away of the surfaces), corrosion (mass loss due to the chemical reactions), erosion (impact of the particles in the slurries), abrasion (the process of wearing down by the friction) and abfraction (eventual fatigue and loss or cracking of the tissue) [2]. These processes do not happen individually. In fact, tooth-to-tooth (or tooth-to-restorative) contact (attrition), chemical reactions without involvement of bacteria (corrosion) and food movement over the enamel surfaces (erosion) may occur simultaneously along with many other chemical and physical factors including the applied force during the chewing, duration of the contact, or even the chewing behaviour in combination with neuromuscular forces. It should be noted that not only masticatation, but also occlusal antagonistic contact is one of the main reasons of the gradual removal of teeth [3-5].
The main candidates as restorative dental materials to recreate the lost function and aesthetic appearance of damaged teeth are ceramic materials. This is due to their long-term clinical success, strength, toughness, relatively comparability to the natural teeth, colour, translucency and desirable processing technologies such as moulding, machining and sintering [6]. One of the most important factors is the very low thermal expansion co-efficient of ceramics comparing to the traditional restoratives such as amalgam. Another contrast between ceramics and the traditional amalgam (apart from their aesthetic properties) is that the latter material does not build an adhesion to the teeth structure and subsequently the weakened teeth will not be strengthened.
Zirconia-based ceramics exhibit more desirable properties among ceramics in this field. Also, the new CAD/CAM technologies have developed the ability manufacturing full-zirconia restorations with occlusal design and good aesthetic results without required subsequent veneering [4]. Furthermore, in biomedical grade zirconia, phase transformation toughening enhances the crack propagation resistance, which makes this material one of the best oxide ceramics. However, this transformation involves the transformation of the metastable tetragonal grains to the monoclinics and as a result; the volume expands at the crack tips which causes compressive stresses. This makes zirconia ceramics susceptible to ‘ageing’ in presence of water. Although it is hardly possible to prevent ageing since it is a natural return back to the monoclinic equilibrium state, the use of yttria instead of co-precipitated powders increases the ageing resistance significantly [7]. Moreover, partially stabilised zirconia substructures provide high hardness, fracture strength, and structural reliability and show a smaller range of strength variations than porcelain [4].
Stabilising the tetragonal phase using yttria, creates yttria-stabilised tetragonal zirconia poly-crystalline (Y-TZP). Y-TZP has favourable mechanical properties in load-transfer applications, such as dental restoration, including high flexural strength (900 to 1200 MPa), remarkable fracture
toughness (
K
IC 7 to 102 1
.
m
MPa
) and Young’s modulus (210 GPa) [8, 9]. Another significant abilityof Y-TZP is its superplasticity behaviour in compressive deformation which enables this material to deform uniformly without fracture [10].
and the wear properties of Y-TZP still need further characterisation. The wear behaviour of such ceramics depends on the material phase, porosity, toughness, hardness and grain size along with the exposure environment [11, 12]. The object of this work is to investigate the wear mechanism of black tea on Y-TZP as a candidate dental replacement material, under micro-abrasion conditions. The consumption of tea has been considered healthier comparing to the other caffeine-based drinks because of having antioxidant properties and oral health benefits such as the high fluoride content. Despite its beneficial effects (such as inhibitory effects on the growth of cariogenic bacteria), consumption of tea can also be harmful and result in dental degradation [13, 14]. To date, the effect of beverages on dental enamel has been widely investigated [13-18]; however, no study has considered the exposure of tea on candidate dental replacement materials such as Y-TZP, despite of their potential application.
In this paper, in addition to the effect of normal black tea on the micro-abrasion of Y-TZP, the popular combinations of tea with sugar and tea with milk have been studied. Also, the abrasive effect of these materials in water was assessed as a reference. Scanning electron microscopy was used to assess the wear mechanisms following exposure. Finally, the wear maps have been constructed for Y-TZP for application in dental restoration.
2. Experimental Materials and Procedure
The objective of the experiment was to determine the micro-abrasive performance of Y-TZP under various loads, sliding distances, and slurry environments. In this test a ball is rotated against a specimen in the presence of a slurry of fine abrasive particles. Because of the nature of the test, it is also known as the ball-cratering abrasive wear test [19].
2.1
Specimen preparation and characterisation
The samples of Y-TZP were provided by National Cheng Kung University, Taiwan and were prepared with 3 mol% yttria doped zirconia, already polished with diamond paste. The original shape of the samples was in circular-discs; however, due to the limited size of the specimen platform of the test rig, the samples were machined into octagon shapes to increase the available area for testing of the surface area of the samples. The final size of the Y-TZP samples was 36mm in length and breadth with the thickness of 3.4mm. The mechanical properties of the samples can be found in Table 1.
Material Property Y-TZP UHMWPE Alumina
Density(kg/m³) 6000 931-935 3800
Young’s Modulus (GPa) 195-210 0.689 351
Hardness (Vickers) 1330-1470 541 2035
[image:3.595.76.524.577.678.2]Fracture Toughness (MPa/m) 7-10 3.5-6 3.5
Table 1 – Material properties [8, 20-22]
2.2
Apparatus (Test rig)
polyethylene (UHMWPE) ball which is clamped between two co-axial shafts. One of the shafts is driven by a variable speed DC geared motor and the ball is driven by friction against the shaft. The other shaft, which is driven by the friction against the ball, is connected a peristaltic pump head. The pump provides the abrasive slurry feed to the contact interface through the syringe. The test sample is mounted onto a platform on a vertical pivoted arm. The arm is in balance when the sample and the ball are just in contact. The loads can be applied by hanging dead weights to a cantilever arm [23]. Figure 1 shows the schematic diagram of (a) apparatus and (b) details of the contact interface.
[image:4.595.81.501.305.475.2]Ultra high molecular weight polyethylene (UHMWPE) ball (K-mac Plastics, Michigan, USA) has been chosen for this experiment as it is a well-known biomaterial possessing very low friction coefficient, superior mechanical toughness and excellent wear and abrasion resistance [24, 25]. UHMWPE is a crystalline homogeneous polymer with a smooth molecular profile. High wear resistance has been reported for these materials in sliding conditions with low friction coefficients (less than 0.1) when sliding against hard counterfaces [26, 27]. The counterface balls used were 25.4mm in diameter. The mechanical properties of UHMWPE have been listed in table 1.
Figure 1 – Schematic diagram of the test rig [19]
2.3
Slurries
Four types of slurries were used for the experiments: Tea, Tea + Sugar, Tea + Milk, and boiled water. It has been reported that during mastication movement simulating, a number of slurries can be used
to simulate food bolus during mastication with a variety in hardness from 3 (CaCO3) to 10 (SiC) in
Moh’s scale [28]. Therefore, in this study, all slurries used were mixed with 30 gl-1 of the abrasive
particles Calcined Aluminium Oxide Powder (Logitech, UK), with a hardness of 9 in Moh’s scale, to produce abrasive slurries and simulate food bolus during mastication. This is due to the aim of this research to consider the behaviour of Y-TZP under harsh conditions. The applied particles are flat and tend to lie parallel with the contact interface and thus the applied load is more evenly spread. The size of the particles was 9 µm. It should also be noted that alumina abrasive has been considered safer, easier to use and less expensive [29]. The mechanical properties of the particles can be found in table 1. Also, in order to prevent the particles from flocculating due to the insolvent nature of the particles, the slurries were agitated by a small propeller situated at the bottom of the reservoir which operated at high speed, ensuring a consistent particle mix was obtained.
testing had begun. For the Tea + Milk slurry, it was estimated that in serving of tea, up to 10% of the final liquid is milk. The slurries were replaced at maximum of 3 hours of use in order to keep a consistent mixture of the solution. They were kept in a heated reservoir which was kept at a constant temperature. The heightened temperature was in order to produce an environment that is as close to the operating conditions as possible. Drinking temperature of tea and the mixtures were estimated as 45 to 50 °C. Table 2 exhibits the properties of the slurries. It should be noted that the measurements were carried out following mixing with the abrasive particles. Also, due to the chemical reactions of the slurries with the abrasive particles (Al2O3 + 3H2O → 2Al(OH)3) [30], the acidic state of the slurries was reduced and the pH values of the final slurries were slightly higher than the primary slurry.
Slurry pH Viscosity at
45°C (cP)
Temperature at sample in operation (°C)
Density at 45°C (kg/m3)
Tea 5.3 0.726 47±2 1032
Tea + sugar 5.3 0.728 48±2 1060
Tea + milk 6.0 0.721 47±2 1033
[image:5.595.68.534.233.352.2]Water 7 0.696 48±2 1012
Table 2 – Slurry properties
2.4
Procedure
The tribological properties of ceramics are mainly based on the environment (gas, liquid or vacuum), humidity, lubricants, and, of course, the material of the second element of the friction pair [31]. Recently, to assess the tribological properties of materials, smaller scales are much more in demand due to localised usage of specialist materials [32]. In this study, the micro-abrasion test was carried out in the conditions given in table 3.
Test conditions
Applied normal loads 3 – 5 N
Sliding velocity 150 rev/min (0.2 m/s)
Tests duration 1 – 3 hrs
Sliding distance 718.17 m/hr
Table 3 – Test conditions
The main parameters which affect the size and the shape and subsequently the rate of the wear are the applied normal load, the sliding velocity, the sliding distance and the volume fraction of the abrasive in the slurry [33]. Previous work using this experimental process has involved testing the effect of a wide range of loads [34-36]. In the present work, the tests were performed using the loads of 3, 4 and 5 N, which was an appropriate choice considering a normal force on a real single tooth [37]. The ball was rotated at a constant speed of 150 rev/min, which was a linear velocity of 0.2 m/s. The friction between the ball and the specimen can generate heat in the interface. The magnitude of the generated heat is very dependant on the sliding velocity. Since higher speeds result in raised frictional energies, which in turn cause higher contact area temperatures, the generated heat was calculated from equation 1 to avoid any serious error [31]:
where µ is the friction coefficient, P is the normal load and v is the sliding velocity. The friction coefficient of UHMWPE is less than 0.1, and Y-TZP is 0.5 in water [38]. It means that the highest possible increasing temperature in the performed tests was 0.5°C; which comparing to the environment temperature (45°C), it was negligible.
The duration of the tests were 1, 2 and 3 hours, equivalent to 718.17m, 1436.34m and 2154.51m sliding distances respectively. In the oral environment, the sliding distance per one chewing “event” is 0.5 – 1 mm and the chewing rate is 60 - 80 cycles/min which occurs 10 – 30 min/day [23, 34, 37, 39]. These numbers give us an average rate of sliding distance of 1 m/day per a tooth. Therefore, 1 hour test can simulate almost two years of a tooth lifetime. With these calculated values, the early life of a Y-TZP dental implant is simulated in 2, 4 and 6 years of time respectively.
3. Results
3.1
Wear scar measurement
It is thought that during the tests, an abrasive particle will effectively cut a path through the surface test material, resulting in plastic flow. This act of cutting (or “carving”) through the test material will cause plastic deformation provided by both the normal loading force and the sliding friction force. Plastic deformation will cause some of the test material to be removed as debris, causing wear [40, 41]. The wear scar volume can be measured from knowledge of the mass loss of the test material and the density [42]. Since the tests were conducted in aqueous conditions with the potential of Y-TZP absorbing moisture from the environment, the samples should have been dried before the weight loss measurement. However, this class of ceramics exhibit a thermal conductivity between
2.4 – 2.8 W/m.K which is a relatively low thermal conductivity that even enables them to be used as
thermal barriers in high temperatures [43, 44]. Therefore, there was a possibility of retention of residual moisture in the samples after drying. Thus, the wear losses were calculated by measuring the residual wear scars from the abrasion test, as identified by Scanning Electron Microscope (SEM).
From inspection of the wear scars under high magnification, the wear regimes, processes and diameters could be determined. The SEM used was an S-3700N model Tungsten Filament SEM (Hitachi High- Technologies, Europe). Since the sample material was not electrically conductive, the samples had to be carbon coated in order to get clearer images. The high accuracy of the SEM allows the accurate reading of the wear scars geometry as it superimposes measurements on the image of the wear scar, making finding the wear volume very quick and easy. The volume of the scars where perforation of the coating does not occur (which applies to the present work) can be measured by equation 2 by assuming it is a section of a sphere [45]:
R b V
64
4
for b<<R (2)
volume loss calculations from the SEM and the profilometry was 3.9%, which verifies the validity of equation 2.
3.2
Effect of applied load and exposure time
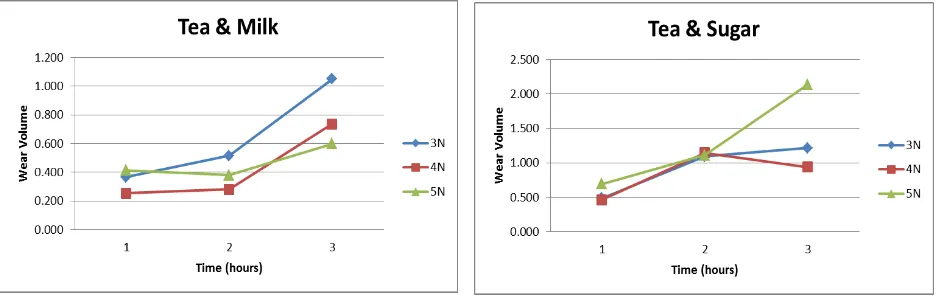
Figure 2 shows the wear at different loads and in the majority of cases, there is an increase in wear volume with increasing exposure time and applied normal load. However, in some cases there is a change in gradient, suggesting that wear volume does not increase linearly as is stated in some papers [47] contradicting the predictions of the Archard equation with a direct increase in wear rate with load.
Figure 2 – (a) Wear due to each slurry under 3N load
Figure 2 – (b) Wear due to each slurry under 4N load
Figure 2 – (c) Wear due to each slurry under 5N load
Figure 2 – Wear results
[image:7.595.133.515.214.731.2]increasing the solution viscosity or decreasing the solution pH value. It can be clearly seen that with the addition of sugar, the wear rate increases; an effect which was more significant at the higher loads.
3.3
SEM analysis and wear regimes
[image:8.595.82.515.334.492.2]The majority of the wear scars in this experiment showed the evidence of 3-2-body mechanisms (explained elsewhere) [48-51], and 2-body grooving regime was the dominant regime among them. For each slurry, a new sample has been used to prevent any effects from the previous slurry on the material. This helps us to discover any differences between the wear scars caused by the properties of the slurry. However, the results were very similar showing 3-2 body mechanisms. As it is confirmed by the SEM and XRD, the presence of the alumina particles embedded in the ball could be the reason of this dominance. Figure 4 shows a picture of the embedded particles on the ball’s surface and the results of the XRD test after a 2 hours test. Once enough abrasive particles are entrained at the contact point, it facilitates the entrance of more abrasive particles and subsequent higher wear rates. Technically, this separates the ball from the specimen surface. Therefore, the ball was rotated after each test to create a fresh surface and also minimising any effects of changes in the overall shape of the ball [46]. Moreover, a new ball was used for each type of the slurries.
Figure 4 – Particles embedded on the ball’s surface and the results of the XRD test after a 2hrs test
Figure 5(a) shows the resulting wear scar of the test performed under 4N load, Tea and milk slurry for 3 hours. In figure 5(b) there is clear evidence of ploughing in the 4N test of Tea for 3 hours. In the case of ploughing, the abrasive particle displaces the material by pushing it around the path of, and into a ridge in front of the particle. Although ploughing does not result in any immediate mass loss, it can be attributed to causing greater mass loss indirectly.
(a) (b)
[image:8.595.83.521.605.753.2]From further studies of the wear scars, there were other wear processes that could be identified. Figure 6 shows evidence that, while 2-body grooving is present, another process known as intergranular fracture has occurred [41] during the 3N, 3 hour test of Tea and sugar. It is assumed that the surface degradation (or ageing) is caused by the tetragonal-monoclinic phase transformation due to the aqueous environment which normally leads to (a) roughening and higher wear rates as a result or (b) micro-cracking which results in grain pull-out and making particle debris which can be clearly seen in figure 6. At the same time, the transformation can benefit the ceramic by creating a compressive surface layer monoclinic phase on the ceramic [7, 52].
(a) (b)
Figure 6– (a) Surface showing evidence of lost grain (b) Evidence of cracked material
Figures 7(a) is a sample of the various wear scars and their measurements to help give an idea of the range in wear scars produced. Figures 7(b) shows various scars with deteriorating image quality such that it was difficult to find the edges and therefore measure the volume. This problem was addressed by using the SEM settings to produce background scatter, as well as using different filters which produced clearer images.
(a) (b)
Figure 7 – (a) 3N, 1 hour, Tea and sugar wear scar (b) 3N 1 hour applied with Tea slurry undesirable scar
3.4
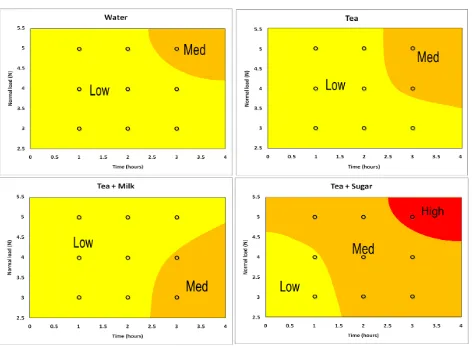
Wear maps
[image:9.595.82.525.188.363.2]Figure 8 – Wear maps of Y-TZP in different slurries (Load/Time)
[image:10.595.74.531.423.790.2]Low: V < 0.641mm3 (V < 30% of maximum)
Medium: 0.641mm3 < V < 1.71mm3 (30% < V < 80% of maximum) High: V > 1.71mm3 (V > 80% of maximum).
The boundaries were created using extrapolation between the above limits for the regimes. The general trends observed from figure 8 indicate that with decreasing load there is a general decrease in wear. Exposure to higher viscosities result in higher wear rates and with longer test durations, wear volume increases. Hence, at the highest values of load, exposure time, and viscosity, maximum wear occurred in the slurry of Tea + sugar for 3 hours. Figure 9 exhibits how viscosity affects the wear rate at the various loads.
4. Discussion
As the experiments were performed in order to evaluate the appropriateness of Y-TZP as a material to be used in dental restoration, the results indicated many different trends for the parameters considered in this study. Many of the experimental parameters were set up to represent the more extreme circumstances that the material would encounter during use, such as elevated temperature
(normally tea is consumed at 50oC), small particles, and high rotational speed. Taking these factors
into account, the material was subjected to what was equivalent to 6 years lifetime in oral cavity
conditions under these harsh conditions, however only losing a maximum of 2.138mm3. The results
above indicated that the incubation time to high wear of Y-TZP is expected to be significant, which is a good indicator for these materials to be used in dental restoration.
The results also indicated that the Archard equation was unsuitable as a model of wear for these tests as it was rarely experienced that the volume increased linearly with time, Figure 2. It is likely that this is due to the presence of multiple wear processes, regimes and interactions as described elsewhere [48-51]. In micro abrasion tests mostly linear relationships between the wear volume and sliding distance have been reported for a large range of loads and slurry concentrations [47]. Therefore, wherever the results did not follow this pattern or were not as they were expected, the test has been redone to minimal the errors. Also, only 2 of the 36 experiments have not left a clear circular wear scars; however, extra care has been taken to make a clearer view of the scar edges using different filters in the microscopy. Figure 7b is to show that the scars might not show a clear edge at the first look. In the cases where it was still hard to determine the wear edges, the samples have been carbon coated to advance the clearance. Furthermore, Trezona and Hutchings 1999, have studied the wear scars of the micro-scale abrasion tests, where the samples are softer than the samples, it is always possible to have the central spherical scar surrounded by a roughened or ‘scuffed’ annular region, which makes it difficult to distinguish the boundaries between the annulus and the spherical scar by optical microscopy. However, after conducting a large number of tests, a consistent empirical relationship between the width of the spherical part and the width of the scuffed region was reported, which suggested that it is sufficient to consider only the size of the spherical scar to determine the wear behaviour of the material. Also, since the ridges are quasi-stable, they have the tendency to the eventual break down and resuming the normal wear [46]. Moreover, the types of tests performed in this study had never been attempted previously for this material, slurries and environments and this would be an area of further work.
reported that pH has a significant effect on wear loss in ceramics, where the high wear-volumes are obtained for the most acidic and the most alkaline environments, however, the highest mass loss takes place in the acidic environments. It should be noted that although the environments with the pH of close to 5 are not very acidic, however, the wastage is much higher than neutral or low alkaline environments [2, 55]. In the current study, the results indicated that the lower pH values tended to increase the wear rate; however, to generate the wear maps based on pH values, a wider range of pH values is needed to study such effects on wear rates more accurately. Although it is expected to have a higher mass loss while increasing the normal loads or the exposure time; However, it is not always guaranteed that the higher loads create bigger wear scars when the loads increase, and this is due to that the higher loads make higher pressure on the contact area and this makes the entrainment of the particles more difficult [46]. For example, by rearranging the results based on the slurries in Fig. 10, it can be clearly seen that the wear volume for higher loads is less than for lower loads. This phenomenon has been repeated few times. Therefore, if the higher loads fail to create a bigger wear-volume because of weak entrainment, there should be another reason for having a high volume loss in different slurries and that would be the higher viscosity or more acidity.
Fig 10 – Rearranged results based on slurries
From figure 8, the dominant factor along with higher loads in increasing the wear rate is increased viscosity for the Y-TZP material. By generating wear maps of different loads in figure 9 based on this concept, a clearer picture can be drawn of how the changes in these values affect the rate at which the material is worn along with normal loads. There is a thus a necessity to construct further wear maps to investigate the contributions of load, viscosity, pH, exposure time and sliding speed in order to provide an enhanced understanding of the material performance to environments found in the oral cavity.
5. Conclusions
(i) The micro-abrasion of Y-TZP material was investigated in Tea with various
additions to modify the pH and viscosity levels, using water as a reference solution
(ii) The results indicated a significance change in the wear rate with load, exposure
time and viscosity
(iii) In the small pH range studied, the wear rates increased with decreasing pH values
6. References
[1] Li, H. and Z.R. Zhou, Wear behaviour of human teeth in dry and artificial saliva conditions. Wear, 2002. 249 (980-984).
[2]Wang, Hshin-Chun, Stack, M.M, Li, Wang-Long Hong, Ting-Fu, Wang Moo-Chin, On the construction of wear maps for Y-TZP dental ceramics in aqueous environments: pH, exposure time and impact angle effects.
Tribology International, 2010. 43 (2258-2267).
[3] Zheng, J. and Z.R. Zhou, Friction and wear behavior of human teeth under various wear conditions.
Tribology International, 2007. 40 (278-284).
[4] Preis, V., M. Behr, C. Kolbeck, S. Hahnel, G. Handel, and M. Rosentritt, Wear performance of substructure ceramics and veneering porcelains. Dental Materials, 2011. Dental-1824.
[5] Bourdiol, P. and L. Mioche, Correlations between functional and occlusal tooth-surface areas and food texture during natural chewing sequences in humans. Archives of Oral Biology, 2000, 45 (691-699).
[6] Höland, W., V. Rheinberger, C. Ritzberger, F. Rothbrust, H. Kappert, and R. Nesper, Future perspectives of biomaterials for dental restoration. Journal of the European Ceramic Society, 2009. 29 (1291–1297).
[7] Chevalier, J. What future for zirconia as a biomaterial?.Biomaterials, 2006, 27 (535–543).
[8] Sevilla, P., C. Sandino, M. Arciniegas, J. Martínez-Gomis, M. Peraire, and F.J. Gil, Evaluating mechanical properties and degradation of YTZP dental implants. Materials Science and Engineering C, 2010. 30 (14-19). [9] Zidan, O. and U. Abdel-Keriem, The effect of amalgam bonding on the stiffness of teeth weakened by cavity preparation. Dental Materials, 2003. 19 (680-685).
[10] Shi, J.L, G.Q. Zhu, and T.R. Lai, Compressive Deformation Behaviour of Superplastic Y-TZP-Based Ceramics: Role of Grain Boundary Phases. Journal of the European Ceramic Society, 1997. 17 (851-858).
[11] Medevielle, A., F. Thevenot, and D. Treheux, Wear resistance of zirconias. Dielectrical approach. Wear, 1997. 213 (13-20).
[12] Hvizdos, P., A. Mestra, and M. Anglada, Effect of heat treatment on wear damage mechanisms in 3Y-TZP ceramics. Wear, 2010. 269 (26-30).
[13] Phelan, J. and J. Rees, The erosive potential of some herbal teas. Journal of Dentistry, 2003. 31 (241-246). [14] Brunton, P.A. and A. Hussain, The erosive effect of herbal tea on dental enamel. Journal of Dentistry, 2001. 29 (517-520).
[15] Low, I.M. and A. Alhuthali, In-situ monitoring of dental erosion in tooth enamel when exposed to soft drinks. Materials Science and Engineering C, 2008. 28 (1322-1325).
[16] Barbour, M.E., M. Finke, D.M. Parker, J.A. Hughes, G.C. Allen, M. Addy, The relationship between enamel softening and erosion caused by soft drinks at a range of temperatures. Journal of Dentistry, 2006. 34 (207-213).
[17] Tahmassebi, J.F., M.S. Duggal, G. Malik-Kotru, M.E.J. Curzon, Soft drinks and dental health: A review of the current literature. Journal of Dentistry, 2006. 34 (2-11).
[18] Rios, D., H. M. Honorio, A. C. Magalhaes, A. Wiegand, M. A. Machado, and M. A. Buzalaf, Light cola drink is less erosive than the regular one: An in situ/ex vivo study. Journal of Dentistry, 2009. 37 (163-166).
[19] Adachi, K. and I.M. Hutchings, Wear-mode mapping for the micro-scale abrasion test. Wear, 2003. 255 (23-29).
[20] Buchanan, F.J. and P.H. Shipway, Microabrasion - a simple method to assess surface degradation of UHMWPE following sterilisation and ageing. Biomaterials, 2002. 23 (93-100).
[21] Stack, M.M. and M.T. Mathew, Micro-abrasion of UHMWPE: some applications to the bio-tribioloogical lifecycle. Wear, 2010 (ISSN 0043-1648).
[22] Puértolas, J.A., A. Larrea, and E. Gómez-Barrena, Fracture behavior of UHMWPE in non-implanted, shelf-aged knee prostheses after gamma irradiation in air. Biomaterials, 2001. 22 (2107-2114).
[23] Stack, M.M. and C. Hodge, Tribo-corrosion mechanisms of stainless steel in soft drinks. Wear, 2010. 270 (104-114).
[24] Xiong, D., Z. Gao, and Z. Jin, Friction and wear properties of UHMWPE against ion implanted titanium alloy. Surface & Coatings Technology, 2007. 201 (6847-6850).
[25] Ge, S., et al., Wear behaviour and wear debris distribution of UHMWPE against Si3N4 ball in bi-directional sliding. Wear, 2008. 264 (571-578).
[26] Marcus, K. and C. Allen, The sliding wear of ultrahigh molecular weight polyethylene in an aqueous environment. Wear, 1994. 178 (17-28).
[27] Axen, N., S. Jacobson, and S. Hogmark, Influence of hardness of the counterbody in three-body abrasive wear – an overlook hardness effect. Tribology International, 1994. Vol. 27, No. 4 (233-241).
[29] Fleming, G.J.P., H. S. Jandua, L. Nolana, F.J. Shaini, The influence of alumina abrasion and cement lute on the strength of a porcelain laminate veneering material. Journal of Dentistry, 2004. 32 (67-74).
[30] Sun, Q., K. Reuter, and M. Scheffler, Effect of humid environment on the surface structure of RuO2(110).
Physical Review B, 2003. 67 (1-7).
[31] Khurshudov, A.G., Y.N. Drozdov, and K. Kato, Transitional phenomena in the lubricated heavily loaded sliding contact of ceramics and steel. Wear, 1995. 184 (179-186).
[32] Rutherford, K.L. and I.M. Hutchings, A micro-abrasive wear test, with particular application to coated systems. Surface & Coatings Technology, 1996. 79 (231-239).
[33] Bose, K. and R.J.K. Wood, Optimum tests conditions for attaining uniform rolling abrasion in ball cratering tests on hard coatings. Wear, 2005. 258 (322-332).
[34] Antunes, P.V. and A. Ramalho, Study of abrasive resistance of composites for dental restoration by ball-cratering. Wear, 2003. 255 (990-998).
[35] Leroy, C., K.I. Schiffmannb, K. van Ackerc, and J. von Stebut, Ball cratering an efficient tool for 3 body microabrasion of coated systems. Surface & Coatings Technology, 2005. 200 (153-156).
[36] Camerini, R.V., R. B. de Souza, F. de Carli, A. S. Pereira, and N. M. Balzaretti, Ball cratering test on ductile materials. Wear, 2011. 271 (770-774).
[37] He, L., Mechanical behaviour of human enamel and the relationship to its structural and compositional characteristics. PhD Thesis, 2008. Biomaterials Science Research Unit, Faculty of Dentistry, the University of Sydney.
[38] Stachowiak, G.W. and G.B. Stachowiak, Environmental effects on wear and friction of toughened zirconia ceramics. Wear, 1993. 160 (153-162).
[39] Lewis, R. and R.S. Dwyer-Joyce, Wear of human teeth: A tribological perspective. Journal of Engineering Tribology, 2005. 219 (1-18).
[40] Hodge, C. and M.M. Stack, The effect of slurry concentration on the micro-abrasive wear behaviour encountered by pure aluminium in aqueous conditions. 2009. Department of Mechanical Engineering, University of Strathclyde, UK.
[41] Hsu, S. and M.C. Shen, Wear: Materials, Mechanisms and Practice, ed. G.W. Stachowiak. 2005: John Wiley and Sons, Ltd.
[42] Turell, M., A. Wang, and A. Bellare, Quantification of the effect of cross-path motion on the wear rate of ultra-high molecular weight polyethylene. Wear, 2003. 255 (1034-1039).
[43] Raghavan, S., et al., Thermal properties of zirconia co-doped with trivalent and pentavalent oxides. Acta Materialia, 2001. 49 (169-179).
[44] Kimura, T. and T. Goto, Thermal conductivities of yttria-stabilized zirconia films measured by a laser-heating AC method. Surface & Coatings Technology, 2005. 198 (129-132).
[45] Gee, M.G., A. Gant, I. Hutchings, R. Bethke, K. Schiffmanc, K. Van Acker, S. Poulat, Y. Gachon, J. von Stebut, Progress towards standardisation of ball cratering. Wear, 2003. 255 (1-13).
[46] Trezona, R.I. and I.M. Hutchings, Three-body abrasive wear testing of soft materials. Wear, 1999. 233-235 (209-221).
[47] Stachowiak, G.B., G.W. Stachowiak, and J.M. Brandt, Ball-cratering abrasion tests with large abrasive particles. Tribology International, 2006. 39 (1-11).
[48] Archard, J.F., Contact and rubbing of flat surfaces. Journal of Applied Physics, 1953. 24 (981). [49] Hutchings, I.M., Tribology: Friction and Wear of Engineering Materials. Vol. Chapter 6. 1992.
[50] Trezona, R.I., D.N. Allsopp, and I.M. Hutchings, Transitions between two-body and three body abrasive wear: influence of test conditions in the microscale abrasive wear test. Wear, 1999. 225-229 (205-214). [51] Stack, M.M. and M. Mathew, Micro-abrasion transitions of metallic materials. Wear, 255 (14-22).
[52] Lawson, S., Environmental Degradation of Zirconia Ceramics. Journal of The European Ceramic Society, 1995, 15 (485-502).
[53] Adachi, K., K. Kato, and N. Chen, Wear map of ceramics. Wear, 1997. 203-204 (291-301). [54] Hsu, S.M. and M. Shen, Wear Prediction of Ceramics. Wear, 2004. 256 (867-878).
![Table 1 – Material properties [8, 20-22]](https://thumb-us.123doks.com/thumbv2/123dok_us/1667724.120308/3.595.76.524.577.678/table-material-properties.webp)
![Figure 1 – Schematic diagram of the test rig [19]](https://thumb-us.123doks.com/thumbv2/123dok_us/1667724.120308/4.595.81.501.305.475/figure-schematic-diagram-test-rig.webp)