POWER SYSTEM FREQUENCY MANAGEMENT
CHALLENGES - A PROBABILISTIC APPROACH TO
ASSESSING WIND FARM POTENTIAL FOR AIDING
SYSTEM FREQUENCY STABILITY
Lei Wu and David Infield
Department of Electronic and Electrical Engineering University of Strathclyde, United Kingdom
Keywords: frequency stability, power systems, synthetic inertia, wind farm.
Abstract
With the increasing wind penetration level in power systems, transmission system operators have become concerned about frequency stability. The inertia of variable speed wind turbines are decoupled by power electronic converters from the power network and therefore do not intrinsically contribute to power system inertia. Besides, as wind plant displace conventional generation and their inertia, substantial reduction in power system inertia may occur. Variable speed wind turbines can be controlled to provide synthetic inertial response but have no direct contributions to power system inertia levels. A probabilistic approach to assessing wind farm potential for aiding frequency stability in power systems is proposed, and the method will be applied to the GB power system. The impact of the aggregate inertial response on arresting frequency fall is examined assuming a sudden generation loss of 1800 MW in the GB power system. The results show that inertial response from wind can reduce the maximum rate of fall of frequency and the minimum system frequency following the event (frequency nadir).
1 Introduction
As one of the most commercially viable renewable energy sources, wind power has the potential to supply a large proportion of electricity demand worldwide. It is anticipated that the installed wind capacity in the power system of Great Britain (GB) will grow significantly over the coming years. By 2020, 20% of the UK’s electricity consumption is expected to come from wind energy. This transformation will have profound impact on the nature and behaviour of the GB power system. In order to ensure secure and reliable performance of the power system into the future, improved understanding of the system’s dynamic characteristics with high penetrations of wind is required. Among the many issues that have been identified, it is shown that frequency stability could be problematic for the transmission system operators (TSOs) of smaller power systems like those of Great Britain and the Republic of Ireland. National Grid in the UK has
commissioned a working group to provide assessment and recommendations relating to the management of frequency response and synthetic inertia from wind capacity in the GB power system. A comprehensive study (All Island TSO Facilitation of Renewables Studies) has also been conducted to better understand the technical and operational implications of increasing penetration of wind on the combined Ireland and Northern Ireland power system.
Power system inertia can be defined as the total amount of kinetic energy stored in all rotating generators and motors that are synchronously connected to the network (or near synchronously connected in the case of induction generators and motors). As a result of a transient frequency drop, each synchronously connected turbine-generator will automatically decelerate thereby releasing kinetic energy to oppose the change in frequency. The initial rate of change of frequency (ROCOF) will be determined by the inertia level within the power system and extent of power mismatch. With the potential increase in generator unit size (up to 1 800MW in the UK) and reduced power system inertia, a larger frequency minimum and greater initial ROCOF could occur following a sudden generation loss on the system. These combined effects could lead to system wide instability.
wind penetration scenarios by a joint research team from University College Dublin and utilities in Ireland [3]. In their study, one of the few to take variations in wind into account, the inertial contributions of wind generation are estimated by a function established from historical wind farm operational data. Due to the difficulties in determining the number of wind turbines connected to the grid, significant uncertainties exist in terms of the stored kinetic energy on wind capacity.
According to the recommendations made by National Grid [4], with the rising wind penetration levels, reliable system frequency performance can only be achieved if variable speed wind turbines are equipped with a synthetic inertia capability or a fast primary response capability (emulated droop response). TSOs will therefore have to rely on wind farms to deal with transient events on the system through the delivery of so called synthetic inertia together with frequency support from conventional plant commitment. It is then vitally important for TSOs that the frequency support from wind capacity is predictable and verifiable under varying wind conditions.
The challenges are twofold; first, the inertial response available from wind generation can be difficult to predict due to the wind turbine availability and the wide range of potential variability of the wind resource, both locally, and nationally. Second, the power system dynamic characteristics (such as total available inertia) will change constantly due to changes in plant mix resulting from the time varying nature of the load and also the time variable wind power generation.
The contribution of this work is to address the first challenge and to propose a probabilistic approach to modelling the wind farm potential for aiding frequency stability in the GB power system taking account of the variation of wind speed, and the local mean wind speeds. Although the GB power system is used as the case study, this approach can be easily developed to apply in other power systems.
The paper is set out in the following way: section 2 describes the modelling of a variable speed wind turbine and the GB power system. Section 3 explains the approach to assessing the aggregate inertial response from wind capacity under varying wind conditions. Section 4 examines the impact of power contributions from the operational wind capacity to frequency stability in the GB power system and provides estimates of the key frequency indices, namely the initial ROCOF and the frequency minimum (nadir); and finally conclusions and future work are presented in section 5.
2 System Modelling
2.1 Wind turbine modelling
The wind turbine represented in this work consists of a simple rotor aerodynamic model, lumped drive train model and turbine controller.
A general rotor aerodynamic model that represents the energy
capture from the wind is given by
= 0.5 ( , ) (1)
where is the aerodynamic power captured by the rotor, is the air density in ⁄ , is the area swept by the rotor
blades in , is the wind speed in ⁄ , and is the
power coefficient defined in the conventional manner and is a measure of the aerodynamic efficiency of the rotor.
The lumped inertia drive train model is given by
= − (2)
where is the total (lumped) inertia of the drive train system including rotor, gearbox, shafts couplings etc, and the generator (note that the generator inertia has been referred to low speed shaft) in · , is the mechanical rotational
speed of the rotor, is the aerodynamic torque supplied to
the system and represents the torque extracted from the system at the generator (sometimes called the air gap torque). When the wind speed changes, the imbalance between aerodynamic torque and demanded torque will cause the rotor to accelerate or decelerate. The turbine controller will then act to bring the turbine back to balance in order to ensure the rotor can capture maximum energy from the wind within the rating of the turbine.
Below rated wind speed, the demanded torque is regulated according to (3) such that this torque changes to match the aerodynamic torque. It is generally unnecessary for this mode of operation to pitch the blades and therefore the pitch angle is set to its optimal value for below rated operation. Below rated torque control uses the standard relation
= (3)
where is the constant (controller gain) for the tracking of the maximum power coefficient curve (under steady state conditions) and can be obtained by
= 0.5 (4)
Above rated wind speed, pitch control provides the way to regulate the aerodynamic power and limit the rotor speed, thus ensuring that rated power is not exceeded. Table 1 lists the parameters for the wind turbine model.
CPopt KPopt λPopt J ρ A
0.47 4.67×10⁵ 8.46 12×106 1.225 7854
Table1 Wind turbine parameters
infeed loss. Detailed explanation of the provision of inertial response from variable speed wind turbines can be found in [5-6].
2.2 GB power system modelling
A well established System Frequency Response (SFR) model that can estimate the average, assumed uniform, frequency behaviour of a large power system was proposed in [7]. In an SFR model it is assumed that only the largest time constants of the generating units are relevant and that generation on the system is dominated by reheat steam turbine generators. An equivalent single machine is used to represent the dynamics of the conventional generators by filtering out the synchronising oscillations that may occur between generators in a large power system. For this study the SFR model is modified to include wind generation and thus can capture the key aspects of the frequency behaviours in the projected GB power system in 2020. The wind generation is able to deliver inertial power contributions in response to system frequency fall. This modified SFR model is considered adequate for the purposes of investigating system wide frequency dynamics. Local and distributed effects however should be examined more carefully using more detailed models. Note that over frequency events will not be examined in this work as wind capacity can be easily curtailed and so decrease the overall system generation when required.
3 Assessing aggregate frequency response
As wind speed is constantly changing and different from turbine to turbine, the combined response from wind generation will comprise contributions from each wind farm, each operating under different local wind conditions. A novel approach to assessing the aggregate inertial response from wind capacity operating within the GB power system is presented here. This approach is based on a validated spatial wind model [8] and a probabilistic method for the aggregation of the inertial response of geographically dispersed wind generation. Although the approach is applied here to the case of the GB power system, it can be easily adapted and applied to other power systems and wind regimes.
3.1 Estimate wind capacity in 2020
The GB power system is divided into 17 study regions in this study, consistent with the 17 SYS boundaries identified by National Grid [9]. The installed wind capacity in each region for the year of 2020 is estimated on the basis of wind farms already operational, under construction, and consented as listed in RenewableUK’s UK Wind Energy Database, [10]. The installed wind capacity estimated in this manner totals 27.4 GW by 2020 and includes offshore wind. This is broadly consistent with National Grid’s ‘Gone Green’ scenario with a
total of 30 GW. Wind speeds however are not available offshore using the spatial wind model and thus such capacity has been allocated to the nearest onshore region. The resultant errors in modelling are unlikely to be significant, although future work is planned to extend the spatio-temporal wind field models when suitable offshore data becomes available.
3.2 Synthesised wind speed data
A Vector Auto Regressive (VAR) model is applied to synthesise wind speed data for power system impact studies [8]. This VAR modelling approach takes account of the diurnal and seasonal variations in wind speed through detrending, and simulates the correlation of wind speeds across the geographical areas in the GB power system. Fourteen meteorological office stations in the UK were chosen to characterise the wind speed data in 14 SYS study regions. Note that three study regions (Regions 4, 14 and 16) have been taken out of this work due to lack of reliable wind data from local meteorological stations. However, these three regions have limited wind capacity (Table 2) and this simplification will have no significant impact on the overall results.
3.3 Calculate collective frequency support
A probabilistic methodology to assess the combined response from a wind farm under time varying wind speed has been proposed in [6]. The methodology will be briefly introduced in this section to provide an overview.
Wind variations over a short period of time, 10 seconds, comparable to the inertial response transient, are described by a Gaussian probability distribution in the methodology. The
probability of two successive wind speed values and is
then given by the joint Gaussian probability distribution:
( , ) =
√
( ) ( ) ( )( )
( ) (5)
where is the autocorrelation of the wind at lag , is mean wind speed, is the standard deviation determined by =
. The turbulence intensity is chosen as 0.2. The
autocorrelation, , can be calculated as follows:
=∫∞ ( )∙cos(2 ∙ τ) (6)
The Kaimal spectrum, ( ), for wind turbulence is given
by:
( ) = . ×
( )
. × ( )
(7)
where ( ) = × ⁄ ; = 0.041 × ⁄ , and is height
above ground in this example set as 80 meters, is the
Region 1 2 3 4 5 6 7 8 9 10 11 12 13 14 15 16 17
Capacity(GW) 2.05 0.25 0.37 0.44 1.30 4.25 4.13 2.25 3.50 2.28 0.16 3.04 0.88 0.0 1.83 0.19 0.49
Total 27.41
integral length scale (here taken to be 120 meters) which relates to the site topography.
A block approach is used to represent start and end values of the wind speed over the transient. The start wind speed is divided into 6 blocks and the end wind speed is also divided into 6 blocks. In this way, the potential infinite number of wind ramps over the transient is reduced to 36 scenarios that can effectively represent all the possible wind ramps for a given mean wind speed. The blocks can be represented as:
, (i=1,…,6;j=1,…,6) (8)
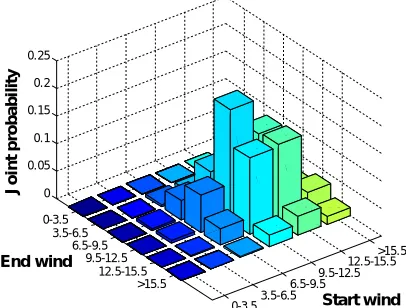
Although the expected inertial response should be calculated using the full range of wind ramps and their probabilities, only wind variations between zero and 50 m/s are used in this work as wind speeds beyond this range rarely occur. The probability distribution for the wind ramps is dominated by those that start and end wind speeds close to the mean (12 m/s in this case) as shown in Figure 1.
Figure 1 Joint probabilities for mean constant wind speed of 12 m/s
The wind capacity in each study region is represented by one single effective wind turbine (for simplicity all wind turbines are assumed to be identical). The GB power system can be represented by 17 regions with hourly average wind speeds
U (m=1,…,17) and wind power installed capacity P
(m=1,…,17) in each region. For any given event (assumed to
last for 10 seconds) across the power system, the wind capacity, P , in each region will experience different transient wind and operate in 36 blocks with appropriate probabilities,
Q( ), (m=1,…,17;i=1,…,6;j=1,…,6).
When the 17 regions are combined, the wind capacity operating in a range corresponding to a particular block can be calculated using weightings defined as follows. Weighting ,, can be calculated from:
, =∑ P Q, ( )
,…, (9)
For each of the blocks, the corresponding weighting , is the sum of the wind capacity in each region multiplied by the probability associated with the specified wind ramp range. The weightings for a set of wind speeds across the GB power
system are listed in Table 3.
Start Wind
End wind i=1 i=2 i=3 i=4 i=5 i=6
j=1 0.07 0.04 0 0 0 0
j=2 0.04 0.38 0.07 0 0 0
j=3 0 0.07 0.13 0.04 0 0
j=4 0 0 0.04 0.05 0.03 0
j=5 0 0 0 0.03 0.01 0
j=6 0 0 0 0 0 0
[image:4.595.62.265.307.461.2]Total 1
Table 3 Weightings for a set of wind speeds
The expected aggregate inertial response from wind generation as a whole can then be calculated combining the inertial power response from the 36 blocks each one represented by a power response (equivalent a turbine controller plus wind ramp input), weighted by the appropriate weightings calculated using (9). Figure 2 shows the inertial power contributions from wind capacity calculated for weightings in Table 3 when the system is subject to a sudden infeed loss of 1800 MW at 400 s. This is a key additional step towards accurate estimation of the frequency support potentially available from wind capacity.
Figure 2 Power contributions from wind capacity
4 Simulation results
The proposed probabilistic approach to calculating the aggregate inertial response from wind is used to estimate the contributions to frequency stability in the GB power system. It is estimated that the installed wind capacity will be 27.4 GW by 2020 as explained above. The generating wind capacity can then be calculated on an hourly basis, given an average availability of 95%. It is assumed that 6.9 GW of nuclear power plant will supply the base load on the system. 1.8 GW of GB pumped storage is assumed to be operating in generating mode and the remainder assumed to deliver ancillary balancing service as required. Conventional generation (coal and gas powered plant) will make up the rest of the generation mix. The wind speeds across the GB power system on a typical British summer day are obtained using the
0-3.53.5-6.5 6.5-9.59.5-12.5
12.5-15.5>15.5 0-3.5
3.5-6.5 6.5-9.5
9.5-12.5 12.5-15.5
>15.5 0
0.05 0.1 0.15 0.2 0.25
Start wind
J
o
in
t
p
ro
b
a
b
il
it
y
End wind
395 400 405 410 415 420 425 430
6 6.5 7 7.5 8 8.5 9 9.5 10
Time (s)
P
o
we
r
c
o
n
tri
b
u
ti
o
n
s
f
ro
m
wi
n
d
(GW
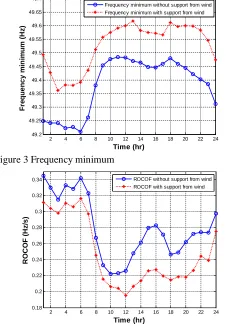
[image:4.595.311.534.371.539.2]VAR wind model outlined above. The system load is anticipated to remain flat over the period from 2010 till 2020 due to the load reduction from energy efficiency measures and increase from electric vehicle charging and heating. The power system inertia constant values are calculated on a hourly basis. The impact of the aggregate inertial response from wind capacity on frequency stability is examined assuming a sudden loss of 1800 MW of generation occurs. Since the response from the wind will depend on the mean wind speed levels prevailing at the time in question, it is important to investigate how this might vary through the day. 24 simulation runs have thus been carried out. Figure 3 shows the frequency minimum (nadir) for each hour through the day following the event with and without inertial frequency support from the wind capacity. It can be seen that the power contribution from the total assumed operational GB wind plant can significantly reduce the extent to which the frequency would fall. Figure 4 shows that the maximum rate of change of frequency (ROCOF) immediately following the transient can be reduced by the wind plant.
Figure 3 Frequency minimum
Figure 4 Rate of change of frequency (ROCOF)
5 Conclusions and future work
A probabilistic approach to assessing the aggregate inertial response available from wind generation in the GB power system has been proposed in this work. The novelty lies in the assessment of aggregate inertial response from wind turbines under time varying wind speeds on an hourly basis and across
the regions, and also as a result of turbulence and wind speed variation across wind farms. The impact of frequency support from wind plant on the power system as a whole can be quantified with some degree of confidence. This work shows that provision of inertial frequency support from wind plant can help to reduce the ROCOF and also increase the minimum frequency seen by the system following the transient (loss of generation) event.
It is worth noting that droop response from wind turbines, also known as continuous frequency service, is now likely to be included in various grid codes. As the provision of droop response requires that the wind turbine operates with head room so that its output can become a linear function of system frequency deviation from nominal, such frequency support will obviously also be subject to local mean (typically hourly) wind speed and its short term turbulent variation. Assessing the provision of droop response from wind generation across a power system, and its interactions with inertial response under changing wind speed conditions, will be the topic of future work building on the methodology presented here.
References
[1] J. Morren, et al., "Inertial response of variable speed wind turbines," Electric Power Systems Research,
vol. 76, pp. 980-7, 2006.
[2] D. Gautam, et al., "Control Strategy to Mitigate the Impact of Reduced Inertia Due to Doubly Fed Induction Generators on Large Power Systems,"
Power Systems, IEEE Transactions on, vol. 26, pp. 214-224, 2011.
[3] R. Doherty, et al., "An assessment of the impact of wind generation on system frequency control," IEEE Transactions on Power Systems, vol. 25, pp. 452-460, 2010.
[4] National Grid, "Frequency Response Technical
Sub-Group Report," 2011.
[5] L. Wu and D. Infield, "Modelling the provision of inertial response from variable speed wind turbines," in IET Conference on Renewable Power Generation (RPG 2011), 6-8 Sept. 2011, Edinburgh, UK, 2011, p. 6 pp.
[6] L. Wu and D. G. Infield, "Towards an Assessment of
Power System Frequency Support From Wind Plant& - Modeling Aggregate Inertial Response,"
Power Systems, IEEE Transactions on, vol. PP, pp. 1-1, 2013.
[7] P. M. Anderson and M. Mirheydar, "A low-order system frequency response model," Power Systems, IEEE Transactions on, vol. 5, pp. 720-729, 1990. [8] D. C. Hill, et al., "Application of Auto-Regressive
Models to U.K. Wind Speed Data for Power System
Impact Studies," Sustainable Energy, IEEE
Transactions on, vol. 3, pp. 134-141, 2012.
[9] National Grid, "National Electricity Transmission System Seven Year Statement," 2011.
[10] RenewableUK. UK Wind Energy Database [Online].
2 4 6 8 10 12 14 16 18 20 22 24 49.2
49.25 49.3 49.35 49.4 49.45 49.5 49.55 49.6 49.65 49.7
Time (hr)
F
re
q
u
e
n
c
y
m
in
im
u
m
(
H
z
)
Frequency minimum without support from wind Frequency minimum with support from wind
2 4 6 8 10 12 14 16 18 20 22 24 0.18
0.2 0.22 0.24 0.26 0.28 0.3 0.32 0.34
Time (hr)
R
O
C
O
F
(
H
z
/s
)