V
IBRATION-
BASED HEALTH MONITORING APPROACH FOR COMPOSITESTRUCTURES USING MULTIVARIATE STATISTICAL ANALYSIS
.
David Garc´ıa1, Irina Trendafilova1, Hussein Al-Bugharbee1
1Dynamics of Advanced Structures and Machinery (DASM)
MAE, University of Strathclyde, 75 Montrose street, G1 1XJ Glasgow
david.garcia@strath.ac.uk
ABSTRACT
In this paper a novel procedure for damage assessment is suggested which is based on singular spectrum analysis (SSA). The main feature of the method is that it applies Prin-cipal Component Analysis (PCA) to the lagged time series, obtained from the measured structural vibration response. In this study the methodology is developed for the case of a free decay response. The measured acceleration vectors are transformed into the fre-quency domain and then used to define a trajectory matrix. The covariance matrix of the trajectory matrix is decomposed into new variables, the Principal Components (PCs). They define a new space of linearly correlated variables onto which the dynamics/motion of the system can be projected. This decomposition is used to uncover oscillation patterns among other purposes. The method is applied and demonstrated for the case of a simple 2-DoF system. To demonstrate its capabilities for damage diagnosis different levels of stiffness reduction are introduced. The first two PCs are used to visually demonstrate the abilities of the methodology. The Mahalanobis distance is used to develop a classifica-tion system to detect and localize delaminaclassifica-tion in the 2-DoF system. The results clearly demonstrate the capabilities of the system to clearly detect and localize damage.
KEYWORDS: Composite Materials, Delamination, Singular Spectrum Analysis, Statistical Pattern Recognition, Damage assessment
INTRODUCTION
The growth in aerospace and other sectors of engineering placed composite materials at the forefront of the contemporary research. Modern structures typically require the use of lightweight and strong materials, which demand high level of performance combined with greater efficiency. Composites are generally implemented in structures with tremendous engineering requirements and their nature depends on the material composition. This presents one of the biggest advantages of composites, they combine the advantageous properties of two or more materials. The design, the analysis and the production of such materials require a high level of knowledge and expertise in different engineering areas. However, composites also have some disadvantages, delamination. Damage and delamination in composite structures affects adversely the system’s performance which makes Structural Health Monitoring (SHM) a must for such materials and structures. The development of a proper structural health monitoring system has a crucial importance for such structures because they are impossible to repair and very difficult to monitor for defects.
non-linear dynamics and they utilise Takens theorem [2] according to which, any dynamic system can be fully reconstructed in a space made of lagged components of its measured time series. Thus, if one is able to measure a time dependent variable from a vibrating structure e.g its displacement or acceleration, the lagged components of this time series can be used to make a new space in which its behaviour can be analysed and ultimately reconstructed.
In practice most purely data-based methodologies make use of data analysis and utilise different statistical methods and characteristics. One of those methods is Principal Component Analysis (PCA) which is utilized for compressing and reducing the dimension of the data. PCA is used as an optimal linear tool and it have been extensively utilised in structural dynamics for modal analysis [3], reduce-order modelling [4], model updating of non-linear systems [5] and damage detection [6]. However PCA assumes that original measured variables are uncorrelated whilst time series elements like accel-eration or displacement in discrete time are generally correlated. That is why in this paper an extension of PCA, known as Singular Spectrum Analysis (SSA) is studied [7], which is particularly developed for non-independent data. SSA can be applied in time and frequency domain [8] where the data is better organised. SSA can be applied for linear as well as for non-linear vibratory systems [2]. SSA uses the same procedure as PCA methodologies which project the original data onto a new space with smaller dimension. This new space is made of the lagged signal components. Differently from tradi-tional spectrum analysis, SSA is able to uncover rotatradi-tional periodicities at any frequency. Thus, in a certain sense it can be applied for the purpose of modal analysis for non-linear vibrating structures [9]. By using a certain number of components, a reconstruction of the original signal can be obtained with a very high accuracy. The original signal is projected onto the space created by reconstructed components (RCs) by selecting the first several RCs with the highest variance. PCA can be also used for classification purposes, thus when there are different categories in the measured data PCA is likely to facilitate the distinction among these. In this study, SSA and the Mahalanobis distance is combined to develop a classifier for the purposes of damage detection an localization in a 2-DoF system. The combination of the two methodologies demonstrates the capabilities of the system to clearly detect and localize damage.
1. SINGULARSPECTRUMANALYSIS FOR DAMAGE ASSESSMENT
In this section SSA is introduced with relation to structural dynamics and damage assessment. The suggested methodology for damage assessment is derived and explained.
1.1 Methodology
The data collected was made up from the acceleration response measured on a simulated system. Multiple realisations of the acceleration response were measured and gathered into a vector xi =
(xi1,xi2, ...,xij, ...,xiN)0wherei=1,2, ...,Mis the number of realisations and j=1,2, ...,Nis the number of components in each signal.
The acceleration response signal corresponding to each realisation was transformed into the fre-quency domain. In this way the spectral data matrixZ= (z1,z2, ...,zi, ...,zM)was obtained.
ˇ Zi=
zi1 zi2 z3i · · · ziw · · · zWi zi2 zi3 zi4 · · · ziw+1 · · · ziW+1 zi3 zi4 zi5 · · · ziw+2 · · · ziW+2 zi4 zi5 zi6 · · · ziw+3 · · · ... zi5 zi6 ... · · · ... · · · ziN0
zi6 ... ... · · · ziN0 · · · 0
..
. ... ziN0 · · · 0 · · · 0
..
. ziN0 0 · · · 0 · · · 0
ziN0 0 0 · · · 0 · · · 0
(1)
wherei=1,2, ...,M,w=1,2, ...,W andN0= N2. All the matrices ˇZi were collected to make a new matrix defined as ˇZ= (Zˇ1,Zˇ2, ...,Zˇi, ...,ZˇM).
At the next step, the covariance matrix of the matrix ˇZ was obtained following the Equation bellow.
CZ= ˇ Z0Zˇ
N0 (2)
The eigenvaluesλk and the eigenvectorsρk ofCZwere obtained according to the following ex-pression.
CZρk=λkρk (3)
The eigenvalues λk were then ordered in the diagonal matrixΛΛΛZ in decreasing order and the matrixEZcontains their corresponding eigenvectorsρkwritten as columns. TheEZvectors are called Empirical Orthogonal Functions (EOFs) and they contain the data as adecompositioninto orthogonal basis. The eigenvalues define the partial variance of each eigenvectors, therefore the total sum of all of these variances gives the total variance of ˇZ.
E0ZCZEZ=ΛΛΛZ (4)
The measured data ˇZwas projected onto the matrixEZ, which yields the corresponding Principal Components (PCs) matrixA=ZEˇ Z.
A matrix which contains the projection of the PCs in to the new space was created toreconstruct the signal. The Reconstructed Components (RCs) were obtained according to the Equation (5). For a given set of indices K corresponding to a set of PCs, the RCs were obtained by projecting the corresponding PCs onto the EOFs, as it is shown in the Equation 5.
Rkm,n= 1
W W
∑
w=1Akn−wEmk,w (5)
1.2 Projection. Clustering effect
The oscillatory responses of the system were decomposed using a certain number of RCs. Each one contains a certain percentage of variance provided by the EOFs. The projection of the original data onto the RCs can be modelled as a single point [10]. The points into the new space created by the orthogonal basis (EOFs) gave the coordinates of the projection of the original dataZin the RCs. The coordinates characterize the vibratory responses on a point. The information contained within these projections was utilised as pattern recognition features for the classification purposes. The components containing more of the variance of the initial signal have more information. Therefore, they contain most of the information about the changes in the vibratory system. This projection was developed following the Equation 6.
T=hZ,Ri (6)
where Z is the original frequency signal matrix and the matrix R contains the reconstructed components.
1.3 Mahalanobis distance
The Mahalanobis distance measures the relative distance from a data set of points, denoted as obser-vation data, to a common points, denoted as reference data. The Mahalanobis distance considers the correlation of the data set, therefore it can be perfectly used to multivariate data sets. In this partic-ular study, the combination of the Mahalanobis distance and SSA methodology was developed. The projection obtained in §1.2 were used as pattern recognition features for the classification purposes. The use of the Mahalanobis distance offers the possibility to consider more components from the SSA decomposition. It can increase the information needed for the correct classification.
The Mahalanobis distance is described by the following Equation 7.
DM(TR) =
q
(TO−µR)TS−1R (TO−µR) (7)
whereDM(TR) is the Mahalanobis distance to the reference data setTR, TO is the observation data,µRis the means of theTRandSRis the standard deviation ofTR.
2. EXAMPLE APPLICATION: 2DOFNONLINEAR SPRING-MASS-DAMPER SYSTEM.
The evaluation of the methodology was applied in a 2-DoF system with a nonlinear spring connecting two mass, the schematic system is shown in the Figure 1 and it is described by the Equation 8
[image:4.595.163.435.580.679.2]PRODUCED BY AN AUTODESK EDUCATIONAL PRODUCT
Figure 1 : 2-DoF spring-mass damper with non-linear stiffness system
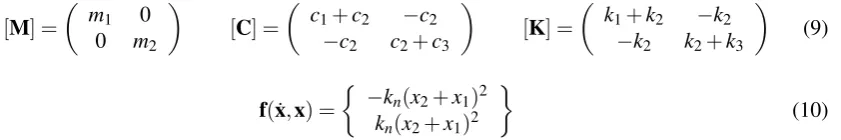
where[M],[C],[K]are constant coefficients mass, damping and stiffness matrices respectively defined by the Equation (9). The functionf(x˙,x)provides a quadratic coupling between masses and it is defined by Equation (10).
[M] =
m1 0
0 m2
[C] =
c1+c2 −c2
−c2 c2+c3
[K] =
k1+k2 −k2
−k2 k2+k3
(9)
f(x˙,x) =
−kn(x2+x1)2
kn(x2+x1)2
(10)
The value of the parameters corresponding to the initial conditions (without any stiffness reduc-tion) are detailed in the Table 1. These values simulate the system as healthy. An initial velocity in the m2 was applied to simulate an impulse. The system describe a free-decay response and the
[image:5.595.104.525.153.223.2]acceleration was recorded by each instant of time.
Table 1 : Baseline values of the system. Parameters considered in the simulation as Healthy system
Parameter Value
x(01)=x(02) 0m ˙
x(01) 0m/s2 ˙
x(02) 1m/s2 k1=k2=k3 2000N/m
kn 10000N/m
c1=c2=c3 6Nm/s
m1=m2 5kg
The 2-DoF system was modified by different levels of stiffness reduction which affect in the vibratory response of the whole system. The reduction of the stiffness was applied toknby 10%,20% and 30%. The acceleration was recorded at any instant of time for each reduction ofkn. In this paper is demonstrated the sensitivity of the methodology and the capability to detected small changes into a dynamical system. The small changes induced by the reductions ink1andk2were easily detected, as it
is shown in [11]. However, the changes in theknstiffness generated misclassification. This particular paper analyse the effect of nonlinear quadratic stiffnessknon the vibratory response.
The acceleration was recorded from the free-decay response of the system by the integration of the Equation (8). The resolution of the signal was obtained usingN=2048 sampled points at a sampling interval of∆t=0.00125s.
Ten realizations were obtained for each system by adding random white Gaussian noise at 20dB in: Without stiffness reduction (Healthy) , 10% reduction ofkn, 20% reduction ofknand 30% reduction ofkn.
SSA was then applied in the ten signals of the Healthy system with a window size ofW=7. The decomposition and their posterior reconstruction components were obtained to describe a new space where the data, from the different reductions ofkn, was projected following the methodology defined in§1.2 and§1.3.
3. RESULTS
components, in terms of variance, does not provide further information, hence they can be ignored. This judgement can be observed in the Figure 3(a) where the reconstructed signal was built by two components, and in Figure 3(b) where the reconstructed signal was built by four components. The use of more components increase the accuracy in the reconstruction of the signal.
Figure 2 : Variance decomposition diagram based on the Healthy system. The graph shows the variance of only 15 components of 80.
0 50 100 150
−0.1 0 0.1 0.2 0.3 0.4 0.5 0.6 0.7 0.8 0.9
|
Y
|
(
m
/
s
2)
ω(Hz)
Original RC1−2
(a) Reconstruction signal using two components
0 50 100 150
−0.1 0 0.1 0.2 0.3 0.4 0.5 0.6 0.7 0.8 0.9
|
Y
|
(
m
/
s
2)
ω(Hz)
Original RC1−4
[image:6.595.103.491.406.563.2](b) Reconstruction signal using four components
Figure 3 : Comparison between original and reconstructed signal for a Healthy system. The frequency scale has been limited to 150Hzfor visualization issues. The original scale reaches until 400Hz.
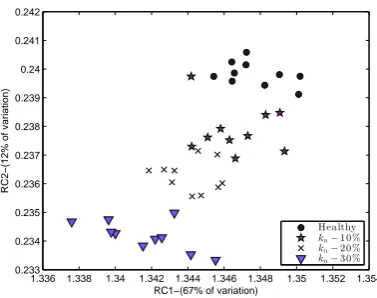
The projection of the original signal onto the reconstructed components is traduced in a point onto the coordinates axes in the new space, as it is described in§1.2. A good cluster visualization was obtained by using only the two first components which contain 67% of variance. It can be observed in Figure 4.
1.336 1.338 1.34 1.342 1.344 1.346 1.348 1.35 1.352 1.354 0.233 0.234 0.235 0.236 0.237 0.238 0.239 0.24 0.241 0.242
RC1−(67% of variation)
RC2−(12% of variation)
Healthy
kn−10%
kn−20%
[image:7.595.193.382.115.264.2]kn−30%
Figure 4 : Clustering effect in the reduction ofkn. Projection onto the two first Reconstructed components, RC1
and RC2.
Healthy Kn−10% Kn−20% Kn−30% Healthy
Kn−10%
Kn−20%
Kn−30% %Ac
cu ra cy ba se d on M a h a la no bi s d is ta nc e 0 10 20 30 40 50 60 70 80 90 100
(a) Considering the projection onto two RCs
Healthy Kn−10% Kn−20% Kn−30% Healthy
Kn−10%
Kn−20%
Kn−30% %Ac
cu ra cy ba se d on M a h a la no bi s d is ta nc e 0 10 20 30 40 50 60 70 80 90 100
(b) Considering the projection onto three RCs
Healthy Kn−10% Kn−20% Kn−30% Healthy
Kn−10%
Kn−20%
Kn−30% %Ac
cu ra cy ba se d on M a h a la no bi s d is ta nc e 0 10 20 30 40 50 60 70 80 90 100
[image:7.595.196.394.531.674.2](c) Considering the projection onto four RCs
4. CONCLUSIONS
An analytical study consisting of the reduction of stiffness in a 2-DoF system has been conducted to examine the effectiveness of SSA and Mahalanobis distance for damage detection and classification. The idea of this study is to apply SSA algorithm to the raw acceleration response for a better data compress analysis. The SSA algorithm was applied to reduce the dimension of the response of vibra-tion and extract the only essential features. The data was then projected on the new space based on the two first reconstructed components of the healthy system, which contain the majority of the vari-ance. The clustering effect was strongly demonstrated between different categories. Furthermore, the Mahalanobis distance was applied in the data-compressed obtained by SSA. The classification was improved using more reconstructed components. To conclude, one can envision that the methodol-ogy proposed can combine both the SSA data-compress algorithm and Mahalanobis distance towards damage detection and classification. The methodology guarantees the detection of a small changes in dynamical systems and it is proposed for detecting the non-linear changes in composite laminated beams by the behaviour of delamination.
REFERENCES
[1] Scott W Doebling, Charles R Farrar, Michael B Prime, et al. A summary review of vibration-based damage identification methods. Shock and vibration digest, 30(2):91–105, 1998.
[2] DS Broomhead and Gregory P King. Extracting qualitative dynamics from experimental data. Physica
D: Nonlinear Phenomena, 20(2):217–236, 1986.
[3] F Bamer and C Bucher. Application of the proper orthogonal decomposition for linear and nonlinear structures under transient excitations. Acta Mechanica, 223(12):2549–2563, 2012.
[4] Luis E Mujica, J Vehi, Magda Ruiz, Michel Verleysen, Wieslaw Staszewski, and Keith Worden. Mul-tivariate statistics process control for dimensionality reduction in structural assessment. Mechanical
Systems and Signal Processing, 22(1):155–171, 2008.
[5] A-M Yan, Ga¨etan Kerschen, P De Boe, and J-C Golinval. Structural damage diagnosis under varying en-vironmental conditionspart ii: local pca for non-linear cases.Mechanical Systems and Signal Processing, 19(4):865–880, 2005.
[6] Seunghee Park, Jong-Jae Lee, Chung-Bang Yun, and Daniel J Inman. Electro-mechanical impedance-based wireless structural health monitoring using pca-data compression and k-means clustering algo-rithms. Journal of Intelligent Material Systems and Structures, 19(4):509–520, 2008.
[7] Nina Golyandina, Vladimir Nekrutkin, and Anatoly A Zhigljavsky. Analysis of time series structure:
SSA and related techniques. CRC Press, 2010.
[8] David S Stoffer. Detecting common signals in multiple time series using the spectral envelope. Journal
of the American Statistical Association, 94(448):1341–1356, 1999.
[9] Robert Vautard and Michael Ghil. Singular spectrum analysis in nonlinear dynamics, with applications to paleoclimatic time series. Physica D: Nonlinear Phenomena, 35(3):395–424, 1989.
[10] Barry Simon. Methods of Modern Mathematical Physics: Functional Analysis, volume 1. Gulf Professional Publishing, 1980.
[11] David Garcia and Irina Trendafilova. A multivariate data analysis approach towards vibration analysis and vibration-based damage assessment. application for delamination detection in a composite beam.