City, University of London Institutional Repository
Citation
:
Slabaugh, G. G., Fang, T., McBagonluri, F., Zouhar, A., Melkisetoglu, R., Xie, H. and Unal, G. B. (2008). 3-D shape modeling for hearing aid design. IEEE Signal Processing Magazine, 25(5), pp. 98-102. doi: 10.1109/MSP.2008.926653This is the accepted version of the paper.
This version of the publication may differ from the final published
version.
Permanent repository link:
http://openaccess.city.ac.uk/4387/Link to published version
:
http://dx.doi.org/10.1109/MSP.2008.926653Copyright and reuse:
City Research Online aims to make research
outputs of City, University of London available to a wider audience.
Copyright and Moral Rights remain with the author(s) and/or copyright
holders. URLs from City Research Online may be freely distributed and
linked to.
3D Shape Modeling for Hearing Aid Design
Greg Slabaugh, Tong Fang, Fred McBagonluri, Alexander Zouhar, Rupen Melkisetoglu, Hui Xie, Gozde Unal
According to recent estimates, hearing loss affects approximately 314 in 1000 adults over
the age of 65. While there are many causes of hearing loss, including genetic factors, disease,
trauma, and exposure to damaging noise, the most common treatment is a hearing aid. Since a
patient typically uses a hearing aid for many hours during the day, it must be comfortable to wear.
Hearing aids are typically custom-made to match the three-dimensional (3D) geometry of the
patient’s ear in order to achieve a comfortable fit.
This article presents a software-based approach to interactive 3D shape modeling for
geometric design of hearing instruments. We review various shape modeling operations that
transform a raw impression to the final shape of the hearing aid device. In addition, we present
state-of-the-art methods for automating the design process.
HEARING AIDS
Anatomical Perspective
When designing a hearing aid, surface manipulations are often carried out with respect to
anatomical features of the ear. In Figure 1 (a) and (b), we simultaneously an image of a right ear
along with an impression (described below) to show the major relevant features. The canal is top-most portion of the surface and is the part that goes inside the ear canal. The aperture is a plane that separates the inner ear and the outer ear. The tragus is the small flap of cartilage near the aperture. Across from the tragus is the anti-tragus. The tragus and anti-tragus are protrusions of the ear geometry so they appear as indentations on the impression. Between the tragus and
anti-tragus is the notch. Also near the aperture, the concha is the bowl-shaped cavity that appears as a hump on the impression. The crus is a ridge of cartilage on the ear and appears as a valley on the impression. The cymba is an indented region next to the crus, while the anti-cymba is the flap of cartilage above the cymba in the picture of the ear. On the impression, the cymba is a protrusion
Figure 1. Major anatomical features of the outer ear.
Engineering Perspective
Hearing aid design is complex, as each patient has different ear geometry, and based on the
extent of the patient’s hearing loss, different electronic components are required. As a result,
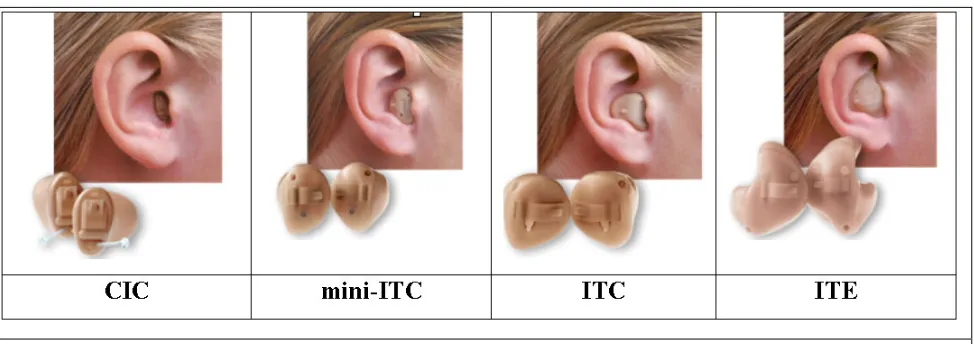
hearing aids come in a variety of types, as shown in Figure 2, including completely in the canal
(CIC), in the canal (ITC), and in the ear (ITE) devices. For discretion, patients who experience
hearing loss typically prefer CIC hearing aids. However, more severe loss requires larger hearing
aids to house larger electronic components.
Figure 2. Different types of hearing aids. From left to right: CIC, mini-ITC, ITC, ITE.
Design and manufacturing
Historically, hearing aids were made through a tedious manual process that was highly
operator dependent and error-prone. Within the last five years, advances in 3D scanning
[image:3.612.66.553.421.593.2]hearing aid manufacturing. Today, a large percentage of hearing aids are produced using
software-based systems. The process begins at an audiologist’s office, where thermosetting material is
placed into the patient’s ear. The material hardens, taking the shape of the patient’s ear, and is
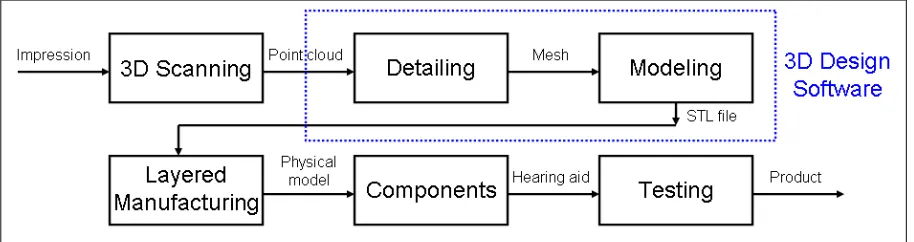
removed. This mold, or impresion, is then scanned using a projected light scanner, which captures the 3D impression geometry as a point cloud, sent electronically to the manufacturing site. The
impression is loaded into 3D design sofware and the surface is processed in two steps: detailing, and
modeling, described below. The final surface is output as a stereo-lithography (STL) file, which is
then built into a physical model a layered manufacturing system. After the electronic components
are added and the hearing aid is tested for quality assurance, the final product is shipped to the
[image:4.612.59.516.272.393.2]customer. The block diagram for the overall process appears in Figure 3.
Figure 3. Overall block diagram for hearing aid manufacturing, from the impression to the
final product. This article considers the 3D Design Software in the dotted box.
Challenges
There are numerous challenges facing the design and development of 3D hearing aid
software. First, ear geometry vary dramatically from person to person, and therefore the software
must be robust to this variation. The final device should be as small as possible and must fit inside
the original impression. Since existing tools are interactive, computational performance is critical
so that operators do not wait significantly when working with the data.
Previous work
Previous attempts to apply computed-aided design (CAD) principles hearing instrument
design relied on multiple general-purpose 3D software systems, including Parasoid and CATIA.
Such approaches took approximately 20-25 minutes to model one complete hearing instrument.
Subsequently, hearing-aid specific software, like Materialise MagicsRSM addressed the modeling
first all-encompassing detailing and modeling technology with an artificial intelligence basis for
hearing instrument design [4].
SIGNAL PROCESSING OF 3D SHAPES IN HEARING AID DESIGN
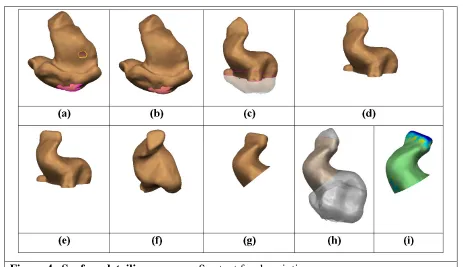
We begin with a description of the detailing operations, which reduce the impression to the
shape of the hearing aid as depicted in Figure 4.
Detailing
Triangulation and topology correction
The first step of the detailing process is surface reconstruction, which transforms the point
cloud into a polygonal mesh, which is easily rendered with graphics hardware and supports queries
about neighborhood geometry. Surface reconstruction is a classic problem in computer graphics,
and several well known solutions exist, including power crust [1] and ball pivoting [2]. After
triangulation (Fig. 4a), it is possible that small holes exist on the surface. Holes are easy to locate,
since at a hole an edge connecting two vertices will only be part of one face. By grouping such
edges together, connected hole contours are detected and then filled using constrained Delaunay
triangulation (Fig. 4b). After hole filling, the resulting surface is a two-manifold with a boundary at
the base of the surface.
Interactive Surface Manipulation Tools
In the detailing process, interactive surface manipulation tools allow the operator to
transform the surface into a hearing aid shape.
Smoothing tools
Smoothing is available at any time in the detailing process. Smoothing tools rely on a
Laplacian smoothing algorithm that is sensitive to the convexity of the surface. In particular, they
locally deform mesh vertices using the equation
where vi is a mesh vertex to be smoothed,
λ
iis a diffusivity coefficient that controls the degree ofis the discrete Laplacian operator that determines a displacement Li using the M vertices vj in the
(one-ring) neighborhood of vi, and
is an indicator function that determines if the displacement is inward using Ni, the surface normal at
vi. Outward displacements are avoided to ensure the deformed surface fits inside the original
impression. Note that Equation 1 is simply a discretized form of the heat equation. By integrating
this equation over time, the high frequencies on the mesh become dispersed, while the main surface
shape, represented by the lower frequencies, is largely unaffected.
Cutting tools
The bottom of the impression is cut with a plane that passes through the tragus, anti-tragus,
and anti-cymba, (Figs. 4c and 4d). For ITE models, this defines the length of the hearing aid. Then,
the canal is tapered at the tip (Fig. 4e), using cutting and Laplacian smoothing. For ITE devices, a
cut is applied to remove part of the cymba, while for CIC and ITC devices, a cut applied at the crus
completely removes the cymba (Fig. 4f). Using the Laplacian smoothing algorithm, local inward
deformations are applied along the crus in for ITE. Finally, for CIC devices, a cut is applied at the
[image:6.612.55.518.415.682.2]aperture so that the device is completely in the canal (Fig. 4g).
Virtual cast and color mapping
The software can provide a virtual cast, which renders the original impression transparently
along with the detailed surface (Fig. 4h). With this visualization, the operator can check the quality
of the detailed surface, as well as visualize the distance between the detailed shape and the
impression (Fig. 4i). Distance queries between a vertex on the detailed surface and the impression
surface are efficiently processed using a k-d tree [5].
Modeling
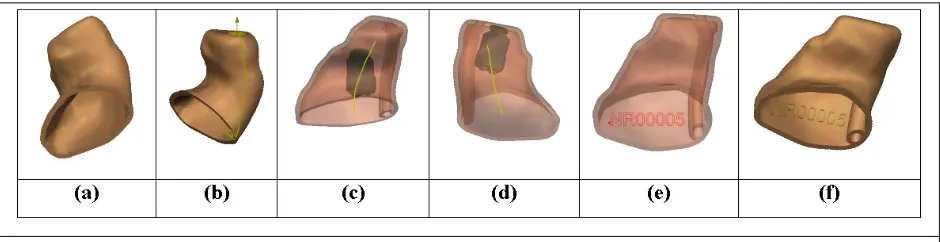
After detailing, the surface has the shape of a hearing aid. The modeling process, depicted
in Figure 4, considers the components that are placed inside the device.
Thickness and vent
The first step of modeling is to add thickness, which is typically uniform and achieved by
computing an offset surface (inner wall) from the surface from detailing (outer wall). A connecting
surface stitches the inner wall and outer wall together, and topologically, the resulting surface S is a manifold without boundary (Fig. 5a). The next step is to add a vent, which is a tubular structure
that runs the length of the hearing aid. The vent allows air to pass through the hearing aid so that
when inserted, the air pressure inside the patient’s ear canal will match the ambient air pressure
outside the ear. A surface path is determined on the outer wall using a curvature-weighted geodesic
algorithm between a point on the canal tip and on the base of the impression (Fig. 5b). From this
path, two tubular surfaces are generated, forming an inner wall I, and an outer wall O of the vent. Using Boolean operations, the vent is attached, shown in Fig. 5c, usingS'=(S−I)UO, where “–“
is a mesh difference operator and “U” is a mesh union operator. Boolean operations permit logical
combinations of meshes.
Components and labeling
The hearing aid contains several components, including a battery, microphone, amplifier,
receiver, and faceplate. The receiver converts the amplified electrical signal into an acoustic signal
for transmission into the ear. It is desirable to place the receiver as far up the canal as possible.
However, the geometry of the surface limits the receiver placement. An automatic receiver
placement tool searches the 6D space of translations and rotations of the receiver and places the
receiver at its optimal location and orientation, as shown in Fig. 5d. A 3D text label is applied to
with Boolean operations onto the surface (Fig. 5e and 5f). If the receiver touches the inner wall of
[image:8.612.60.530.105.226.2]the surface or label, the surface is locally deformed to accommodate the components.
Figure 5. Modeling process. See text for description.
AUTOMATION OF DETAILING AND MODELING
Automating the design of hearing aids increases operator efficiency as well as the
reproducibility of design.
Binaural processing
A large percentage of patients experiencing hearing loss require two hearing aids; one for
the left ear and another for the right. Typically, the left and right ear impressions are largely
symmetric with mirror symmetry. Therefore, binaural processing allows an operator to apply
detailing and modeling operations on a left (right) impression, and automatically have the
operations applied with mirror-symmetry to the right (left) impression. This requires accurate
registration between the impressions. First, one mesh is transformed to have mirror symmetry, by
multiplying all vertices by a matrix
− = 1 0 0 0 1 0 0 0 1
M . Then, registration between two shapes can
be achieved using iterated closest points (ICP). For proper convergence, ICP requires a good initial
alignment. One way to estimate the initial rotational alignment is to construct extended Gaussian
images (EGIs) [6], which are translation-independent orientation histograms formed over
T
]^ , [θ φ
α = by binning a mesh’s surface normals in spherical bins. Two EGIs can then be
efficiently cross-correlated to estimate the rotational shift that brings them into alignment using
(4)
transform [3], Equation 4 can be efficiently implemented in the frequency domain. The peak of
G(R) indicates the rotational shift that will align the two meshes. Then, to estimate the translational
alignment, a similar procedure is formed using 3D histograms formed in x, y, z and the standard
cross-correlation operator, also implemented in the frequency domain, but using the standard 3D
Fourier transform.
Feature recognition
Most of the operations applied in detailing and modeling are based on the anatomic features
of the ear impression. Therefore, automatic recognition of these features enables automation of
detailing and modeling. One way to recognize features is through analysis of contours that intersect
parallel planes running through the shell. For example, the aperture can be detected by looking for
a large increase in contour area going from the canal tip to the base of the impression. Any
triangles above the aperture are part of the canal. Forming a polyline through the contour centroids
gives a rough centerline. The tragus, anti-tragus, and anti-helix can be found by studying the
curvature of contours near the base of the impression. Other features can be found using similar
[image:9.612.63.563.391.530.2]geometric analysis. See Figure 6 (a) and (b) for an example.
Figure 6. Feature detection and surface segmentation. Contours generated from slicing planes (a)
and analyzed in (b) to find the canal tip (top most point), aperture (blue contour), concha (red point),
anti-tragus (green point near bottom), anti-cymba (purple point). Atlas surface (c) and automatically
segmented surface (d). Colors correspond to those in Figure 1.
Surface segmentation
Feature recognition determines individual points or planes. However, sometimes regional
information of impression is useful. Surface segmentation determines a unique label for each vertex
unlabeled surface are compared using a shape descriptor, such as the shape context [7] (log polar
spherical histogram of points), to vertices on the labeled atlas. In this way, the labels from the atlas
can be transferred to the new surface. See Figure 6 (c) and (d) for an example.
Outlook
Advances 3D scanning and fabrication hardware as well as 3D geometric design software
have transformed a once labor-intensive manual manufacturing into an efficient digital process for
hearing aid design, resulting in higher quality, reduced cost, and better fitting devices. Future work
in this field will continue to focus on increasing automation until the process is fully automatic.
Greg Slabaugh, [email protected], is a Project Manager at Siemens Corporate Research in
Princeton, New Jersey.
Tong Fang, [email protected], is a Program Manager at Siemens Corporate Research.
Fred McBagonluri, [email protected], is the Director of Research and Development
at Siemens Hearing Instruments in Piscataway, New Jersey.
Rupen Melkisetoglu, [email protected], is a Research Scientist at Siemens
Corporate Research.
Alexander Zouhar, [email protected], is a Research Associate at Siemens Corporate
Research.
Gozde Unal, [email protected], is an Assistant Professor at Sabanci University in
Istanbul, Turkey.
References
[1] Nina Amenta, Sunghee Choi and Ravi Kolluri, “The power crust, unions of balls, and the
medial axis transform,” Computational Geometry: Theory and Applications, 2001, 19:(2-3), pages 127-153.
[2] F. Bernardini, J. Mittleman, H. Rushmeier, C. Silva, and G. Taubin, “The Ball-Pivoting
Algorithm for Surface Reconstruction,” IEEE Transactions on Visualization and Computer Graphics, 5(4):349-359, 1999.
[4] Martin Masters, Therese Velde and Fred McBagonluri (2006), “Rapid Manufacturing in the
Hearing Industry, In Rapid Manufacturing Technologies: The Next Industrial Revolution,” Eds. Neil Hopkinson, Richard Hauge (Editor), Phillip Dickens, Rupert Soar. John Wiley and Sons;
New York, NY.
[5] Cormen, T. H., Leiserson, C. E., Rivest, R. L., Introduction to Algorithms. The MIT Press; 2nd Edition, 2001.
[6] A. Makadia, A. Patterson, and K. Daniilidis, “Fully Automatic Registration of 3D Point
Clouds,” Proc. CVPR 2006.
[7]S. Belongie, J. Malik, and J. Puzicha, "Shape Matching and Object Recognition Using Shape