Water Distribution Network Optimization Using Maximum
Entropy under Multiple Loading Patterns
Anna M. Czajkowska and Tiku T. Tanyimboh
Department of Civil Engineering, University of Strathclyde Glasgow, John Anderson Building, 107 Rottenrow, Glasgow G4 0NG, UK
E-mail: [email protected]; [email protected]
Abstract
This paper proposes a maximum-entropy based multi-objective genetic algorithm approach for the design optimization of water distribution networks. The novelty is that in contrast to previous research involving statistical entropy the algorithm can handle multiple operating conditions. We used NSGA II and EPANET 2 and wrote a subroutine that calculates the entropy value for any given water distribution network configuration. The proposed algorithm is demonstrated by designing a 6-loop network that is well known from previous entropy studies. We used statistical entropy to include reliability in the design optimization procedure in a computationally efficient way.
Keywords
Multiple operating conditions; reliability based multi-objective evolutionary optimization; statistical entropy; water distribution systems
INTRODUCTION
The optimal design of water distribution networks (WDNs) is recognised in the literature as an NP-hard problem, mostly due to the discrete pipe sizes and nonlinear pipe head loss-discharge relationship. To solve the problem, researchers proposed many different methods, such as linear programming, heuristic methods and evolutionary techniques in the last decades. Overall, the widely used genetic algorithms (GAs) appear to be efficient in handling discrete commercial pipe sizes.
1991; Tanyimboh and Templeman, 1993) which therefore increases the reliability. Also, Tanyimboh and colleagues (Tanyimboh and Templeman 2000 and Tanyimboh et al. 2011) demonstrated strong positive correlation between entropy and reliability and between entropy and failure tolerance. A comparison of entropy and other surrogate reliability measures can be found in Tanyimboh et al. (2011).
A lot of the work has been done for a single operating condition (SOC) that corresponds to the peak demands while in reality demands vary with time and there are many different loading patterns that have to be satisfied by the network. Alperovits and Shamir (1977) suggested that when designing the WDN, not only maximum daily demand and fire flow should be included, but also the minimum demand periods have to be considered. In addition, Prasad (2010) proved that even if a network satisfies peak demands it does not follow that other operating conditions will be satisfied, as the pressure constraints might not be satisfied. Prasad (2010) also demonstrated that designs obtained using multiple operating conditions (MOC) are more reliable than the ones achieved using SOC.
Very recently, Czajkowska and Tanyimboh (2012) presented some initial results for a reliability-based approach that combines the least cost design using discrete commercial pipe sizes with statistical entropy maximization for WDNs. The procedure was for both SOC as well as MOC. The algorithm was tested on a well known, although very simple, 2-loop network. The results achieved demonstrate that solutions obtained using MOC outperform the solutions based on SOC in terms of hydraulic feasibility, pipe size distribution and reliability. The aim of this paper is to investigate further the MOC approach and the effect of discrete commercial pipe sizes on the entropy-reliability relationship.
METHODS
The following is the proposed optimization model for a water distribution network design. The objectives considered are minimisation of the network’s initial cost and maximization of entropy. The optimization problem was solved using a multi-objective genetic algorithm. A major problem associated with genetic algorithms is the poor ability to handle constraints. This is often addressed by penalizing infeasible solutions, which can lead to suboptimal designs. To avoid this issue we developed a model that does not involve constraint violation penalties. The overall problem formulation can be summarised as follows.
Minimization of Network Cost
The objective function used to minimize the network cost is formulated as
e ij ij
ij
D
L
Cost
=
γ
∑
(1)where γ is a cost coefficient taken as 800, Lij is pipe length in metres, Dijis the pipe diameter in
metres and e is a constant taken as 1.5. The above objective is subject to following constraints: 1. Energy conservation and nodal mass balance, which are satisfied externally by EPANET 2; 2. Discrete pipe sizes selected from a set of commercially available sizes;
3. In order for the design to be feasible, the pressure at the critical node must be greater than or equal to the desired pressure at that node. This hydraulic feasibility constraint was introduced as one of the design objectives as stated below.
Minimization of Critical Node Pressure Deficit
i des
i H
H Deficit= −
;
des i
i H
H <
where i is the critical node; Hi is the available head at node i; and Hides is the desired head at node i.
The critical node is the node with the lowest pressure within the network and the desired head is the nodal head above which the demand is satisfied in full.
Maximization of Entropy
Given the pipe flow rates, the entropy function can be written as (Tanyimboh and Templeman, 2000) + − − =
∑
∑
∑
∈ =∉ i Nj j
ij j ij j j j j J j j IN j j j T q T q T Q T Q T T T Q T Q K S ln ln 1 ln 1 (3)
where S is the entropy, K is an arbitrary positive constant often taken as 1. IN represents the set of source nodes and J the number of nodes. T is the total supply and Tj the total flow reaching node j.
Also, Qj represents the nodal demand if the node in question is a demand node or the supply if the
node is a supply node; qij is the flow rate in pipe ij; and Nj represents all the upstream nodes that
have pipes connected to node j.
We used the non-dominated sorting genetic algorithm NSGA II (Deb, 2002). The code was modified and coupled with the hydraulic simulation software EPANET 2 (Rossman, 2002) that satisfies the conservation of mass and energy equations. Entropy was incorporated within the genetic algorithm as a measure of network reliability. We wrote the code for a subroutine to calculate the entropy for any given network configuration.
The genetic algorithm (GA) developed can work for any number of loading patterns. Therefore, it can handle the commonly used SOC also. The algorithm ensures that all loading patterns are satisfied by simulating each operating condition using EPANET 2. The GA chooses the worst case node pressure deficit across all loading patterns. So if the nodal pressure for any loading pattern is lower than the desired pressure, then the design is treated as infeasible. In the case of entropy, intuitively, a number of alternatives may be considered including:
- Maximising the total entropy; - Maximising the minimum entropy; - Maximising the maximum entropy.
The approach presented in this paper is based on the maximisation of the total entropy. In order to achieve the total entropy value, the individual values are added together within the algorithm. This reflects the possibility that different designs can have the same entropy value for some of the operating conditions. It is thought that the more the number of operating conditions involved the lower the chances that all corresponding entropy values will be identical for two different designs. Research on this issue is still in progress.
The termination criterion for the GA was taken as 200,000 function evaluations (i.e. 1000 generations for a population size of 200) for both SOC and MOC. The probability of crossover and mutation were set to 1.0 and 0.0147 respectively.
and only non-dominated solutions were chosen. This approach provided a good range of candidate solutions for further consideration.
Finally, the solutions obtained in this way underwent pipe failure simulations to evaluate reliability and pipe failure tolerance. We used the pressure dependent WDN analysis program PRAAWDS (Program for the Realistic Analysis of the Availability of Water in Distribution Systems) developed by Tanyimboh and Templeman (2010) that has been used successfully in previous studies. The reliability definition we used is the ability of the system to fulfill on average the required nodal demands at adequate pressure whilst considering both normal and abnormal operating conditions (Tanyimboh and Templeman 2000). The pipe failure tolerance measure provides an estimate of the total demand the WDN is capable of satisfying when some components are out of service. The importance of including failure tolerancein addition to reliability for a better representation of the network performance has been demonstrated in Tanyimboh and Kalungi (2009).
Sample Network
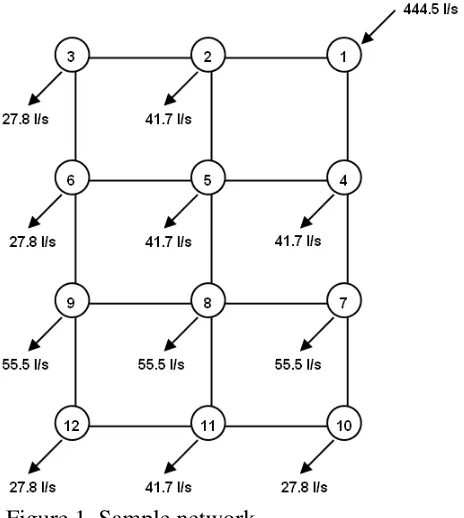
To illustrate the application of entropy under MOC, a hypothetical 6 loop network (Figure 1) was selected. It was first presented by Awumah
et al. (1991) and consists of 12 nodes, 17 pipes and single source with total head at 100m. The elevation and minimum head at all demand nodes are 0m and 30m, respectively. All pipes are 1000m long and have a Hazen-Williams roughness coefficient of 130. A set of 12 commercially available pipe sizes in the range of 100mm to 600mm was used (100, 125, 150, 200, 250, 300, 350, 400, 450, 500, 550, 600). Having 17 different pipes with 12 possible pipe diameters gives a search space of (12)17 or 2.218×10¹⁸. The CPU time required for one operating condition was about 10 minutes and 26 minutes for three operating conditions, on a PC with the following configuration: Intel Core i3, 2.4GHz, 3GB RAM and Windows XP
operating system. Figure 1. Sample network.
The nodal demands in Figure 1 were treated as the peak demands and were used to calculate the demands for the other two operating conditions, i.e. the average demand and minimum demand. In the case of the average demand, the multiplier used was 0.8 (obtained from Surendran et al., 2005). To obtain the minimum demand, the average demand was multiplied by 0.6, as in the “Anytown” network (Walski et al., 1987). Both demand multipliers were applied to all nodes, so the demands change with the same ratio.
RESULTS AND DISCUSSION
[image:4.595.303.535.293.552.2]obtained using both SOC and MOC, the entropy values achieved using 3 operating conditions in MOC have been divided by 3 (Figures 2 and 3).
[image:5.595.117.522.181.385.2]Figure 2 presents the cost versus entropy non-dominated solutions for both SOC and MOC. It can be observed that designs based on MOC are very close to the SOC solutions in terms of entropy and cost. It is worth re-stating that the MOC solutions are feasible for all three operating conditions. The model based on SOC produces many solutions with very minor improvements in entropy but large increases in cost (Figure 2).
Figure 2. Cost-entropy non-dominated designs for one and three operating conditions.
Figure 3. Correlations between average pipe size and entropy for one and three operating conditions.
[image:5.595.81.533.478.683.2]Figure 3 shows the correlation between average pipe diameter and entropy for SOC and MOC. The correlation coefficient is higher for 3 operating conditions. This supports previously published results obtained using a different network (Czajkowska and Tanyimboh, 2012). Having stated previously that SOC solutions can be infeasible under MOC, the remainder of the article focuses on MOC.
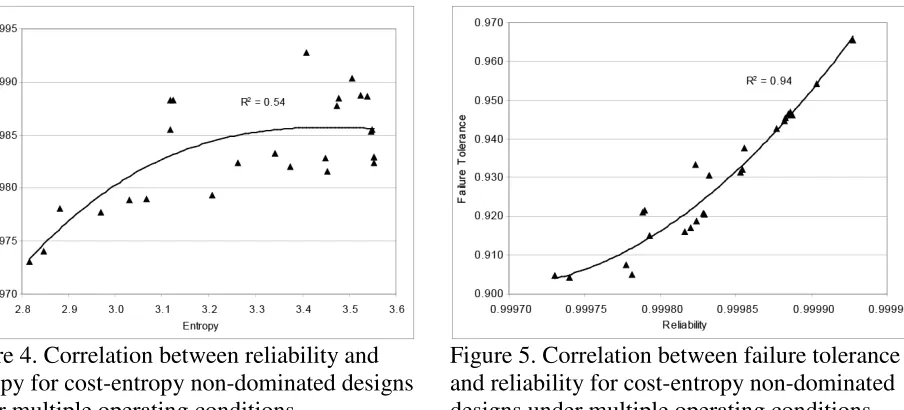
Figure 4. Correlation between reliability and entropy for cost-entropy non-dominated designs under multiple operating conditions.
Figure 5. Correlation between failure tolerance and reliability for cost-entropy non-dominated designs under multiple operating conditions.
plots in Figures 2 and 3, where the majority of designs fall near highest entropy value (i.e. between 3.5 and 3.6). Secondly, the present formulation of the node pressure deficit as an objective function is such that the algorithm merely looks for feasible designs regardless of whether any surplus pressure exists in the system or not (i.e. all feasible designs are considered mutually equal). Thus the algorithm concentrates on minimizing the cost and maximizing the entropy of the feasible designs. This may be the reason that most of the designs are located near the maximum entropy value. Figure 5 shows a correlation of R2=0.94 between reliability and failure tolerance. It is expected that reliability would correlate well with failure tolerance as both measures are closely related.
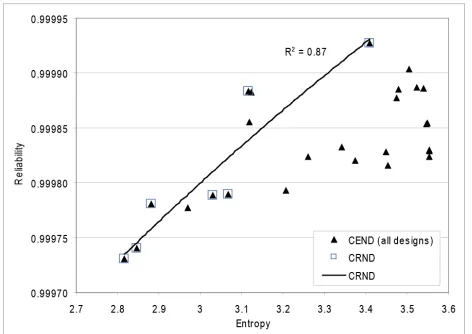
Figure 6. Reliability versus entropy with cost-reliability non-dominated solutions highlighted.
Figure 7. Failure tolerance vs. entropy; reliability and failure tolerance non-dominated solutions are highlighted.
Figure 6 presents hydraulic reliability against entropy for all cost-entropy non-dominated (CEND) solutions. Designs chosen by cost-reliability non-domination trade-off are highlighted as CRND. Figure 7 takes the analysis a step further and additional cost vs. failure tolerance non-domination (CFTND) filtering was performed on the CRND designs. Only six solutions which were non-dominated for all aspects (i.e. cost, entropy, reliability and failure tolerance) remain to choose from. It should be mentioned that there are 26 CEND solutions. The 26 CEND solutions represent only 4.063% of all the 640 feasible solutions generated by the GA across all generations over the entire number (i.e. 200,000) function evaluations. More importantly, the CEND solutions represent only 0.013% of the 200,000 candidate designs considered by the GA. It can be seen that the approach used determines the best (i.e. the most reliable) designs while reducing the computational burden.
[image:6.595.56.292.207.374.2]CONCLUSION
This paper presents a multiobjective genetic algorithm approach for the design of water distribution networks. The novelty of this research in the context of entropy maximization is that the GA can work under many loading patterns for any given network and can handle discrete pipe sizes. The method used to identify the most reliable designs is computationally efficient. In order to extend the optimization approach to real-word networks, further work is required to include network components such as tanks and pumps. The investigation of different methods of designing for multiple loading patterns is at an early stage and more research is indicated.
ACKNOWLEDGEMENT
The authors are grateful to UK Engineering and Physical Sciences Research Council for providing the funds for this project (EPSRC Grant Number EP/G055564/1).
REFERENCES
Alperovits, E. and Shamir, U. (1977). Design of optimal water distribution systems. Water Resources Research, 13(6), 885-900.
Awumah, K., Goulter, I. and Bhatt, S.K. (1991). Entropy based redundancy measures in water distribution networks. Journal of Hydraulic Engineering, 117(5), 595-613.
Czajkowska A.M. and Tanyimboh T.T. (2012). Maximum entropy design of water distribution systems under multiple operating conditions, 10th International Conference on Hydroinformatics, Hamburg, Germany, 14-18 July, 2012, in press.
Deb, K., Pratap, A., Agarwal, S. and Meyarivan, T. (2002). A fast and elitist multi-objective genetic algorithm: NSGA II. IEEE Transactions on Evolutionary Computation, 6(2), 182-197.
Prasad, T.D. (2010). Design of pumped water distribution networks with storage. Journal of Water Resources Planning and Management, 136(1), 129-132.
Rossman, L. A. (2002). EPANET 2 User’s Manual, Water Supply and Water Resources Division, National Risk Management Research Laboratory, Cincinnati, OH45268.
Shannon, C.E. (1948). A mathematical theory of communication. Bell System Technical Journal,
27(3), 379-423.
Surendran, S., Tanyimboh, T.T. and Tabesh, M. (2005). Peaking demand factor-based reliability analysis of water distribution system. Advances in Engineering Software, 36(11-12), 789-796.
Tanyimboh, T.T. and Kalungi, P. (2009). Multi-criteria assessment of optimal design, rehabilitation and upgrading schemes for water distribution networks. Civil Engineering and Environmental Systems, 26(2), 117-140.
Tanyimboh, T.T. and Templeman, A.B. (1993). Optimum design of flexible water distribution networks. Civil Engineering Systems, 10(3), 243-258.
Tanyimboh, T.T. and Templeman, A.B. (2000). A quantified assessment of the relationship between the reliability and entropy of water distribution systems. Engineering Optimization, 33(2), 179-199.
Tanyimboh, T.T. and Templeman, A.B. (2010). Seamless pressure-deficient water distribution
system model, Journal of Water Management, ICE, 163(8), 389-396, 2010.
Tanyimboh T.T., Tietavainen, M.T and Saleh, S.A.E. (2011). Reliability assessment of water distribution systems with statistical entropy and other surrogate measures. Water Science and Technology – Water Supply, 11(4), 437-443.
Todini E. (2000). Looped water distribution networks design using a resilience index based heuristic approach. Urban Water, 2(3), 115-122.