Energy-Aware Profiling for Cloud Computing
Environments
Ibrahim Alzamil, Karim Djemame, Django Armstrong
and Richard Kavanagh
School of Computing University of Leeds
Leeds, UK
E-mail: {sc11iaa, K.Djemame, scsdja, scsrek}@leeds.ac.uk
Abstract
Cloud Computing has changed the way in which people use the IT resources today. Now, instead of buying their own IT resources, they can use the services offered by Cloud Computing with reasonable costs based on a “pay-per-use” model. However, with the wide adoption of Cloud Computing, the costs for maintaining the Cloud infrastructure have become a vital issue for the providers, especially with the large input of energy costs to underpin these resources. Thus, this paper proposes a system architecture that can be used for profiling the resources usage in terms of the energy consumption. From the profiled data, the application developers can enhance their energy-aware decisions when creating or optimising the applications to be more energy efficient. This paper also presents an adapted existing Cloud architecture to enable energy-aware profiling based on the proposed system. The results of the conducted experiments show energy-awareness at physical host and virtual machine levels.
Keywords: Cloud Computing, Energy Efficiency, Energy-Aware Profiling, Energy Efficiency Metrics.
1
Introduction
The radical adoption of Cloud Computing technology has exposed a significant overhead in maintaining its infrastructure, which has become a major issue for the Cloud providers due to the associated high operational costs, such as energy consumption. It has been stated that a data centre may consume about 100 times more energy than a typical office of the same size [1]. So, efficiently managing the power consumed by the servers would improve the overall consumption; in the sense that as the servers consume less power, the heat generated by these servers would be reduced, which would then reduce the need for cooling resources that consume large amount of energy as well and result in more energy savings.
Improving the energy efficiency of Cloud Computing has been an attractive research topic for both academia and industry as it has become gradually significant for the future of Information and Communication Technology (ICT) [2]. Many
Available online at www.sciencedirect.com
Electronic Notes in Theoretical Computer Science 318 (2015) 91–108
1571-0661/© 2015 The Authors. Published by Elsevier B.V.
www.elsevier.com/locate/entcs
http://dx.doi.org/10.1016/j.entcs.2015.10.021
researchers have investigated new ways for managing the Cloud infrastructure as a means of enhancing the energy efficiency. A number of techniques have been already proposed and deployed for better resource management. For example, Data Voltage and Frequency Scaling (DVFS) and Virtual Machines (VMs) allocation have been widely studied and deployed to manage the resources more efficiently [3]. Nonetheless, there is still a need to make the whole stack of Cloud Computing more energy-aware and not only focusing on the resource management aspects.
There are a large number of different Cloud applications with different require-ments of resources; some of them are data-intensive whereas others are compute-intensive. So, depending on the taxonomy of the application, the energy consump-tion of the resources that underpin these different applicaconsump-tions can vary. The proper-ties of Cloud applications are derived from the characteristics of Cloud Computing. Fehling et al [4] stated that Cloud applications should be able to support the char-acteristics of Isolate state, Distribution, Elasticity, Automated management, Loose coupling (IDEAL), all of which reflect the patterns of Cloud Computing environ-ments. Depending on the behaviour of users and submitted tasks, these applications can experience different patterns of workloads, which are depicted based on the util-isation of IT resources hosting the applications. These workloads can be categorised as static workload that has equal utilisation of resources over time, periodic work-load that has repeating peak utilisation at interval time, once-in-a-lifetime workwork-load that has a peak utilisation once over time, unpredictable workload that has a fre-quent and random peak utilisation over time, and continuously changing workload that has a utilisation increases or decrease continuously over time [4]. These differ-ent types of application workloads can have differdiffer-ent impact of energy consumption depending on usage of the resources component.
Thus, this research is aimed to add value to the Cloud Computing energy effi-ciency by investigating energy effieffi-ciency modelling in terms of energy-aware profiling and energy efficiency metrics. Energy-aware profiling is studied in order to under-stand how the energy is consumed by the infrastructure components, like CPUs, when the application is in operation.
Thus, the output measurements of energy-aware profiling and energy efficiency metrics will be combined to form KPIs for the running application. Also, these KPIs will be further analysed and used to facilitate the decision-making of application developers with better energy-aware programming. The main contributions of this paper include:
• A proposed system architecture for profiling and assessing the energy efficiency of Cloud infrastructure resources.
• Implementing the proposed architecture in an existing Cloud testbed to enable energy-aware profiling.
• Introducing an energy modeller to enable energy-awareness at VM level.
the proposed system architecture for improving the energy efficiency assessment of Cloud Computing infrastructures; Section 5 will discuss the implementation of the proposed architecture in an existing Cloud testbed to enable energy-aware profiling at physical host and VM levels; Section 6 will present the experimental set up and design to validate the architecture of the testbed, and finally Section 7 will conclude the paper and discuss future work.
2
Energy Efficiency in Cloud Computing
For the Cloud Computing stack, energy efficiency has been extensively studied in the literature and has focused on a large number of different topics, like virtualisation, requirement engineering, programming models, and resource management.
In terms of virtualisation, a number of studies proposed different approaches for allowing resource utilisation, server consolidation and live migration of virtual machines [5,6,7], which all can offer significant energy and costs savings [8].
With the advancement of software-intensive systems for self-adaptive systems to meet the growing needs for autonomic computing [9], requirements engineering for self-adaptive software systems ensuring energy aspects has received less attention [10]; as that can be justified with the challenges to encounter when dealing with uncertainties associated with the operating environment [11]. Optimising energy efficiency at different layers of Cloud stack is considered significantly important, as argued by Djemame et al [12]. They therefore have proposed a Cloud architecture that addresses energy efficiency at all layers of the Cloud stack and throughout the whole Cloud application lifecycle.
In terms of programming models, there are a number of platforms used for the development and deployment of Cloud applications and services, like Hadoop [13], Windows Azure [14], Microsoft Daytona [15], Twister [16], Manjrasoft Aneka [17], and Google App Engine [18]. Yet, these platforms lack consideration for energy efficiency, whereas a work presented in [19] proposed a general-purpose programing environment to simplify and help the developers make energy-efficient decisions for constructing energy-aware applications.
Most of the attention in the literature has focused on enhancing the energy ef-ficiency of Cloud Computing through better resource management to avoid some issues like excessive power consumption and SLAs violation reliability [3]. There-fore, many developments have been introduced like, DVFS and Dynamic Power Management (DPM) techniques to control the power consumption of servers in ac-cordance with the workload [20], virtual machine consolidation policies to optimise the hosts by migrating VMs from one host to another [3], some models for better prediction of the power consumption for the servers [21], task consolidation model for maximising resource utilisation [22], a holistic framework called Mistral for op-timising the power consumption for the physical hosts [23], a CPU re-allocation algorithm that combines both DVFS and live migration techniques to reduce the energy consumption and increase the performance in Cloud datacentres [24].
energy-awareness from the design stage and not only through resource management of the Cloud Infrastructure. So, there is still a need for modelling the energy efficiency of Cloud infrastructures to gain a better understanding of energy efficiency and to feed the decision-making at the service design stage, which will be discussed in the following section.
3
Energy Efficiency Modelling
It is important to model energy profiling techniques and introduce new metrics to inform the providers how energy efficient their infrastructure is to make strategic decisions, such as creating and configuring energy-aware application and forming new energy-aware pricing mechanism, accordingly.
3.1 Profiling
Having such tools that would help understand how the energy has been consumed in a system is essential in order to facilitate software developers to make energy-aware programming decisions. Schubert et al [25] state that the developers lack the tools that indicate where the energy-hungry sections are located in their code and help them better optimize their code for enhancing energy consumption more accurately instead of just relying on their own intuitions. In their work, they proposed eprof, which is a software profiler that narrates energy consumption to code locations; therefore, it would also help developers make better energy-aware decisions when they re-write their code [25]. For example, with storing data on a disk, software developers might choose between storing the data in an uncompressed format or a compressed format, which would require more CPU resources. Compressed data has been commonly suggested as a way to reduce the amount of I/O needed to be performed and therefore reducing the energy based on the hypothesis that the CPU can process the task of compression and decompression with less energy than the task of transferring large data from and to the disk [26]. However, that would depend on the data being processed. In fact, some conducted experiments in [25] with eprof profiling tool show that the process of compressing and decompressing the data consumes significantly more energy than the process of transferring large amount of uncompressed data because the former would use more CPU resources than the latter. So, it can be a controversial issue depending on the application domain. Thus, having such tools identifying where the energy has been consumed would help software developers to make more energy-aware decisions.
3.2 Metrics
Energy efficiency in Clouds can be assessed by different metrics. In terms of Cloud infrastructure, the well-known Power Usage Effectiveness (PUE) metric has been introduced by the Green Grid organisation to help the providers assess and improve the energy efficiency of their data centres [28]. However, despite the fact that the PUE metric has been successful and widely used, Grosskop [29] argues that it is restricted as an indicator for energy efficiency to the infrastructure management only and not considering the optimisation at the software levels to enhance the efficiency of the whole stack. Also, Bozzelli et al [30] have reviewed a number of software metrics and emphasised the importance to assess the energy efficiency not only form the hardware side but also from early stages of the software lifecycle in order to make such energy savings. Additionally, as stated by Wilke et al [31], analysing software’s energy consumption is considered an important requirement for such optimisations. So, Grosskop proposed a new metric called the Consump-tion Near Sweet-Spot (CNS) that identifies how well the system’s energy efficiency optimum and its utilisation are aligned by calculating the ratio between the average consumption and optimum consumption for a system to deliver a particular unit of work [29].
Moreover, other works have looked at other metrics for energy efficiency mea-surements, like utilisation percentage and SLA violation percentage. For example, in the work conducted by Beloglazov et al [3], they evaluate the efficiency and performance of their proposed algorithms by using some metrics, namely the total energy consumption, the average number of SLA violations, and the number of VM migrations.
Recently, some works have started to measure the energy consumption in more detail, like measuring energy consumption for each VM in a physical machine. Re-search conducted in [32] introduces a VM power model to measure the estimated power consumption of VM with using performance events counter. They argue that the results of their proposed model can get on average about 97% accuracy.
Nonetheless, as mentioned earlier, there is a limited number of metrics to mea-sure the energy efficiency of Clouds from different layers other than the infrastruc-ture only. In terms of fine-grain measurement, there is a need to map the energy consumption for each single VM in a server, which indicates the importance to fill this gap by introducing new suitable metrics for measuring and mapping the energy consumption to each VM.
4
Energy-Aware Profiling
proposed system architecture will be discussed in the following subsection.
4.1 Proposed System Architecture
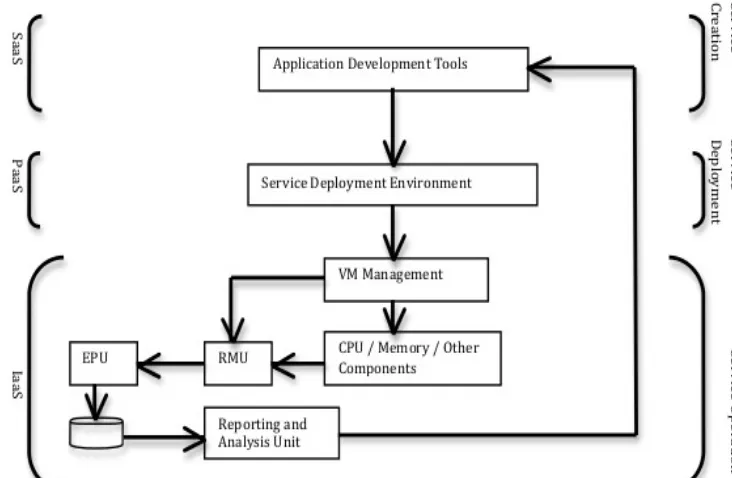
[image:6.485.53.419.180.419.2]The scope of this proposed system architecture would be in the IaaS layer where the operation of services takes place. The main components of this model consist of Resource Monitoring Unit (RMU), Energy Profiling Unit (EPU), Reporting and Analysis Unit, as can be shown in Figure. 1.
Fig. 1. Proposed System Architecture
This proposed system architecture would have the RMU to dynamically collect the energy consumed by the hardware components and observe the number of as-signed VMs. After that, EPU would have appropriate algorithms to calculate the energy consumed by each VM and hardware components, and it would then profile and populate these measurements as KPIs to a database. This data can be further analysed by the Reporting and Analysis Unit to provide the software developers energy-aware reports in order to enhance their awareness of the energy consump-tion when making programming decisions. For example, it might be interesting to know whether the CPU or the memory of the hardware component would consume more energy, so that the developer can create applications that would depend more on components with less energy consumption, without compromising performance.
4.2 Illustration
tasks. Data-intensive tasks would depend more on using disk storage for process-ing large amounts of data and data retrieval or update, which would require high disk I/O bandwidth to maintain performance, whereas computation-intensive tasks would depend more on using the processors to perform more computation [33].
When the service is configured in the application development tool with descrip-tions of the allocated software and hardware resources, and is deployed in the service deployment environment and goes through VM management, the proposed system would then start with the RMU to capture and monitor the energy consumed by the infrastructure that underpins and operates that service. The captured data (as input to the system) will be dynamically collected by the EPU for appropriate measurements and profiling in terms of energy efficiency. Next, EPU would pop-ulate the profiled data as KPIs to a database. Hence, these KPIs (as output of the system) can be further analysed and reported in a meaningful format to the application developers to enhance their energy-aware decisions when making and configuring new services.
The next section will provide the implementation of this proposed system archi-tecture into an existing Cloud testbed to enable energy-aware profiling.
5
Implemented Energy-aware Cloud architecture
In this section, we discuss how an existing Cloud architecture, Leeds Testbed, has been adapted to support energy-awareness at physical host and VM levels.
5.1 Leeds Testbed
The software architecture of the Cloud testbed is illustrated in Figure 2. Each node at the time of writing runs Centos version 6.6 for its operating system. The XEN [34] hypervisor version 4.0.1 is also deployed along side the Linux Kernel version 2.6.32.24 as the Virtual Machine Manager (VMM). Version 3.8 of Open-Nebula [35] is used as the Virtual Infrastructure Manager (VIM). In addition, Vir-tual machines instances are configured to leverage Hardware Assisted VirVir-tualisation (HVM) and the QEMU [36] device module for enhanced performance and interop-erability.
Fig. 2. The Leeds Cloud Testbed Architecture
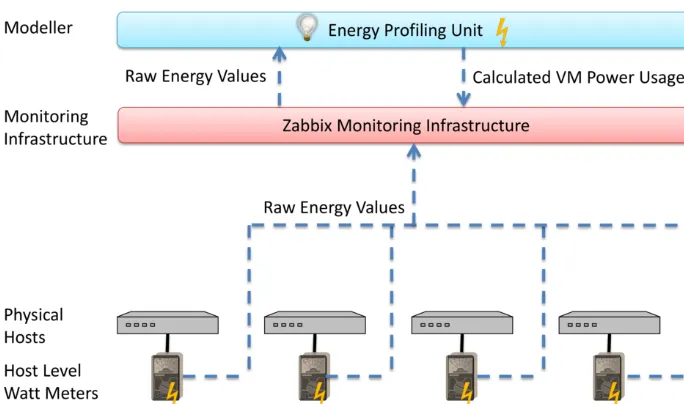
5.2 Energy Monitoring on Leeds Testbed
Fig. 3. Energy Monitoring on the Leeds Testbed
The energy monitoring on the Leeds testbed is shown in Figure 3. At the lowest level WattsUp? [37] Watt meters are attached to the physical host machines. These Watt meters are attached via USB to each of the physical hosts. A WattsUp command line tool is then used to log the values to disk once every second, which are then pushed to Zabbix [38] via Zabbix sender.
[image:8.485.43.385.349.551.2]unit. The energy profiling unit’s main role is to assign energy consumption values to a VM from the values obtained at host level.
Energy consumption associated with VMs is not a directly measureable concept. It therefore needs rules in order for the host energy consumption to be assigned to the VM. The host energy consumption can therefore be fractioned out in one of several ways, within the energy profiling unit:
(i) CPU Utilisation Only: Energy usage can be fractioned out using the CPU utilisation data for each VM and assigning the energy usage by the ratio pro-duced by the utilisation data. (Available for: Historic, Current, Predictions). This is described in Equation 1where V M Px is the named VMs power con-sumption,Host P is the measured host power consumption. V M U tilxis the named VMs CPU utilisation, V M Count is the count of VMs on the host machine. V M U tilx is a member of the set of all VMs on the named host.
V M Px=Host P × V M CountV M U tilx
y=1 V M U tily
(1)
(ii) CPU Utilisation and Idle Energy Usage: Energy can also be shared out based upon the idle energy consumption of a host. Using training data the idle energy of a host is calculated. This is evenly distributed among the VMs that are running upon the host machine. The remaining energy is then allo-cated in a similar fashion to the CPU Utilisation only mechanism. (Available for: Historic, Current, Predictions). This is described in Equation 2 where
Host Idle is the host’s measured idle power consumption. This provides the advantage over the first method in that a VM is more appropriately allocated power consumption values and prevents a VM from using no power while it is instantiated.
V M Px= Host Idle
V M Count + (Host P −Host Idle)×
V M U tilx
V M Count
y=1 V M U tily
(2)
(iii) Evenly Shared: In the case of predictions CPU utilisation is not always clearly estimable, thus there also exists ways to evenly fraction energy among VMs that are on the host machine. The default for predictions is to share out evenly as per Equation3. There also exists a slight variation by counting the CPU cores allocated to each of the VMs and allocating based upon this count (Equation 4). Equations3and4describe this even sharing rules where
Host P redictedis the amount of power that the host on which the named VM resides is estimated to utilise andV M V CP Ux is the amount of virtual CPUs allocated to the named VM whileV M V CP Uxis the amount of virtual CPUs allocated to other VMs on the host.
V M Px=Host P redicted× 1
V M Count
(3)
V M Px=Host P redicted×V M CountV M V CP Ux
y=1 V M V CP Uy
(4)
historic values and 3 for predictions. Once the energy profiling unit has assigned energy values to a given VM it then writes these values to disk, which are again via Zabbix sender reported back to the monitoring infrastructure, thus providing VM level energy values for the testbed.
The energy profiling unit has several key features; it is primarily aimed at re-porting at both host and VM level energy usage data. These values are reported as: a historical log, current values or future predictions. The historical log provides values for energy consumed over a specified time period and the average power, while the current values report power alone. The future predictions are based upon linear regression of CPU utilisation vs power consumption during a training phase on a per host level. The profiling unit provides automatic calibration features to achieve this.
6
Experiment Set Up and Design
In this section, we present some experiments that have been conducted on Leeds testbed. The overall aim of the experiments conducted is to validate that the testbed has been setup correctly as a Cloud environment that supports energy-aware profiling both physical host and VM levels.
In order to design such experiments, a software testing tool that represent real patterns of Cloud applications is needed. Cloud9, a software testing benchmark, has therefore been setup on the testbed to generate real scale-out workloads. The generated workloads by Cloud9 reflect real Cloud applications patterns [39]. Cloud9 is capable of scheduling a task or set of tasks to run on one or multiple VMs, and these tasks can be configured to run in parallel or in stages after each other [40] to represent real pattern of elastic Cloud application.
The following experiments are designed differently to show various aspects of Cloud Computing patterns. Each one has been repeated 10 times to get the average mean value of the power consumption and eliminate any anomalies of the results.
6.1 Experiment 1
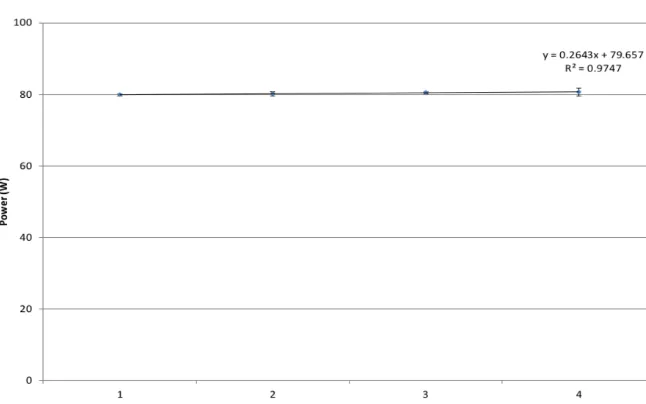
This experiment is designed to schedule some tasks to run dynamically in four stages scaling-up from one VCPU up to four VCPUs on the same VM on a single host. Each stage is set to run for 60 seconds. The following Figures4and5will show the results of power consumption at host level.
Fig. 4. VCPU Scaling on a Single VM (Time vs Power)
Fig. 5. VCPU Scaling on a Single VM (No of VCPUs vs Power)
[image:11.485.52.375.323.525.2]6.2 Experiment 2
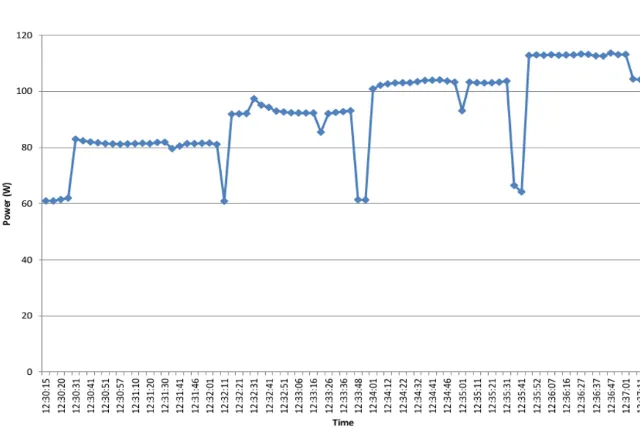
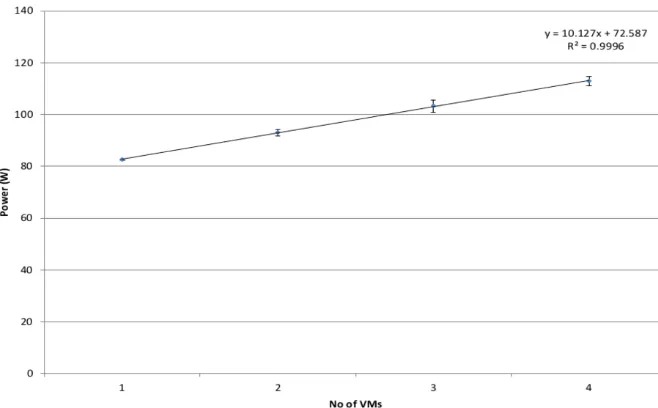
This experiment is scheduled to run some tasks dynamically in four stages scaling-up from one VM scaling-up to four VMs on a single host with each stage set to run for 60 seconds.
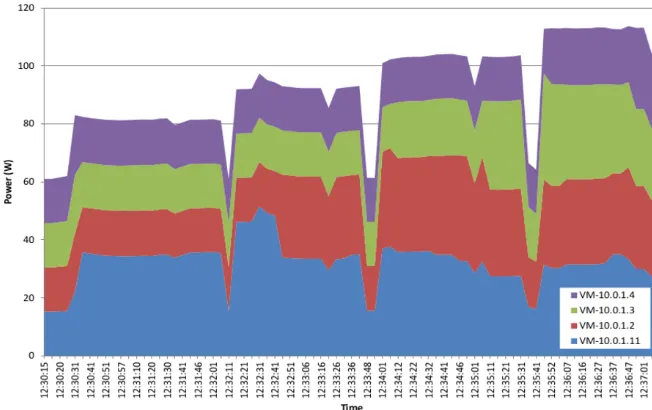
Figures 6 and 7 show the results of the power consumption at the host level. Figure 6 shows the results of power consumption for a single run, and Figure 7
shows the results of the aggregated average of power consumption for each stage over 10 runs. As the case with Experiment 1, the transition between each stage results in the reduction of the power consumption, as shown in Figure6.
[image:12.485.50.370.361.575.2]It is clearly shown that increasing the number of VMs from one up to four VMs in a single host has an impact on the overall power consumption for that host. The power consumption shows a linear growth with the increment of VMs. Increasing the number of VMs means increasing the usage of physical resources, like CPU, disk, and memory, assigned to these VMs. So, as more physical resources are used, the power consumption increases accordingly.
Fig. 7. VM Scaling on a Single Host (No of VMs vs Power)
Fig. 8. VM Scaling on a Single Host (Time vs Power)
6.3 Experiment 3
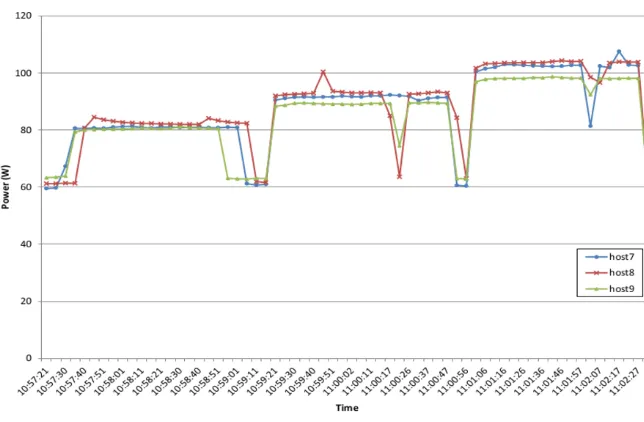
This experiment ran some tasks dynamically in three stages scaling-up from one VM up to three VMs across three different hosts simultaneously with each stage set to run for 60 seconds. The following Figures 9 and 10 will show the power consumption for each host from physical host level. Figure 9 shows the results of power consumption for a single run, and Figure 10 shows the results of the aggregated average of power consumption for each stage over 10 runs. Like the previous Experiments 1 and 2, the transition between each stage results in the reduction of power consumption, as shown in Figure 9.
Figure9and10 show that increasing the number of VMs from one up to three VMs across three physical hosts has an impact on the overall power consumption for each host.
The results shown in this Experiment 3 are similar to those shown in Experiment 2; but here the results are shown for three physical hosts running simultaneously, whereas Experiment 2 was run only on a single physical host. So, the power con-sumption in this Experiment 3 increases linearly with the increment of VMs running on each host. This experiment also shows that an application consisting a number of tasks can run across multiple VMs hosted by different physical host machines at the same time.
6.4 Overall Results Discussion
Fig. 9. VM Scaling on three Different Hosts (Time vs Power)
Fig. 10. VM Scaling on three Different Hosts (No of VMs vs Power)
that a CPU can be over-provisioned to a number of VCPU to deliver some tasks. Experiments 2 and 3 proved that we can run an application consisting of a number of tasks on a number of VMs at the same time on a single or multiple physical hosts.
7
Conclusion and Future Work
[image:15.485.63.378.313.510.2]to enhance their decision-making when creating and configuring new applications. We have adapted an existing Cloud architecture based on the proposed system to enable aware profiling and presented the energy modeller that allows energy-awareness at VM level. The conducted experiments showed that Leeds testbed has been setup correctly as a Cloud environment supporting energy-awareness at both physical host and VM levels.
Future work will include investigation on energy efficiency modelling to identify new metrics and form KPIs to better understand to what extent a running appli-cation is energy efficient in relation to these KPIs. Implementing the Analysis and Reporting Unit of the proposed system to provide a meaningful feedback of these KPIs to the application developers to enhance their programming decisions with energy-awareness.
Finally, when these KPIs are identified, further research would investigate how to identify new energy-aware pricing mechanisms to charge the users for the offered Cloud services based on these measurements. So, the end-users are being charged more precisely based on their actual resource usage of Cloud services considering the energy consumption as well, which would contribute efficiently to the overall business model of Cloud Computing.
References
[1] P. Scheihing. Creating Energy-Efficient Data Centers. In Data Center Facilities and Engineering Conference, Washington, DC, 18th May., 2007.
[2] A. Berl, E. Gelenbe, M. Di Girolamo, G. Giuliani, H. De Meer, M. Q. Dang, and K. Pentikousis. Energy-Efficient Cloud Computing. The Computer Journal, 53(7):1045–1051, August 2009.
[3] A. Beloglazov, J. Abawajy, and R. Buyya. Energy-aware resource allocation heuristics for efficient management of data centers for Cloud computing. Future Generation Computer Systems, 28(5):755– 768, May 2012.
[4] C. Fehling, F. Leymann, R. Retter, W. Schupeck, and P. Arbitter. Cloud Computing Patterns: Fundamentals to Design, Build, and Manage Cloud Applications. Springer, 2014.
[5] K. Ye, D. Huang, X. Jiang, H. Chen, and S. Wu. Virtual Machine Based Energy-Efficient Data Center Architecture for Cloud Computing: A Performance Perspective. In Green Computing and Communications (GreenCom), 2010 IEEE/ACM Int’l Conference on & Int’l Conference on Cyber, Physical and Social Computing (CPSCom), pages 171–178, 2010.
[6] J. Hardy, L. Liu, N. Antonopoulos, W. Liu, L. Cui, and J. Li. Assessment and Evaluation of Internet-Based Virtual Computing Infrastructure. InObject/Component/Service-Oriented Real-Time Distributed Computing (ISORC), 2012 IEEE 15th International Symposium on, pages 39–46, 2012.
[7] I. Foster, Y. Zhao, I. Raicu, and S. Lu. Cloud Computing and Grid Computing 360-Degree Compared. InGrid Computing Environments Workshop, 2008. GCE ’08, pages 1–10, 2008.
[8] T. Arthi and H. Hamead. Energy aware cloud service provisioning approach for green computing environment. In Energy Efficient Technologies for Sustainability (ICEETS), 2013 International Conference on, pages 139–144, 2013.
[9] H. Giese, H. Muller, M. Shaw, and R. De Lemos. 10431 Abstracts Collection – Software Engineering for Self-Adaptive Systems. Schloss Dagstuhl - Leibniz-Zentrum fuer Informatik, 2008.
[10] N. Qureshi and A. Perini. Engineering adaptive requirements. In2009 ICSE Workshop on Software Engineering for Adaptive and Self-Managing Systems, volume 2009, pages 126–131. IEEE, May 2009.
[12] K. Djemame, D. Armstrong, R. E. Kavanagh, A. J. Ferrer, D. G. Perez, D. R. Antona, J.-C. Deprez, C. Ponsard, D. Ortiz, M. Mac´ıas, J. Guitart, F. Lordan, J. Ejarque, R. Sirvent, R. M. Badia, M. Kammer, O. Kao, E. Agiatzidou, A. Dimakis, C. Courcoubetis, and L. Blasi. Energy efficiency embedded service lifecycle: Towards an energy efficient cloud computing architecture. Inthe Proceedings of the Workshop on Energy Efficient Systems (EES’2014) at ICT4S, pages 1–6, Stockholm, Sweden, August 2014.
[13] Welcome to Apache, Hadoop! Available athttp://hadoop.apache.org/, 2011.
[14] Windows Azure: Microsoft’s Cloud Platform — Cloud Hosting — Cloud Services. Available athttp: //www.windowsazure.com/en-us/, 2012.
[15] Daytona - Microsoft Research. Available at http://research.microsoft.com/en-us/projects/ daytona/, 2013.
[16] J. Ekanayake. Twister: Iterative MapReduce. Available at http://www.iterativemapreduce.org/, 2009.
[17] Manjrasoft - Products. Available athttp://www.manjrasoft.com/products.html, 2008.
[18] Google App Engine - Google Developers. Available athttps://developers.google.com/appengine/ ?hl=en, 2014.
[19] C. Xian, Y. Lu, and Z. Li. A programming environment with runtime energy characterization for energy-aware applications. InLow Power Electronics and Design (ISLPED), 2007 ACM/IEEE International Symposium on, pages 141–146, 2007.
[20] D. Kliazovich, P. Bouvry, and S. Khan. DENS: Data Center Energy-Efficient Network-Aware Scheduling. In2010 IEEE/ACM Int’l Conference on Green Computing and Communications & Int’l Conference on Cyber, Physical and Social Computing, pages 69–75. IEEE, December 2010.
[21] R. Basmadjian, F. Niedermeier, and H. De Meer. Modelling and analysing the power consumption of idle servers. Sustainable Internet and ICT for Sustainability (SustainIT), 2012, pages 1–9, 2012.
[22] Y. Lee and A. Zomaya. Energy efficient utilization of resources in cloud computing systems. The Journal of Supercomputing, 60(2):268–280, March 2010.
[23] G. Jung, M. Hiltunen, K. Joshi, R. Schlichting, and C. Pu. Mistral: Dynamically Managing Power, Performance, and Adaptation Cost in Cloud Infrastructures.2010 IEEE 30th International Conference on Distributed Computing Systems, pages 62–73, 2010.
[24] W. Chawarut and L. Woraphon. Energy-aware and real-time service management in cloud computing. In Electrical Engineering/Electronics, Computer, Telecommunications and Information Technology (ECTI-CON), 2013 10th International Conference on, pages 1–5, 2013.
[25] S. Schubert, D. Kostic, W. Zwaenepoel, and K. Shin. Profiling software for energy consumption. Green Computing and Communications (GreenCom), 2012 IEEE International Conference on, pages 515– 522, 2012.
[26] A. Kansal and F. Zhao. Fine-grained energy profiling for power-aware application design. ACM SIGMETRICS Performance Evaluation Review, 36(2):26, August 2008.
[27] T. Honig, C. Eibel, W. Schroder Preikschat, and B. Kapitza. Proactive Energy-Aware System Software Design with SEEP. In Porceedings of 2nd Workshop on Energy-Aware Software-Engineering and Development (EASED@BUIS), 2013.
[28] The Green Grid. Harmonizing Global Metrics for Data Center Energy Efficiency. Technical report, The Green Grid, 2012.
[29] K. Grosskop. PUE for end users-Are you interested in more than bread toasting? In Porceedings of 2nd Workshop on Energy-Aware Software-Engineering and Development (EASED@BUIS), 2013.
[30] P. Bozzelli, Q. Gu, and P. Lago. A systematic literature review on green software metrics. Technical report, VU University Amsterdam, 2013.
[31] C. Wilke, S. Gotz, and S. Richly. JouleUnit: A Generic Framework for Software Energy Profiling and Testing. InProceedings of the 2013 Workshop on Green in/by Software Engineering, GIBSE ’13, pages 9–14, New York, NY, USA, 2013. ACM.
[32] W. Chengjian, L. Xiang, Y. Yang, F. Ni, and Y. Mu. System Power Model and Virtual Machine Power Metering for Cloud Computing Pricing. InIntelligent System Design and Engineering Applications (ISDEA), 2013 Third International Conference on, pages 1379–1382, 2013.
[34] P. Barham, B. Dragovic, K. Fraser, S. Hand, T. Harris, A. Ho, R. Neugebauer, I. Pratt, and A. Warfield. Xen and the art of virtualization. SIGOPS Oper. Syst. Rev., 37(5):164 – 177, 2003.
[35] B. Sotomayor, R. S. Montero, I. M. Llorente, and I. Foster. Virtual Infrastructure Management in Private and Hybrid Clouds. Internet Computing, IEEE, 13(5):14 – 22, Sept 2009.
[36] QEMU - Open Source Machine Emulation and Virtualizer. http://www.qemu.org, November 2014.
[37] Watts Up? Plug Load Meters. Available atwww.wattsupmeters.com.
[38] ZABBIX SIA. Homepage of Zabbix:: An Enterprise-Class Open Source Distributed Monitoring Solution, 2014.
[39] Software testing as a Service. Available athttp://parsa.epfl.ch/cloudsuite/cloud9.html, 2013.
[40] L. Ciortea, C. Zamfir, S. Bucur, V. Chipounov, and G. Candea. Cloud9: A Software Testing Service.