ELECTRICITY PRICES
1980-1982
PRIX DE L'ÉNERGIE ÉLECTRIQUE
D E C E M B E R
eurostat
DE EUROPÆISKE FÆLLESSKABERS STATISTISKE KONTOR
STATISTISCHES AMT DER EUROPÄISCHEN GEMEINSCHAFTEN
STATISTICAL OFFICE OF THE EUROPEAN COMMUNITIES
OFFICE STATISTIQUE DES COMMUNAUTÉS EUROPÉENNES
ISTITUTO STATISTICO DELLE COMUNITÀ EUROPEE
BUREAU VOOR DE STATISTIEK DER EUROPESE GEMEENSCHAPPEN
L-2920 Luxembourg - Tel. 43011 Télex: Comeur Lu 3423
ELECTRICITY PRICES
1980-1982
PRIX DE L'ÉNERGIE ÉLECTRIQUE
DECEMBER Internal document
NOTE : In the Statistical Annex, the continental practice of using a comma for the decimal point is adopted.
For all information concerning this publication. Pour toute information concernant cette publication, contact : s'adresser à :
F. DESGARDES F. DESGARDES
I - Introduction
II - Conditions and methods
1. Scope of the study and locations 2. Standard consumers
3· Definition of the price levels recorded 4. Tariff voltage
III - Units of value
IV - Taxes levied on electricity sales
V - Conclusions
STATISTICAL ANNEX
Tables
1 - 16 Household and industrial prices "by location
17 PPS and ECU conversion tables and GDP price indices 18 Community comparison in deflated PPS
The present publication is an updating for the years 19&Ί and I982, of the previous study of electricity prices, i.e.
ELECTRICITY PRICES 1973 - 1978 EUROSTAT I98O cat : CA-28-79-196-2A-C
and its updating for I978 - I98O.
In general the same definitions and methods were applied and the same field was covered as in the previous study, except that Greece has been included for the first time.
In order to avoid repetition, only the general outlines of the survey are set out below in the section entitled "Conditions and methods"· If neces sary, reference may be made to the previous publications.
For many reasons, it has been necessary to restrict the text of this
study to a brief outline of the general characteristics and an explanation of the taxes applied to sales of electricity· Some further information on tariffs is available from the Statistical Office of the European Communi ties, Energy Division, if required.
II - CONDITIONS AND METHODS
1. SCOPE AND LOCATIONS
As in the previous study, the survey covers ten Member States of the Community and the prices were recorded in 29 town or conurbations :
Federal Republic of Germany : Hamburg, Hanover, Dusseldorf, Frankfurt am Main, Stuttgart, Munich, Western Zone, Southern zone
France
Italy
Netherlands
Belgium
G.D. of Luxembourg
U n i t e d Kingdom
I r e l a n d
Denmark Greece
Lille, Paris, Marseille, Lyons, Toulouse, Strasbourg
Northern and Central Italy, Southern Italy and the islands
Rotterdam (GEB) North Holland (PEN) North Brabant (PNEM)
The country as a whole (standard national tariff)
Grand Duchy (CEGEDEL)
London, Glasgow, Leeds, Birmingham
Dublin
Copenhagen (KB), North Zealand (NESA) Athens (standard national tariff) Three years are covered by this study :
1980 - 1981 - 1982
certain conditions of supply, chosen as being representative of the population of electricity consumers· These standard levels of consump-tion remain fixed from one year to the next and for all the countries, this being one of the primary conditions for comparisons between
countries and between years.
a) domestic uses : (supply at low voltage)
Standard
Da Db Dc De
Annual consumption kWh
Total (of which night) (1)
600 1200
3500 ( 1300)
20000 (15OOO)
Approx. subscribed demand in kW
< 3 3 - 4 4 - 9
¿9
Standard dwelling
2
50 nu 2 rooms+kitchen 70 nu 3 rooms+kitchen 90 nu 4 rooms+kitchen 120 m 5 rooms+kitchen
As a guideline these standard consumers may be expected to possess the following household facilities and appliances :
Da Lighting, radio, television, refrigerator, small electric appliances Db as for Da + washing machine or dishwasher
Dc as for Db with washing machine and dishwasher + storage water heater De "all-electric" system with water heater and electric central heating
operating on a storage basis.
b) industrial uses (for voltage see point 4)
(2)
Standard consumer
1a 1b 1c 1d 1e 1f
Annual consumption kWh
30 000 50 000 160 000 1 250 000 2 000 000 10 000 000
Max. demand in kW
30 50 100 5OO 500 2 5OO
Annual load factor h
1 000 1 000 1 600 2 500 4 000 4 000
The maximum demand is the maximum offtake in any quarter of an hour recorded in one year, expressed in kilowatts (kW). The annual load factor determines the regularity of consumer offtake of electricity from the grid during the year. The longer this time the more even the pattern of consumption during the 8 760 hours of the year* It indicates the number of hours in which the consumer would reach his annual consump-tion level if the demand level were permanently equal to maximum demand·
(1) There is no tariff for night or off-peak consumption in Italy (2) E.g. : vacuum cleaner, electric toaster, hard dryer, mixer,
8
Additional details are sometimes needed before the tariffs can be applied :
- In the case of tariffs based on half hourly maximum demand, the maximum demand of the standard consumer is multiplied by a coef ficient of O.98
- In the case of tariffs based on a maximum demand expressed in kVA an adjustment is made by dividing the standard consumer's maximum demand in kW by the coefficient COS 0 » 0.90 - 0,95
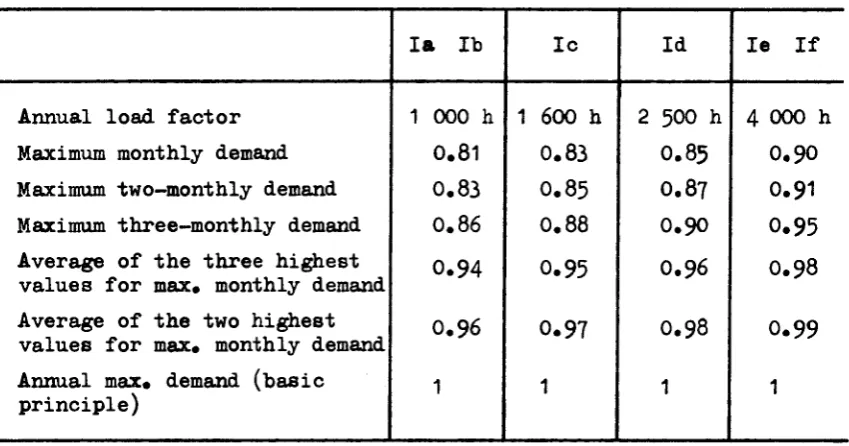
[image:10.595.104.529.340.563.2]- In the case of tariffs based on maximum demand readings more frequent than once a year the standing charge is multiplied by the following coefficients :
Table of power correction coefficients
Annual load factor Maximum monthly demand Maximum two-monthly demand Maximum three-monthly demand Average of the three highest values for max· monthly demand Average of the two highest
values for max· monthly demand Annual max· demand (basic principle)
la lb
1 000 h 0.81 0.83 0.86
0.94
0.96
1
Ic
1 600 h 0.83 0.85 0.88
0.95
0.97
1
Id
2 500 h 0.85 0.87 O.90
Ο.96
0.98
1
Ie If
4 000 h 0.90 0.91 0.95 Ο.98
0.99
1
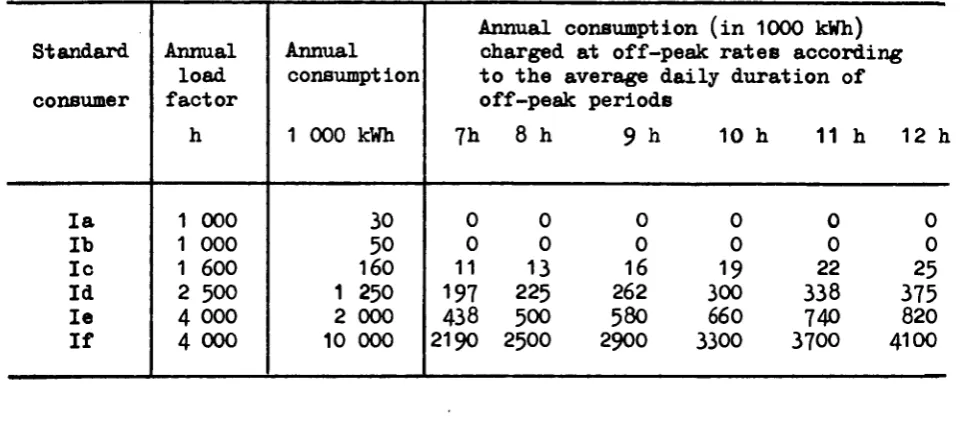
Standard
consumer
l a l b I c Id Ie I f
Annual load f a c t o r
h
1 000 1 000 1 600 2 500 4 000 4 000
Annual consumption
1 000 kWh
30 50 160 1 250 2 000 10 000
charged at off-peak r a t e s according t o t h e average d a i l y duration of off-peak periods
7h 8 h 9 h 10 h 11 h 12 h
0 0 0 0 0 0 0 0 0 0 0 0 11 13 16 19 22 25 197 225 262 300 338 375 438 500 58O 660 740 820 2190 2500 2900 3300 3700 4100
3. DEFINITION OF PRICES RECORDED
The results give the prices actually paid by consumere. These prices include the meter rental, the standing charges and the commodity rates« They do not include connection charges· The figures give the unit prices paid per kWh of electricity consumed·
The prices are recorded and calculated according to the tariffs, con-ditions and rules in force at the beginning of each year. This means that any changes in the tariff structure during the year are not taken into account, i.e. no price weighting is applied to the year«
Tariffs which were applied only to a negligible number of users or not at all have been disregarded and, where several tariffs were possible, the tariff recorded is the one most favourable to the consumer«
In the oase of a consumer having two separate meters (e.g. one for night tariff and one for daytime tariff), the price reflects total consumption.
Account has been taken of special tariff or supplementary arrangements which may exist for reactive power«
The way price levels are shown is as follows : Three values are shown :
- the price net of tax
[image:11.595.64.545.175.386.2]10
The amount of taxes is obtained by difference.
The taxes referred to above are those levied directly on the sale of electricity to the consumer. The taxes levied prior to this, such as direct company tax or income tax (which obviously contribute to the manufacturing costs), are not shown separately in this study.
More information on taxes is given in chapter IV.
The results for each country are shown in national currencies at current prices, i.e. at face value.
For the purposes of international comparison, it was necessary to use a representative common monetary unit which would create a minimum of distortion in both space and time. Accordingly, the present study uses the purchasing power standard (PPS), which is outlined and explained in the chapter III.
It was also considered useful to include international comparison tables expressed in European Currency Units (ECU).
4. TARIFF VOLTAGE
The voltage at which electricity is supplied to the consumer is an element which may partly explain differences in industrial price
levels. The higher the voltage, the lower the price. But in this case, the consumer has to bear the expense of the electricity transformer
(the investment cost or the rental).
In practise the supply voltages vary according to the grid and the tariffs.
The table below gives the tariff voltages according to which the prices for the industrial standard consumers have been calculated. These are the tariff voltages normally applied.
la, lb I c
Id
Ie
If
BR Deutschland : Süd Gebiet
Hamburg, Hannover] Düsseldorf,
Frankfurt
West Gebiet
S t u t t g a r t »München]
France Italia
Nederland ι GEB PNEM PEN
Belgique/België
Luxembourg
United Kingdom
I r e l a n d
Danemark
Greece
20
10
e
<r
0.38 0.38 0.38
0.38
- 10
- 15
^ 5 0
0.415
0.38
<—
0.415
0.38
0.4 —
10
-_
1 0. .
10/15
— 20
-10
10
>
11
10
->
->
->
65
->
III. UNITS OF VALUE
To enable comparisons between countries, prices expressed in national currencies need to be converted to a common unit. In this study two common units are used : the European Currency Unit (ECU) and the Purchasing Power Standard (PPS).
a) The European Currency Unit (ECU)
The ECU is based on a 'basket' of the currencies of nine of the Member States of the Community, converted at market exchange rates. It is defined as the sum of the following fixed amounts : DM 0.828 UKL O.O885 FP 1.15 LIT IO9 HFL 0.286 BFR 3.66
LFR 0.14 DKR O.217 IRL 0.00759. Greece is due to be intro-duced into the ECU by the end of I985.
The conversion rates for ECU are given in a table in annex.
The ECU reflects fluctuations in exchange rates and is well adapted to measure foreign trade prices and the values of international flows.
A comparison in ECU, therefore, takes the viewpoint of a tourist who buys goods and services in a foreign country, after changing his money at a bank. This differs from the SPA viewpoint which is one of a con-sumer who buys goods and services in his own country with the national currency.
The ECU also has the inconvenience that its definition changes when a new currency is introduced and that it is not coherent with the Gross Domestic Product price index, which makes it difficult to deflate.
b) The Purchasing Power Standard (PPS)
The PPS is a reference unit for which the ratios between the different national currencies are proportional to the purchasing power parities
(PPP) between these currencies.
The PPP, which are calculated for all the uses of the GDP, reflect the ratios between price levels in the different countries; they indicate the amount of a national currency required to buy in each country the same baeket of goods and services which are included in the uses of the GDP. In this present publication only the PPP at GDP level are used.
12
It should be noted that the level at which the PPS is fixed does not influence the comparison between countries. When prices are con-verted to PPS using the GDP parity the following judgement is possible:
if one Gigajoule of energy costs 10 PPS in country A and 5 PPS in country B, this means that after eliminating the differences between the general level of prices in the two countries, this Gigajoule of energy is twice as expensive in country A than in country B.
This judgement is indépendant of market exchange rates and therefore, is not influenced by fluctuations in the same, brought about by move-ments of capital, speculation, political decisions, etc.
The conversion rates for the years covered by this study are given in a table in annex.
c) Prices in "constant" PPS
When current prices for a given year are converted to PPS with the
help of the current PPP for the same year, comparisons between countries have the significance mentioned above (point b); however, the
compari-son in time which one can derive for each country has little interest.
Firstly, it should be noted that the current parities for each year between each currency and the PPS are the result of an extrapolation
obtained by multiplying the parities for the base year by the GDP price index for each country and dividing them by the community GDP index.
The latter being incorporated in the extrapolated parity for each country, it may be eliminated without affecting the result of the comparison between countries.
By eliminating the community index, the application of the extra-polated parities means that for each country the prices for each year are divided by the GDP price index of the country (i.e. the prices are deflated) and are converted to PPS using the parity for the base year.
Therefore the comparison between countries is not affected by elimi-nating the community GDP index, and comparisons in time have taken
on a new and interesting significance.
In effect, when the price of a product in a given year, deflated by the GDP price index for the same country and converted to PPS using the parity for the base year, is divided by the price in the base year also converted to PPS using the same parity, a relative price index is obtained, i.e. the ratio between the index of the price concerned and that of the GDP.
For this reason it is preferable to present a table of deflated prices using the GDP price index and converted to PPS using the PPP of the base year. From this table comparisons may be made between countries,
d) Price series
On the basis of the preceding descriptions, the results of this survey of Community prices are given in three forms :
1) a series at current prices in the national currency for each country;
2) a series in current ECU using the average conversion rates for January of the year concerned;
14
IV - TAXES LEVIED ON ELECTRICITY SALES
1. VALUE-ADDED TAX (VAT)
In seven of the ten countries of the Community electricity sales are subject to VAT« As can be seen in the following table the rates vary widely from one country to another :
% of price before VAT
F.R« Germany France
I t a l y (households) I t a l y (industry) Netherlands
Belgium Luxembourg Denmark
Jan. 1980
13 17.6
6 14 18 16
5
20.25
Jan· 1981
13 17.6
8
15 18 16
5
22
Jan, 1982
13 17.6
8
15 18
H
5
22
Electricity sales in the United Kingdom and Ireland are zero rated, and in Greece VAT has not yet been introduced.
2 . OTHER TAXES
a) F.R. Germany
Since 1st January 1975 a compensatory tax (Ausgleichsabgabe) has been levied, i n accordance with the Law guaranteeing the use of Community coal in power stations« The ratee differ from one region to another, however the Federal average for the years studied.was :
1980 - 4.596 1981 - 4.5$
This compensatory tax i s also subject to VAT«
1982 - 4.2£
b) France
Electricity sales at low voltage are subject to local taxes i.e. municipal taxes and departmental taxes«
The rates for the locations chosen for the survey were as follows
%
Places
Lille Paris Marseilles Lyons Toulouse Strasbourg
Municipal tax
8 13.2
8 8 8 0
Departm« tax
1
-4 ...
-2
4
Total
9
13.2 -12..,..-.
8 10 4
These taxes are levied on 80$ of the total bill excluding VAT, and are not themselves subject to VAT«
High voltage supplies used for lighting and heating are also subject to this tax. This was not taken into account in the present study«
c) Italy
All electricity consumption is subject to an "imposta erariale". For domestic consumers the rates are :
Lire 1.10 per kWh in Northern and Central Italy and Lire 0.55 per kWh in the South and the Islands.
16
For industrial consumers in the North and Central part of the country the "imposta erariale" is
Lire 1.1 per kWh for the first 200 000 kWh/month Lire 0.65 per kWh for the remainder«
In the South and Islands these rates are Lire 0.55 a*^ Lire 0.32 respectively«
Also since February 1982, the local Communes may apply an additional tax of Lire 5,0 per kWh on all consumption by consumers with a
subscribed demand of up to 500 kW« This tax has so far been applied by around 50% of the Communes«
These taxes are part of the price on which VAT is charged.
d) Denmark
A special Government tax on electricity wae introduced in April 1977« In January 198O this tax was 8 ¿re per kWh, but was increased to 12.5 /re per kWh on 30th June I98O. This tax is included in the basis of assessment of VAT, and is deductible for those industries registered for VAT«
e) Greece
V. CONCLUSIONS
As explained in Chapter III, the international comparison tables (Nos. 18 and I9) are drawn up in Purchasing Power Standards (PPS) and Euro-pean Currency Units (ECU).
Table 17 gives the conversion rates between national currencies and PPS and ECU.
The difficulties involved in comparing price levels internationally mean that possible interpretations and conclusions drawn from tables 18 and 19 should be treated -with caution, especially as it has been necessary to use estimated values for the GDP price indices for I98I and 1982.
The locations chosen for the Community comparison are as in the pre-vous study, except that Athens has been added, to represent Greece.
1. OVERALL IMPRESSIONS
Analysis of price evolution over a period of just two years is difficult, although certain features are apparent.
Current prices continue to increase, both in national currencies and in ECU, with the exception of prices to large industries in Greece.
On the other hand, once inflation has been taken into account, it can be seen that electricity price rises for households did not always compensate for the monetary erosion which took place during the same period. However, this is not generally the case for industry.
2. HOUSEHOLD PRICES
For the standard consumers Da and Db, prices are most expensive in Brussels. However, the progressive tariff system in Italy puts Milan ahead of Brussels for standard consumer De, in PPS, although in ECU Brussels remains the most expensive. For the "all-electric" house (De)
Rotterdam is the most expensive.
In both PPS and ECU Milan is cheapest for small consumers Da and Db, whereas London is cheapest for the "all-electric" house.
3. INDUSTRY PRICES
For industry, Dublin is the most expensive location, both in PPS and ECU. In ECU, Paris is the cheapest location for all industrial
con-sumers, but when prices are expressed in PPS Copenhagen is cheaper for the small standard consumers la and lb.
I - Introduction
II - Conditions et méthodes 1. Champ couvert
2. Consommateurn-types
3. Définition des prix relevée 4· Tension tarifaire
III - Unités de valeur
IV - Fisoalité
V - Conclusions
ANNEXE STATISTIQUE
Tableaux
1 - 16 P r i x pour usages domestiques «t i n d u s t r i e l s , par p l a c e s 17 Tables de conversi on SPA e t EOT e t i n d i c e s d e s p r i x PIB 18 Comparaison communautaire en SPA d e f l a t e
I - INTRODUCTION
La présente publication est une mise à jour peur les années 198I et 1982 de l'étude précédente t
PRIX DE L'ENERGIE ELECTRIQUE 1973 - 1978 EUROSTAT I98O Cat. : CA 28-79-196-2A-C et de son supplément 1978 - I98O.
En général, les mêmes définitions et méthodes ont été appliquées sur le même champ couvert, sauf que, pour la première fois, la Orèce a été incluse. Afin d'éviter des répétitions, seules les lignes essentielles de l'enquête
sont exposées ci-après dans le chapitre "conditions et méthodes". Si néces-saire, on peut toujours se reporter à la publication précédente«
Pour plusieurs raisons, il a fallu restreindre le texte de cette étude à un bref exposé des caractéristiques générales et de la fiscalité applica-ble aux ventes d'électricité« Quelques renseignements complémentaires sur
les tarifs sont disponibles sur demande adressée à l'Office Statistique des Communautés Européennes (Division Energie)·
22
II - CONDITIONS ET METHODES
1. CHAMP COUVERT
Comme dans l'étude précédente, l'enquête concerne dix pays membres de la Communauté et les prix sont relevés sur 29 places ou agglomérations:
RF d'Allemagne
France
I t a l i e
Pays-Bas
Belgique
G.D. Luxembourg
Royaume-Uni
Irlande
Danemark
Grèce
: Hambourg, Hanovre, Dusseldorf, Frankfort sur Main, Stuttgart, Munich, Zone Ouest,
Zone Sud
: Lille, Paris, Marseille, Lyon, Toulouse, Strasbourg
: Nord et centre, Sud et îles
: Rotterdam (GEB) Nord-Hollande (PEN) Nord-Brabant (PNEM)
: Belgique ( t a r i f n a t i o n a l u n i f i é )
: Grand-Duché (CEGEDEL)
: Londres, Glasgow, Leeds, Birmingham
: Dublin
: Copenhague (KB), Nord-Sélande (NESA)
: Athènes (tarif national unifié)
Trois années sont couvertes par cette étude :
1980 - 1981 - 1982
2. CONSOMMATEURSTYPES
L'étude est basée sur le système des consommateurstypes. Ainsi les prix sont relevés pour certains niveaux de consommation, sous certaines con ditions de fourniture, considérés comme représentatifs de la population des consommateurs d'électricité.
Ces consommations typiques restent constantes dans le temps et dans l'espace, condition nécessaire d'une comparabilité des prix entre pays et entre périodes·
a) Usages domestiques (alimentation en basse tension)
Consom mateurs types
Da Db Dc De
Consommation annuelle kWh
Totale (dont nuit) (1)
600 1 200
3 500 ( 1300) 20 000 (15000)
Puissance ■ souscrite in
dicative en kW
3
3 4
49
9
Logementtype
2
50 m 2 pièces+cuisine 70 nu 3 pièces+cuisine 90 nu 4 pièces+cuisine 120 m 5 pièces+cuisine
A titre indicatif, ces consommateurstypes correspondent aux équipements électroménagers suivants :
Da : éclairage, radio, télévision, réfrigérateur, petit appareillage électrique (2)
Db : équipement Da + machine à laver ou lavevaisselle
De : équipement Db avec machine à laver et lavevaisselle + chauffeeau à accumulation
De : équipement dit tout électrique avec chauffeeau et chauffage élec trique fonctionnant par accumulation·
b) Usages industriels (voir point 4 pour la tension d'alimentation)
Consommât eure types
1a
1b
1c
1d
1e
1f
Consommation annuelle
kWh
30 000 50 000 160 000 1 250 000 2 000 000 10 000 000
Puissance maximale appelée kW
30
50
100
500
5OO
2 500
Durée d'utili sation annuelle
1 000 h 1 000 h 1 600 h 2 500 h 4 000 h 4 000 h
La puissance maximale appelée est la puissance maximale quarthoraire relevée dans une année et exprimée en kilowatt (kW).
(1 ) Il n'y a pas de tarif de nuit ou d'heure (2)
creuse en Italie
Par exemple! aspirateur, grille pain, sèchecheveux, mixeur, moulin à
24
La modulation annuelle détermine la régularité avec laquelle l'énergie électrique est prélevée sur le réseau par le consommateur au cours de l'année« Plus cette durée est élevée, plus la consommation a tendance à s'étaler régulièrement au cours des 8 760 Heures de l'année· Elle indi que le nombre d'heures durant lequel le consommateur pourrait atteindre son niveau de consommation annuelle, sous une puissance égale en perma nence à la puissance maximale appelée«
Dans certains cas, pour l'application des tarifs, quelques précisions supplémentaires sont nécessaires :
en cas de tarif basé sur la puissance appelée demihoraire, la puis sance maximale du consommateurtype est nultipliée par le coefficient 0,98
en cas de tarif basé sur une puissance mesurée en kVA, la correction est effectuée en divisant la puissance maximale appelée en kW du
consommateurtype par le coefficient COS φ : 0,90 à 0,95
au cas où la tarification est basée sur des relevés de puissance intégrés sur une période plus courte que l'année, le montant de la prime de puissance est corrigé par application des coefficients mul tiplicateurs suivante:
Tableau de correction de la puissance
Modulation annuelle
Puissance maximale appelée mensuelle
Puissance maximale appelée bimestrielle
Puissance maximale appelée trimestrielle
Moyenne des 3 puissances max« appelées mensuelles les plus élevées
Moyenne des 2 puissances max« appelées mensuelles les plus élevées
Puissance maximale appelée annuelle (definition de base)
la Ib
1 000 h
0,81
0,83
0,86
0,94
0,96
1
le
1 600 h
0,83
0,85
0,88
0,95
0,97
1
Id
2 500 h
0,85
0,87
0,90
0,96
0,98
1
le If
4 000 h
0,90
0,91
0,95
0,98
0,99
1
Tableau de la consommation en heures creuses
Consomma-teurs -types
la
Ib
le
Id
le
If
Modula-tion an-nuelle
h
1 000 1 000 1 600 2 500 4 000 4 000
Consomma-tion annuelle
1 000 kWh
30
50
160
1 250 2 000 10 000Consommation annuelle (en 1
facturée à des prix "heures 000 kWh) creuses" suivant la durée moyenne quotidienne des heures creuses du tarif
7 h 8 h 9 h 10 h
0 0 0 0
0 0 0 0
11 13 16 19
197 225 262 300
438 500 580 660
2 190 2 500 2 900 3 300
11 h 12 h
0 0 0 0 22 25 338 375 740 820 3 700 4 100
3. DEFINITION DES PRIX RELEVES
Les resultats indiquent les prix réellement payés par les consommateurs« Ces prix incluent la location du compteur, les primes fixes et les prix proportionnels« Ils ne concernent pas les frais de raccordement. Les résultats indiquent les prix unitaires, payés par kWh d'électricité consommée. Les prix unitaires résultent du quotient du prix total payé par l'utilisateur pour la consommation-type annuelle considérée, par le nombre de kWh consommés«
Les prix sont relevés et calculés suivant les tarifs, conditions et
règles en vigueur au début de chaque année« Ainsi, lorsque des paramètres tarifaires changent en cours d'année, il n'en est pas tenu compte« Autre-ment dit, il n'est effectué aucun calcul de pondération de prix sur une année«
En cas de possibilité d'application de plusieurs tarifs et après élimi-nation des tarifs qui n'étaient pas utilisés ou qui ne correspondaient qu'à un nombre négligeable d'usagers, c'est le tarif le plus avantageux pour le consommateur qui a été pris en compte«
26
Il a été tenu compte des formules tarifaires particulières et supplé-mentaires s'appliquent éventuellement à l'énergie électrique réactive« La présentation des niveaux de prix est la suivante :
Trois valeurs sont présentées : - les prix hors taxes
- les prix hors TVA (mais les autres taxes comprises) - les prix toutes taxes comprises«
Le montant d e s t a x e s s ' o b t i e n t p a r d i f f é r e n c e .
Les t a x e s d i s t i n g u é e s i c i correspondent aux p e r c e p t i o n s f i s c a l e s qui s ' a p p l i q u e n t d i r e c t e m e n t à l ' é l e c t r i c i t é , au niveau de l a vente au consommateur. Les t a x e s p r é l e v é e s en amont comme l e s impôts d i r e c t s s u r l e s s o c i é t é s ou s u r l e s s a l a i r e s , qui font évidemment p a r t i e des coûts de p r o d u c t i o n , ne sont pas i s o l é e s dans c e t t e é t u d e .
D ' a u t r e s renseignements s u r l e s t a x e s sont données dans l e c h a p i t r e IV.
Les r é s u l t a t s p a r pays sont exprimés en monnaie n a t i o n a l e courante«
I l s ' a g i t donc de v a l e u r s nominales«
Pour l a comparaison i n t e r n a t i o n a l e , i l a f a l l u r e c o u r i r à une u n i t é monétaire commune, qui s o i t r e p r é s e n t a t i v e e t qui provoque l e minimum de d i s t o r s i o n dans l ' e s p a c e et dans l e temps« A i n s i , l a p r é s e n t e étude u t i l i s e l e STANDARD DE POUVOIR D'ACHAT (SPA), qui e s t d é f i n i e t e x p l i c i t é dans l e c h a p i t r e I I I «
On a a u s s i p r é s e n t é des t a b l e a u x de comparaison i n t e r n a t i o n a l e exprimés en U n i t é de Compte européenne (ECU).
TENSION TARIFAIRE
La t e n s i o n d ' a l i m e n t a t i o n sous l a q u e l l e l ' é l e c t r i c i t é e s t f o u r n i e à l ' u t i l i s a t e u r e s t un élément qui peut e x p l i q u e r d e s d i f f é r e n c e s de n i v e a u de p r i x pour l ' i n d u s t r i e . P l u s l a t e n s i o n e s t é l e v é e , p l u s l e p r i x de v e n t e b a i s s e . Mais dans ce c a s , le t r a n s f o r m a t e u r é l e c t r i q u e
se t r o u v e à l a charge du consommateur, avec l e s c o û t s d ' i n v e s t i s s e m e n t , de l o c a t i o n e t c .
Dans l a p r a t i q u e , l e s t e n s i o n s d ' a l i m e n t a t i o n v a r i e n t selon l e s r é s e a u x e t l e s t a r i f i c a t i o n s .
la, Ib
le
Id
le
If
BR Deutschland t Süd Gebiet
Hamburg,Hannover Düsseldorf, Frankfurt
West Gebiet
S t u t t g a r t »München
F r a n c e
I t a l i a
N e d e r l a n d : GEB PNEM
PEN
B e l g i q u e / B e l g i ë
Luxembourg
U n i t e d Kingdom
I r e l a n d
Danemark
Greece
<-<eo.38
0.38 0.38<r
0 . 4 1 5
0 . 3 8
<-->
«τ-Ο .415
0.38 0.4
-- 2 0
- 1 0
—10
- 1 5
< 5 0
— 1 0 — 1 0
-10/15
20
-<r
10
10-- >
11
10
->
->
>
65 ->
38
28
III. UNITES DE VALEUR
Pour permettre des comparaisons entre pays, les prix exprimés en monnaies nationales doivent être convertis en une unité commune. Dans
cette étude deux unités communes sont utilisées : l'unité monétaire européenne (ECU) et le standard de pouvoir d'achat (SPA).
a) L'unité monétaire européenne (ECU)
L'ECU est basé sur un "panier" de monnaies de neuf états membres de la Communauté, converties aux taux de change du marché. Il est défini comme la somme des montants forfaitaires suivants : DM 0,828
UKL 0,0885 FF 1,15 Lit I09 HFL 0,286 BFR 3,66
LFR 0,14 DKR 0,217 IRL 0,00759· La Grèce sera introduite dans le calcul fin I985.
Les facteurs de conversion de l'ECU sont donnés dans un tableau en annexe.
L'ECU reflète bien les fluctuation? des taux de change et s'avère donc adapté à mesurer les prix du commerce extérieur et les valeurs des flux internationaux.
Une comparaison en ECU se place donc dans l'optique du touriste qui achète des biens et services dans un pays étranger, après avoir con-verti des devises à la banque. Ceci diffère de l'optique du SPA qui est celle du consommateur qui achète des biens et services dans son propre pays avec la monnaie nationale.
L'ECU présente l'inconvénient de changer de définition lors de l'intro-duction d'une nouvelle monnaie et de manquer de cohérence avec les indices de prix du produit intérieur brut (difficultés pour déflater).
b) Le standard de pouvoir d'achat (SPA)
Le SPA est une unité de référence dont les relations avec les diffé-rentes monnaies nationales sont proportionnelles aux parités de pouvoir d'achat (PPA} entre ces monnaies.
Les PPA, qui sont calculées pour tous les emplois du PIB, reflètent les relations entre les niveaux des prix des différents pays; elles in-diquent les quantités de monnaie nationale nécessaires pour acheter dans chaque pays le même panier de bien et services compris dans les emplois du PIB. Dans la présente publication, seules les PPA au niveau du PIB sont utilisées.
Il faut remarquer que la fixation de l'unité du SPA n'influence pas la
comparaison entre pays. Lorsque les prix sont convertis en SPA à l'aide
de la parité du PIB le jugement suivant devient possible s
si un Gigajoule d'énergie coûte 10 SPA dans le pays A et 5 SPA dans le pays B ceci signifie que, après qu'on ait éliminé les différences entre les niveaux généraux de prix des deux pays, ce Gigajoule d'énergie est deux foie plus cher dans le pays A que dans le pays B.
Ce jugement est indépendant des taux de change monétaires et donc des fluctuations de ceux-ci provoquées par les mouvements de capitaux, la spéculation, les décisions publiques etc.
Les facteurs de conversions des années couvertes par cette étude sont donnés dans un tableau en annexe.
c) Prix en SPA "constants"
Lorsque les prix courants pour une année donnée sont convertis en SPA à l'aide des PPA courantes de cette même année les comparaisons entre pays ont la signification mentionnée sous le point b); cependant la comparaison temporelle qu'on pourrait dériver pour chacun des pays a peu d'intérêt.
Tout d'abord, il faut remarquer que les parités courantes de chaque année entre chaque monnaie et le SPA sont le résultat d'une extra-polation obtenue en multipliant les parités de l'année de base par l'indice de prix du PIB de chaque pays et en les divisant par l'indice communautaire du PIB.
Ce dernier indice étant incorporé dans la parité extrapolée de tous les pays, il peut être éliminé lors de l'extrapolation sans que le résultat de la comparaison entre paye change.
En éliminant l'indice communautaire, l'application des parités extra-polées signifie que pour chaque pays les prix de chaque année sont divisés par l'indice de prix du PIB du pays (défiâtes) et convertis à l'aide de la parité de l'année de référence.
Donc la comparaison entre pays n'est pas affectée par l'élimination de l'indice communautaire du PIB et les comparaisons dans le temps pour un même pays acquièrent une nouvelle signification intéressante.
En effet, lorsque le prix d'un produit d'une année donnée deflate par l'indice de prix du PIB du même pays et converti en SPA à l'aide de la parité de l'année de référence est divisé par le prix de l'année de référence également converti en SPA à l'aide de cette même parité, on obtient un indice relatif de prix, c'est à dire le rapport entre l'in-dice de prix concerné et celui du PIB.
30
d) Séries de prix
Sur base des descriptions précédentes, les résultats de la présente enquête de prix dans la communauté sont présentés sous trois formes :
1) séries de prix courants en monnaies nationales, pour chaque pays;
2) série en ECU courants, utilisant les taux de change de janvier de l'année concernée;
IV - FISCALITE
1« TAXE A LA VALEUR AJOUTEE (TVA)
Dans sept des dix pays de l a Communauté, l e s ventes d'électricité sont
soumises à l a TVA« Comme on le voit sur le tableau ci-après, les taux
varient largement d'un pays à l'autre :
%
du prix hors TVA
RF d'Allemagne
France
I t a l i e (domestique)
I t a l i e (industrie)
Pays Bas
Belgique
Luxembourg
Danemark
janvier
1980
13
17.6
6
14
18
16
5
20,25
janvier
1981
13
17,6
8
15
18
16
5
22
janvier
1982
13
17t6
8
15
18
17
5
22
Un taux nul est appliqué aux ventes d ' é l e c t r i c i t é au Royaume-Uni et en
Irlande. En Grèce l a TVA n'a pas encore été introduite«
32
2. AUTRES TAXES
a) RF d'Allemagne
Depuis l e 1er janvier 1975 une taxe compensatoire (Ausgleichsabgabe)
est perçue, en application de l a l o i de protection du charbon commu
nautaire destiné aux centrales électriques· Les taux varient selon
l e s régions, mais la moyenne fédérale s ' é t a b l i s s a i t à :
1980 - 4,5$ 1981 - 4,5$ 1982 - 4,2$
Cette taxe compensatoire entre dans l ' a s s i e t t e de l a TVA.
b) France
Les ventes d ' é l e c t r i c i t é en basse tension sont sujettes à des taxes
locales, munioipales et départementales«
Sur l e s places de l'enquête, les taux étaient l e s suivants :
Places
Lille Paris Marseille
Lyon Toulouse Strasbourg
Taxe municipale
8
13,2
8
8
8
0
Taxe départ.
1
-4
-2
4
Total
9
13,212
8
10
4
Ces taxes sont perçues sur 80% de l a facturation t o t a l e hors TVA»
Elles r e s t e n t hors de l ' a s s i e t t e de l a TVA·
Les fornitures en haute tension pour éclairage et chauffage sont
aussi assujettie» à ces taxes, mais ce cas n ' a pas été appliqué à
l a présente étude.
c) I t a l i e
Toute consommation d'électricité est sujette à un impôt du Trésor (imposta erariale)·
Pour les usagers domestiques les taux sont :
1,10 LIT par kWh pour le nord et le centre de l'Italie 0,55 LIT par kWh pour le sud et les îles
Pour les usagers industriels, les taux de l'impôt du trésor sont dans le nord et le centre de l'Italie t
LIT 1,1 par kWh sur la première tranche de 200 000 kWh/mois LIT 0,65 par kWh sur le surplus
Dans le sud et les îles les taux sont respectivement de LIT 0,55 et LIT 0,32,
Depuis février 1982, les communes peuvent aussi appliquer une taxe additionnelle de LIT 5 Par kW*1 sur toute la consommation des usagers
ayant une demande souscrite jusqu'à 500 kW· Cette taxe est appliquée dans 50% des communes environ«
Toutes ces taxes entrent dans l'assiette de la TVA«
d) Danemark
La taxe gouvernementale spéciale introduite en a v r i l 1977 é t a i t
perçue au taux de :
8 / r e par kWh en janvier I98O
12,50 / r e par kWh à p a r t i r du 30 juin I98O.
Cette taxe est incluse dans l ' a s s i e t t e de l a TVA« Elle est déduc
t i b l e pour l e s a s s u j e t t i s au régime de TVA déductible«
· ) Grèce
Les ventes d ' é l e c t r i c i t é aux consommateurs domestiques sont s u j e t t e s
à une taxe sur les chiffres d ' a f f a i r e s , au taux de 8%.
34
V. CONCLUSIONS
Comme indiqué dans le chapitre III, les tableaux de comparaison inter-nationale (N° 18 et 19) sont présentés en standard de pouvoir d'achat (SPA) et en unité monétaire européenne (ECU). Le tableau 17 donne les taux de conversion entre SPA, ECU et monnaies nationales.
Du fait des difficultés de comparaison internationale des nivaux de prix, les interprétations et conclusions tirées de ces tableaux doivent être considérées avec prudence, d'autant plus que l'on a dû utiliser des indices de prix du PIB estimés pour I98I et I982.
Les places choisies dans la comparaison communautaire sont les mêmes que dans l'étude précédente, sauf qu'Athènes a été ajouté pour représenter la Grèce.
1 . IMPRESSION D'ENSEMBLE
Une analyse d'évolution de prix sur une période limitée à deux ans est difficile, cependant quelques traits apparaissent.
Les prix courants poursuivent leur hausse autant en monnaies nationales qu'en ECU, à l'exception des prix pour la grande industrie en Grèce. D'autre part, si l'on tient compte de l'inflation, on s'aperçoit que
les hausses de prix de l'électricité à usages domestiques ne compensent pas toujours l'érosion monétaire, pendant la même période. Ceci n'est pas le cas en général pour l'industrie.
2. PRIX POUR USAGES DOMESTIQUES
Pour les petits usagers (Da et Db) les prix sont les plus élevés à Bruxelles, mais le système de tarif progressif en Italie place Milan au dessus de Bruxelles pour le consommateur-type De en SPA, bien qu'en ECU Bruxelles reste le plus cher.
Pour une fourniture "tout électrique" (De) Rotterdam s'avère le plus cher.
A la fois en SPA et en ECU, Milan est meilleur marché pour Da et Db, tandis que Londres est meilleur marché pour une fourniture "tout électrique".
3. PRIX POUR USAGES INDUSTRIELS
Pour l'industrie, Dublin est la place la plus chère, tant en SPA qu'en ECU. En ECU, Paris est le meilleur marché pour tous les consommateurs
industriels, mais lorsque les prix sont exprimés en SPA, c'est Copenhague qui s'avère le moins cher pour les consommateurs-types la et Ib.
BR D E U T S C H L A N D Pf/kWh January Janvier Price incl. all taxes Prix TTC Hamfcurg Price excl. VAT Prix hors TVA
Price without taxes Prix hors taxes
Hannover Price incl. all taxes Prix TTC Price excl. VAT Prix hors TVA
Price without taxes Prix hors taxes
FOR HOUSEHOLDS POUR USAGES DOMESTIQUES
Da °b Dc °e 500 kWh 1200 kWh 1980 1981 1982 % 1982/1980 1980 1981 1982 % 1982/1980 1980 (1) 1981 3500 kWh 1982
% 1982/1980
20000 kWh
1980 2) " S I
1982 % 1982/1980 31,67 38,30 40,70 + 28,5* 26,03 31,32 33,11 + 27,396 20,18 24,40 25,68 + 27,3# 9,79 11,75 13,40 + 36,9* 28,03 33,89 36,02 23,04 27,73 29,30 17,86 21,59 22,73 8,66 10,40 11,86 26,67 32,25 34,40 21,91 26,38 27,98 17,00 20,54 21,71 8,25 9,90 11,33 33,71 37,84 44,35 + 31,656 25,46 29,07 33,31 + 30.85É 17,49 20,42 22,98 + 31,4* 9,15 12,27 13,58 + 48,456 29,83 33,49 39,25 22,53 25,73 29,48 15,48 13,07 20,34 8,10 10,86 12,02 28,60 32,14 37,74 21,60 24,69 28,34 14,84 17,34 19,55 7,76 10,42 11,56
FOR INDUSTRY POUR USAGES INDUSTRIELS
la 1980
30 000 kWh 1981 (30 kW, 1000 h) 1982
% 1982/1980
lb 1980
50 000 kWh 1981 (50 kW, 1000 h) 1982
% 1982/1980
lc 1980
160 000 kWh 1981 (100 kW, 1600 h) 1982
% 1982/1980
'd 1980 1250 000 kWh 1981
(500 kW, 2500 h) 1982 % 1982/1980
I e 1980 2 000 000 kWh 1981
(500 kW, 4000 h) 1982 % 1982/1980
!f 1980 10 000 000 kWh 1981
(2500 kW, 4000 h) 1982 % 1982/1980
/
^
28,71 34,53 35,93 20,67 24,86 25,88 16,31 19,61 20,41 15,11 18,17 18,90 25,41 30,56 31,80 + 25,1* 18,29 22,00 22,90 + 25,2* 14,43 17,35 18,06 + 25,256 13,37 16,08 16,73 + 25,1* 24,18 29,08 30,37 17,40 20,93 21,87 13,73 16,51 17,25 12,72 15,30 15,98/
^
^ 23,81 26,75 30,37 18,57 20,87 23,71 14,86 16,71 19,15 14,74 16,57 19,00 21,07 23,67 26,88 + 27,6* 16,43 18,47 20,98 + 27,756 13,15 14,79 16,95 + 28,956 13,04 14,66 16,81 + 28,956 20,20 22,72 25,85 15,75 17,73 20,17 12,61 14,19 16,30 12,50 14,07 16,16(1) of which 1 300 kWh at night (2) of which 15 000 kWh at night
ELECTRICITY PRICES
in national currencies
PRIX D'ELECTRICITE
en monnaies nationales
BR D E U T S C H L A N D Pf/kWh
January
Janvier
Düsseldorf
Price incl. all taxes
Prix TTC
Price excl. VAT
Prix hors TVA
Price without taxes
Prix hors taxes
«•ertliche Getiete
Price incl. all taxes
Prix TTC
Price excl. VAT
Prix hors TVA
Price without taxes
Prix hors taxes
FOR HOUSEHOLDS POUR USAGES DOMESTIQUES
Da
Db
Dc
De
600 kWh
1200 kWh
3500 kWh 1980 1981 1982 % 1982/1980 1980 1981 1982 % 1982/1980 1980 1981 1982 % 1982/1980 1980
(2) 1981
20000 kWh 1982
% 1982/1980
34,98 38,55 40,26
+ 15,156
25,94 29,51 31,03 + 19,6)6
18,32 21,88 23,15 + 26,456
10,11 11,97 13,11 + 29,756
30,96 34,11 35,63 22,96 26,12 27,46 16,21 19,36 20,49 8,95 10,59 11,60 29,40 32,40 34,00 21,80 24,80 26,20 15,40 18,39 19,55 8,50 10,06 11,07 31,41 32,96 39,79
+ 26,7)6
24,15 25,70 30,38 + 25,8)6
18,04 19,58 23,03 + 27,7)6
9,32 10,85 12,87 ♦ 38,1)6
27,80 29,17 35,21 21,37 22,74 26,89 15,96 17,33 20,38 8,25 9,60 11,39 26,40 27,70 33,60 20,30 21,60 25,65 15,16 16,46 19,44 7,83 9,12 10,87
FOR INDUSTRY POUR USAGES INDUSTRIELS
1, 1980
30 000 kWh 1981
(30 kW, 1000 h) I9 8 2
% 1982/1980
lb 1980
50 000 kWh 1981
(50 kW, 1000 h) 1 982
% 1982/1980
lc 1980
160 000 kWh 1981
(100 kW, 1600 h) I9 8 2
% 1982/1980
I d 1980
1 250 000 kWh 1981
(500 kW, 2500 h) 1982
% 1982/1980
le 1980
2 000 000 kWh 1981
(500 kW, 4000 h) 1 9 82
% 1982/1980
'f 1980
10 000 000 kWh 1981
(2500 kW, 4000 h) Ί982
% 1982/1980 ^ ^ 22,49 25,05 26,36 17,76 19,79 20,83 15,56 17,55 18,57 14,36 16,22 17,13 19,90 22,17 23,33 + 17,2)6 15,72 17,51 18,43 + 17,2)6 13,77 15,53 16,43 + 19,356 12,71 14,35 15,16 + 19,3)6 18,90 21,05 22,26 14,93 16,63 17,59 13,08 14,75 15,68 12,07 13,63 14,47 24,18 26,87 30,34 23,39 25,99 29,35 20,93 23,26 26,25 16,60 18,44 20,83 14,36 16,14 18,45 13,21 14,79 16,86 21,40 23,78 26,85 + 25,5)6 20,70 23,00 25,97 + 25,5)6 18,52 20,58 23,23 + 25,4)6 14,69 16,32 18,43 + 25,556 12,71 14,28 16,33 + 28,5)6 11,69 13,09 14,92 + 27,6)6 20,32 22,58 25,62 19,66 21,84 24,78 17,59 19,54 22,17 13,95 15,50 17,59 12,07 13,56 15,58 11,10 12,43 14,24
(1) of which 1 300 kWh at night (2) of which 15 000 kWh at night
BR D E U T S C H L A N D Pf/kWh January Janvier Frankfurt /Hain Price incl. all taxes Prix TTC Price excl. VAT Prix hors TVA
Price without taxes Prix hors taxes
Stuttgart Price incl. all taxes Prix TTC Price excl. VAT Prix hors TVA
Price without taxes Prix hors taxes
FOR HOUSEHOLDS POUR USAGES DOMESTIQUES
Da Db Dc D, 600 kWh 1200 kWh 3500 kWh 20000 kWh 1980 1981 1982 % 1982/1980 1980 1901 1982 % 1982/1980 1980 1) 1981 1982 % 1982/1980 1980 (2) 1981 1982 % 1982/1980 34,35 35,61 43,52 + 26,756 26,11 27,38 33,20 + 27,2)6 18,90 20,14 23,96 + 26,8)6 8,88 9,72 11,38 + 28,2)6 30,40 31,31 38,51 23,11 24,23 29,38 16,73 17,82 21,20 7,86 8,60 10,07 29,20 30,30 37,10 22,20 23,30 28,30 16,07 17,13 20,42 7,55 8,27 9,70 36,78 41,01 43,59 + 18,5)6 27,50 30,91 33,04 + 20,1)6 18,93 21,29 22,74 + 20,1)6 8,83 10,54 11,44 + 29,6)6 32,55 36,30 38,58 24,34 27,35 29,24 16,75 18,84 20,13 7,81 9,33 10,12 31,30 34,90 37,20 23,40 26,30 28,20 16,11 18,11 19,41 7,51 8,97 9,76
FOR INDUSTRY POUR USAGES INDUSTRIELS
la 1980
30 000 kWh 1981 (30 kW, 1000 h) 1982
% 1982/1980
lb 1980
50 000 kWh 1981 (50 kW, 1000 h) 1 9 8 2
% 1982/1980
lc 1980
160 000 kWh 1981 (100 kW, 1600 h) 1982
% 1982/1980
ld 1980
1 250 000 kWh 1981 (500 kW, 2500 h) 1982
% 1982/1980
'e 1980 2 000 000 kWh 1981
(500 kW, 4000 h) 1982 % 1982/1980
<f 1980 10 000 000 kWh 1981
(2500 kW, 4000 h) 1982 % 1982/1980 \ ^ 22,92 23,93 27,58 18,13 18,93 21,81 14,81 15,48 17,83 14,17 14,79 17,05 20,28 21,18 24,41 + 20,4)6 16,04 16,75 19,30 + 20,3)6 13,11 13,70 15,78 + 20,4)6 12,54 13,09 15,09 + 20,3)6 19,48 20,37 23,52 15,40 16,10 18,59 12,60 13,17 15,20 12,05 12,59 14,54 30,96 35,03 37,95 30,96 35,03 37,95 23,93 27,09 29,32 18,85 21,35 23,06 15,57 17,53 19,01 14,55 16,28 17,70 27,40 31,00 33,58 + 22,6)6 27,40 31,00 33,58 + 22,6)6 21,18 23,97 25,95 + 22,5)6 16,68 18,89 20,41 + 22,4)6 13,78 15,51 16,82 + 22,1)6 12,88 14,41 15,66 + 21.6J6 26,35 29,81 32,38 26,35 29,81 32,38 20,36 23,05 25,02 16,04 18,16 19,68 13,25 14,91 16,22 12,39 13,86 15,10
(1) of which 1 300 kWh at night (2) of which 15 000 kWh at night
ELECTRICITY PRICES
in national currencies
PRIX D'ELECTRICITE
en monnaies nationales
BR D E U T S C H L A N D Pf/kWh
January Janvier
München
Price incl. all taxes Prix TTC
Price excl. VAT Prix hors TVA
Price without taxes Prix hors taxes
Südliche Oabiat·
Price incl. all taxes Prix TTC
Price excl. VAT Prix hors TVA
Price without taxes Prix hors taxes
FOR HOUSEHOLDS POUR USAGES DOMESTIQUES
Da Db °c De 600 kWh 1200 kWh 1980 1981 1982 % 1982/1980 1980 1981 1982 % 1982/1980 1980 (1) 1981 3500 kWh 1982
% 1982/1980 20000 kWh 1980 2, 1981 1982 % 1982/1980 34,43 37,61 45,20 + 31,3)6 26,62 28,85 34,81 + 30,8)6 20,14 21,83 26,28 + 30,556 9,86 11,05 14,56 + 47,756 30,47 33,28 40,00 23,56 25,53 30,81 17,82 19,32 23,26 8,73 9,78 12,88 29,30 32,00 38,50 22,65 24,55 29,65 17,14 18,57 22,39 8,39 9,41 12,40 35,14 35,14 44,97 + 28,056 27,03 27,03 34,69 + 28,356 20,53 20,53 25,92 + 26,3)6 10,68 11,42 15,09 + 41,3)6 31,10 31,10 39,79 23,92 23,92 30,70 18,17 18,17 22,94 9,45 10,11 13,35 29,90 29,90 38,30 23,00 23,00 29,55 17,47 17,47 22,08 9,09 9,72 12,85
FOR INDUSTRY POUR USAGES INDUSTRIELS
la 1980
30 000 kWh 1981 (30 kW, 1000 h) 1982
% 1982/1980
lb 1980
50 000 kWh 1981 (50 kW, 1000 h) 1982
% 1982/1980
lc 1980
160 000 kWh 1981 (100 kW, 1600 h) 1982
% 1982/1980
ld 1980
1 250 000 kWh 1981 (500 kW, 2500 h) 1982
% 1982/1980
¡e 1980 2 000 000 kWh 1981
(500 kW, 4000 h) 1 9 8 2
% 1982/1980
'f 1980 10 000 000 kWh 1981
(2500 kW, 4000 h) 1982 % 1982/1980 30,11 32,24 37,61 30,11 32,24 37,61 22,72 24,30 28,63 18,14 19,39 23,06 14,18 15,12 18,52 13,89 14,80 18,16 26,65 28,53 33,28 + 24,956 26,65 28,53 33,28 + 24,956 20,11 21,50 25,34 + 26,056 16,05 17,16 20,41 + 27,2)6 12,55 13,38 16,39 + 30,6)6 12,29 13,10 16,07 + 30,8)6 25,63 27,43 32,03 25,63 27,43 32,03 19,34 20,67 24,39 15,43 16,50 19,64 12,07 12,87 15,77 11,82 12,60 15,47 ^ 22,48 22,48 28,58 17,84 17,84 23,05 15,03 15,03 19,56 14,09 14,09 18,90 19,89 19,89 25,29 + 27,1)6 15,79 15,79 20,40 + 29,2)6 13,30 13,30 17,31 + 30,2)6 12,47 12,47 16,73 + 34,2)6 19,13 19,13 24,34 15,18 15,18 19,63 12,79 12,79 16,66 11,99 11,99 16,10
(1) of which 1 300 kWh at night (2) of which 15 000 kWh at night
January
Janvier
F R A N C E
Paria
Price incl. all taxes
Prix TTC
Price excl. VAT
Prix hors TVA
Price without taxes
Prix hors taxes
centimea /kWh
U l l a
Price incl. all taxes
Prix TTC
Price excl. VAT
Prix hors TVA
Price without taxes
Prix hors taxes
FOR HOUSEHOLDS POUR USAGES DOMESTIQUES
Da
Db
Dc
De
600 kWh
1200 kWh
3500 kWh 20000 kWh 1980 1981 1982 % 1982/1980 1980 1981 1982 % 1982/1980 1980 j) 1981 1982 % 1982/1980
1980 (2) " S I 1982 % 1982/1980
78,87 82,17 93,76 + 18,956
57,72 60,57 69,15 + 19,8)6
46,58 48,89 56,60 + 21,5)6
33,98 35,74 41,75 + 22,956
68,04 70,89 80,89 49,80 52,25 59,65 40,18 42,18 48,83 29,31 30,83 36,01 61,54 64,12 73,16 45,04 47,26 53,95 36,34 38,15 44.17 26,51 27,89 32,57 76,81 80,02 91,30 + 18,956
56,21 58,98 67,33 + 19,8)6
45,36 47,61 55,12 + 21,556
33,09 34,81 40,65 + 22,9)6
65,98 68,74 78,43 48,28 50,66 57,83 38,96 40,90 47,35 28,42 29,90 34,92
- Parie
- Paris
» Paris
« Paris
FOR INDUSTRY POUR USAGES INDUSTRIELS
la 1980
30 000 kWh 1981 (30 kW, 1000 h) 1982 % 1982/1980
lb 1980
50 000 kWh 1981 (50 kW, 1000 h) 1982 % 1982/1980
lc 1980
160 000 kWh 1981 (100 kW, 1600 h) 1 98 2
% 1982/1980
ld 1980
1250 000 kWh 1981 (500 kW, 2500 h) 1 98 2 % 1982/1980
le 1980
2 000 000 kWh 1981 (500 kW, 4000 h) 1982 % 1982/1980
'f 1980
10 000 000 kWh 1981
(2500 kW, 4000 h) 1982 % 1982/1980
46,03 48,47 55,66 46,03 48,47 55,66 39,41 41,70 48,46 32,79 34,89 40,36 28,34 30,25 34,67 27,92 29,81 34,14 39,14 41,22 47,33
+ 20,9)6
39,14 41,22 47,33 + 20,9)6
33,51 35,46 41,21
+ 23,0)6
27,88 29,67 34,32
+ 23,1)6
24,10 25,72 29,48 + 22,3)6
23,74 25,35 29,03
+ 22,3)6
39,14 41,22 47,33 39,14 41,22 47,33 33,51 35,46 41,21 27,88 29,67 34,32 24,10 25,72 29,48 23,74 25,35 29,03
- Paris
» Paria
- Paris
• Paris
- Paria
■ Paris
(1) of which 1 300 kWh at night (2) of which 15 000 kWh at night
(1) dont 1 300 kWh de nuit
ELECTRICITY PRICES in national currencies
PRIX D'ELECTRICITE en monnaies nationales
F R A N C E centimes /kWh
January Janvier
Lyon
Price ¡nel. all taxes Prix TTC
Price excl. VAT Prix hors TVA
Price without taxes Prix hors taxes
M a r s e i l l e
Price incl. all taxes Prix TTC
Price excl. VAT Prix hors TVA
Price without taxes Prix hors taxes
FOR HOUSEHOLDS POUR USAGES DOMESTIQUES
Da
Db
Dc
°e
600 kWh
1200 kWh
3500 kWh
1980 1981 1982
% 1982/1980
1980 1981 1982
% 1982/1980
1980 1981 1982
% 1982/1980
1980 (2) " S I 20000 kWh 1982
% 1982/1980
76,31 79,50 90,72
+ 18,956
55,85 58,60 66,90 + 19,8)6
45,07 47,31 54,77
+ 21,556
32,88 34,58 40,39
+ 22,8)6
65,48 68,22 77,84 47,92 50,28 57,40 38,67 40,59 47,00 28,21 29,67 34,65
- PariΒ
« P a r i s
- P a r i s
» P a r i s
78,28 81,56 93,06
+ 18,956
57,29 60,11 68,62 + 19,8)6
46,23 48,53 56,18
+ 21,556
33,72 35,48 41,43
+ 22,956
67,45 70,28 80,18 49,36 51,80 59,13 39,83 41,81 48,41 29,06 30,57 35,70
- P a r i s
« P a r i s
» P a r i s
■ P a r i s
FOR INDUSTRY POUR USAGES INDUSTRIELS
Ig 1980
30 000 kWh 1981 (30 kW, 1000 h) 1982 % 1982/1980
l0 1980
50 000 kWh 1981 ¡50 kW, 1000 h) 1982 % 1982/1980
lc 1980
160 000 kWh 1981 (100 kW, 1600 h) 1982 % 1982/1980
ld 1980
1250 000 kWh 1981 (500 kW, 2500 h) 1982 % 1982/1980
le 1980
2 000 000 kWh 1981 (500 kW, 4000 h) 1982 % 1982/1980
<f 1980
10 000 000 kWh 1981 (2500 kW, 4000 h ) 1982 % 1982/1980
« P a r i s
- P a r i s
- P a r i s
- P a r i s
- P a r i s
- P a r i s
■ P a r i s
• P a r i s
» P a r i s
- P a r i s
« P a r i s
» P a r i s
(1 ) of which 1 300 kWh at night (2) of which 15 000 kWh at night