This is a repository copy of Numerical simulation of near surface rail cracks subject to
thermal contact stress.
White Rose Research Online URL for this paper:
http://eprints.whiterose.ac.uk/88834/
Version: Accepted Version
Article:
Fletcher, D.I. (2014) Numerical simulation of near surface rail cracks subject to thermal
contact stress. Wear, 314 (1-2). 96 - 103. ISSN 0043-1648
https://doi.org/10.1016/j.wear.2013.11.021
eprints@whiterose.ac.uk https://eprints.whiterose.ac.uk/
Reuse
Unless indicated otherwise, fulltext items are protected by copyright with all rights reserved. The copyright exception in section 29 of the Copyright, Designs and Patents Act 1988 allows the making of a single copy solely for the purpose of non-commercial research or private study within the limits of fair dealing. The publisher or other rights-holder may allow further reproduction and re-use of this version - refer to the White Rose Research Online record for this item. Where records identify the publisher as the copyright holder, users can verify any specific terms of use on the publisher’s website.
Takedown
If you consider content in White Rose Research Online to be in breach of UK law, please notify us by
NUMERICAL SIMULATION OF NEAR SURFACE RAIL CRACKS
SUBJECT TO THERMAL CONTACT STRESS
David I Fletchera)
a) Department of Mechanical Engineering, University of Sheffield, UK
+44 114 2227760, D.I.Fletcher@Sheffield.ac.uk
ABSTRACT
Boundary element modelling was conducted to investigate rail cracks subject to combined thermal and contact loading
such as occurs in ÔstudÕ or Ôsquat typeÕ defects in which white etching layer lies above shallow cracks formed without
evidence of plastic flow. An embedded crack at 0.5mm below the rail surface was modelled, revealing a thermal
mechanism of crack opening. Stress intensity values for a range of contact temperatures were calculated.
KEYWORDS: Rolling contact fatigue, Thermal effects, Steel, Rail-wheel tribology, Boundary element modelling
1 INTRODUCTION
Mechanisms of rolling contact fatigue crack growth have become better understood since the importance of lubricants
in their growth was identified by Way in the 1930s [1]. There remain a range of mechanisms to consider in
understanding their growth and a definitive model has not yet been reached, but they all have the common goal of
explaining how cracks can grow in what at first appears to be the compressive stress regime below a rail-wheel contact.
The presence of pressurised fluid acting to open the crack, or a fluid acting as a crack face lubricant are the commonly
accepted mechanisms of growth [2][3].
In this paper a thermal mechanism of crack growth is investigated using a boundary element model. The origin of the
work is analysis of ÔstudÕ, or Ôsquat typeÕ, defects which have appeared over the last 10-15 years, particularly on metro
lines [4][5]. Metallurgical sectioning of rails removed from service has revealed the presence of Ôwhite etching layerÕ
above many of the cracks detected by ultrasonic inspection, indicating transformation of the pearlitic steel to a
martensite structure, requiring exceedance of the steelÕs eutectoid temperature of 727C at atmospheric pressure [6]. The
temperature required may be reduced when heat is combined with pressure, but for a contact pressure of 650MPa the
reduction in the eutectoid temperature is only around 20C [7]. A mechanical mechanism for martensite formation
through severe plastic deformation at low temperature has been identified [8][9], but the remains of undeformed
pro-eutectoid ferrite boundaries within the white etching layer show that this mechanism is not active in the ÔstudÕ
defects examined.
The cracks in ÔstudÕ defects resemble conventional shallow angle rolling contact fatigue cracks in many ways, but
develop with little or no plastic deformation of the rail steel, and with no evidence of corrosion from fluid entry [4]. Fig.
1 and Fig. 2 show a typical stud defect, with undeformed microstructure even immediately below the rail surface. With
evidence of crack growth and thermal input, but not plastic flow, the focus of this investigation has been on a thermal
rather than mechanical mechanism of crack initiation and early growth. The thickness of white etching layer found in
the stud defects examined [4] was up to 125µm indicating significant heat input, and lying below these regions
non-surface breaking cracks were found on the cross-sections examined.
2 CONTACT CONDITIONS
From the mid 2000s defects of the type considered in this paper have appeared on the London Underground (LU)
system [10] showing a contact temperature above 727C could be achieved under certain running conditions. For
investigation of the effect of temperature on near surface cracks, rather than model specific cases it was decided to
consider cases at 20C (effectively ÔcoldÕ), at 500C and at 1000C. A maximum Hertzian contact pressure of 538MPa and
contact half-width of 7.5mm were considered, these being representative of LU for which conformal rail-wheel contact
and low speeds (hence low dynamic loads) are typical. Surface and crack face friction coefficient was taken as 0.3, and
the rail-wheel contact was assumed to be fully sliding. The model includes an embedded crack that would not be subject
to internal lubrication or pressurisation by water, oils or other fluids, so these friction values correspond to a dry crack
in a dry rail.
3 BOUNDARY ELEMENT MODEL
The intention of the work reported here was to create a simple model to understand whether contact temperature could
be important in the growth of near surface cracks in rails. It was therefore decided to use a two dimensional model with
a very simple crack geometry, leaving refinement to examine real crack geometries in three dimensions for future work
if the initial investigation gave promising results. A model of the rail-wheel contact was constructed in two dimensions
using the Beasy boundary element package [11]. A single embedded crack of 5mm long was located horizontally at
0.5mm below the contact surface, and the wheel contact was represented by a Hertzian pressure profile.
The thermal load was applied using the Beasy Ôline potentialÕ boundary condition type, with temperatures specified
relative to a reference for the model of 20C. In each of the ÔhotÕ cases it was assumed that the heat penetrated 0.5mm
into the rail surface, with a linear decline with depth to reach 20C at 0.5mm deep. Some preliminary cases were run
with a step change in temperature from 500C to 20C at 0.5mm deep, and these showed very similar results to the case
with a linear decline in temperature. It was thought the linear decline of temperature with depth was a more realistic
assumption for the modelling, and that complexities such as exponential decay of temperature with depth would not
significantly enhance the modelling. A penetration depth of 0.5mm is large, but was chosen to correlate with the depths
of material found to be transformed to WEL in the metallurgical examination [4], taking into account also that the
transformation to WEL could only take part in the hottest region at the surface and not deeper down where the
temperature decays back to ambient. Knothe and Liebelt [12] use a simple calculation of a thermal penetration depth δ,
Equation 1, for a contact moving at velocity v, with half width a, across a material with thermal diffusivity k. Taking a
as 7.5mm, and using the rail steel properties in Table 1, a penetration depth of 0.5mm corresponds to a vehicle speed of
0.66ms-1 which would represent, for example, a vehicle very shortly after moving off.
v ka 2 = δ (1)
Throughout the modelling it was assumed that the rail surface was heated only in the contact area, and was elsewhere at
20C. The thermal field moves with the contact, and subsequent convection of the heat after the contact passes is not
considered. To identify the peak and range of stress intensity factors contact positions at 2.5mm increments were
examined up to 12.5mm either side of the crack centre.
4 RESULTS & DISCUSSION
The most easily quantified results are the stress intensity factors for the crack tips (Section 4.3). To aid understanding of
these data contour plots of stress with and without the thermal load, and the deformed geometry plots of the cracks are
provided first below.
4.1 Stress due to thermal input
Fig. 3 shows the rail longitudinal stress distribution produced by the thermal load alone (indicated by diamond headed
constrained by the surrounding cold material causing compression in the hot area, and tension below it. Tensile stress in
the rail just below the heated area approaches yield of Ônormal gradeÕ rail steel (around 400MPa [13]). The elastic
model predicts compressive stress exceeding this value so plasticity would be a possibility, however, constraint by
surrounding elastic material outside the contact patch would restrict any plastic flow. Fig. 4 shows the results for stress
in the y (vertical) direction. Peaks and troughs in stress are predicted at the transition regions between hot and cold areas
at the edges of the contact. This corresponds to the vertical expansion of the hot area (see deformed plots Fig. 5 to Fig.
7).
4.2 Deformed surface and cracks
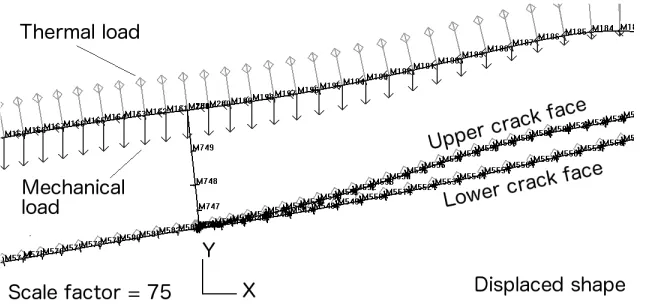
Deformed geometry plots (Fig. 5 to Fig. 7) show both surface and crack faces under combined contact and thermal load.
The thermal expansion of the heated material below the contact patch causes the rail surface to raise slightly, which is
not be the case for models without thermal loading. The deformation is magnified in the plots below for clarity, and
scale factors for magnification are marked on the figures. The compressive stress caused by thermal loading of the
surface is relieved by the thin heated layer rising up, and this provides a crack opening stress which is not present in the
standard, cold, case. This crack opening effect is very similar to the effect of fluids trapped and pressurised by wheels
passing over surface breaking inclined rolling contact fatigue cracks. However, it does not depend on the presence of a
fluid or the sealing of the crack by a passing wheel.
4.3 Stress intensity factor predictions
Mode I (opening) and mode II (shearing) stress intensity factors were extracted from the model through measurement of
crack opening displacements and crack sliding displacements at each contact position modelled, for both tips of the
crack. In presenting the results, the origin of the coordinate system is taken as the centre point of the crack, with the
crack tips at ±2.5mm. Peaks in stress intensity factor may not have been found exactly since the number of contact positions examined was limited. Based on previous studies of stress intensity factors for rolling-sliding contacts and the
general form of the curves [14] the true peaks could be up to 10-15% higher than those identified, but could not be
lower. Table 2 and Table 3 summarise the results, and the plots in Fig. 8 to Fig. 11 show the full set of results as
variations in stress intensity factor as the contact (combined mechanical and thermal load) passes over the crack.
5 INTERPRETATION OF RESULTS 5.1 Trends in the stress intensity factor
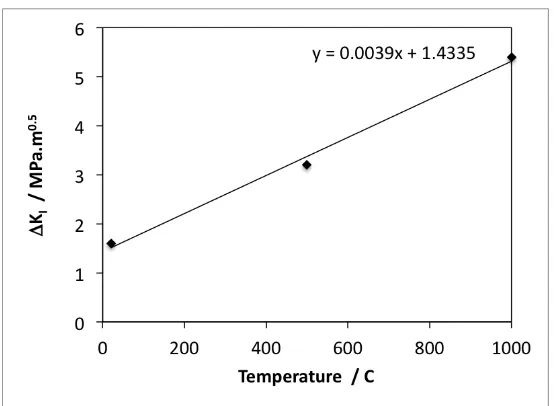
Fig. 8 and Fig. 9 show that mode I (opening) stress intensity is non-zero for both crack tips over part of the wheel
passage despite the compressive wheel load, and without any fluid entry/pressurisation. This stress intensity is increased
by application of the thermal loading, with Fig. 12 showing that the change is approximately linear with temperature at
crack tip 1 (an almost identical trend was found for crack tip 2). The tendency of the thin heated surface layer to rise up
provides a crack opening stress which would not be present in the standard cold case. This crack opening effect is very
similar to the crack opening effect of fluids trapped in surface breaking inclined rolling contact fatigue cracks, and the
findings of Bower [2] for inclined cracks may also be applicable in this case. He found that sustained rolling contact
fatigue crack growth depended on both a reversing shear loading, but also a tensile cycle of stress which would be
supplied by fluid entrapment or pressurisation within the crack. In the current case the contact load is supplying a
reversing shear loading as the wheel passes, and the thermal load is supplying a crack opening stress cycle.
The mode I results indicate that the highest crack opening stresses are reached when the contact is around 10mm away
from the crack tip. Assuming it is moving from left to right, this means the peak is reached well before the contact
reaches crack tip 2 (right), and well after it has passed crack tip 1 (left). Crack tip 1 experiences higher peak stress
differences (and others for model II discussed below) would lead to different propagation behaviour at each tip of an
embedded crack of this type. Although the geometry of the crack investigated here is less complex than found in the
metallurgical investigation [4] these differences in stress intensities may correlate with differences in the extent of
growth observed at the right and left crack tips (Fig. 1).
Fig. 10 and Fig. 11 show results for mode II (shearing) stress intensity factor predictions. As for mode I there is clear
thermal dependence of the results, with the trend shown in Fig. 13 for crack tip 1 (an almost identical trend was found
for crack tip 2). The thermal dependence is much higher in mode II than for mode I, with the linear fit line in Fig. 13
having a gradient of almost 10 times that for the mode I case. This difference in sensitivity to temperature is thought to
be because in mode I thermal opening of the crack acts against mechanical closure by the wheel load giving only a
small net crack opening effect. For mode II the primary effect of the thermal stress is to unlock crack sliding driven by
shear stress from the wheel load, through relief of the compression between the crack faces. Thermal crack opening
unlocks a large crack driving shear stress of much greater significance than any shear due to the thermal loading itself.
5.2 Mixed mode fracture mechanics
The earliest work in fracture mechanics based crack propagation was carried out to model growth under conditions of
sinusoidal tensile loading [15] which is typically found in simple test specimens. For a crack perpendicular to the tensile
load the KI (opening mode) stress intensity varies in proportion to the load, and the KII (shear mode) stress intensity is
zero, leading to crack growth along the existing crack line.
For cases of mixed mode I and II loading Otsuka [16][17][18][19] describes crack growth in terms of maximum shear
stress and maximum tangential stress theory (Equations 2 and 3, originally developed by Erdogan and Sih [20])
assuming that crack growth in fatigue should occur by whichever mode first gives a resultant stress intensity factor
exceeding threshold for the material.
−
=
σ σ σσ
θ
θ
θ
sin
2
3
2
cos
2
cos
2 II IK
K
K
(2)(
)
[
sin
3
cos
1
]
2
cos
2
1
−
+
=
τ τ ττ
θ
θ
θ
II
I
K
K
K
(3)The directions of propagation relative to the existing crack growth direction are θσ and θτ for tensile and shear mode
growth respectively. Applying this method to rolling-sliding contacts for surface breaking contact fatigue cracks Kaneta
et al. [21] showed that the value of θσ which corresponds to the maximum value of Kσ is given by one of the roots of the
derivative of Kσ with respect to θσ, given by Equation 4.
(
)
I IIK
K
=
+
±
=
γ
γ
γ
θ
σ,
4
8
1
1
2
tan
2 (4)Similarly the value of θτ which gives the maximum value of Kτ is found using one of the roots of Equation 5.
I II
K
K
=
=
+
−
−
γ
γ
θ
θ
γ
θ
τ τ τ0
,
2
1
2
tan
2
7
2
tan
1
2
tan
3 2 (5)KI and KII vary non-proportionally during the passage of a wheel over a crack in a rail. The values of KI and KII at each
contact position throughout the wheel passage are therefore used to calculate crack growth direction from Equations 4
governs crack growth direction is not really resolved by the method, but it is assumed that the crack will propagate in
the direction corresponding to the maximum resultant Kσ or Kτ.
Table 4 shows the values of ΔKτ and ΔKσ, the ranges for the passage of the wheel, relevant to crack growth by fatigue.
Table 5 shows the peak stress intensities reached, which are relevant to crack growth by fracture. Fig. 14 to Fig. 17
show the variation of these quantities during the passage of the wheel over the crack so the position of the contact at the
most critical points controlling crack growth can be seen.
5.3 Fracture
When interpreting the predicted stress intensity factors it is useful to remember that the highest level of heat applied to
the contact is expected to be present only briefly, not in every contact pass. Literature on temperature of wheels with
tread brakes indicates that the surface reaches temperatures around 50-350C in normal operation [22][23]. Assuming
that the rail within the contact patch is raised to the same temperature as the wheel when they come into contact,
thermally assisted fatigue crack growth at these lower temperatures would be reasonable, but assuming repeated 1000C
contact would be misleading. Where the very high temperatures may have more influence is in fracture of the rail
material that can be investigated by comparing peak stress intensities with the fracture toughness of the rail. This can
identify if the combined thermal and mechanical load would be capable of generating immediate crack growth in a
single application, although the extent of this growth and the likelihood of continuing crack extension would depend on
the temperature and mechanical load in subsequent contacts.
Literature data shows mode I fracture toughness (KIC) as an average for three premium rail steels was 41MPa.m½, with
a range of 37.25 to 45.75MPa.m½ [24]. Similar values were found in earlier work [25] which considered a wider range
of rail steels including standard carbon steel and head hardened types. Mode II (shear) fracture toughness data could not
be found in the literature, and this value is difficult to measure because under most conditions materials form mode I
branch cracks rather than fracturing in shear. Similarly, for many years the formation of branch cracks in lab specimens
hindered the study of shear mode fatigue cracks in rails, although bi-axial testing was eventually able to reproduce shear
mode fatigue cracking in the laboratory [26] using the combined mode I and II stress cycles predicted for rolling contact
by BowerÕs modelling [2]. Similar work relating to fracture could not be found in a brief literature search.
Taking the pure mode II fracture toughness for ceramics as a guide, KIIC, has been found to vary between 0.7·KIC and
2·KIC [27]. If it is assumed this ratio also applies to rail steel KIIC would be in range 26 to 91.5MPa.m½, or
29-82MPa.m½ if taking the average KIC value. 5.3.1 Considering modes I and II independently
Comparing the peak mode I stress intensity values (Table 3) to the fracture toughness in mode I shows that the
combined thermal and mechanical load is insufficient for fracture to be predicted in any of the cases studied. Looking at
the mode II values, the peak stress intensity factors for the 1000C case exceed the lower end estimates of mode II
fracture toughness. This suggests some immediate fracture growth of an initial defect of 5mm size is possible through a
single application of the thermal and mechanical load considered here. This may either be genuine shear mode growth,
or branch development.
5.3.2 Mixed mode approach
Following the method used by Kaneta at al. [21] for rolling sliding contacts, the peak tensile stress intensity ahead of
the crack when the combination of mode I and II loading is considered together (Kσmax) can be calculated, and is given
in Table 5. Comparing the values at tip 1 of the crack with the mode I fracture toughness shows that crack growth by
fracture will not occur under cold (20C) or 500C contact conditions. For the 1000C contact the predicted stress intensity
account uncertainties in the model input and differences in steel quality, this suggests crack growth by fracture may be
possible. At tip 2 of the crack the Kσmax values are well below the fracture toughness under all the conditions examined.
Examining pure shear mode growth on the plane of maximum resolved shear stress it is important to remember that this
mode of fracture is hardly ever experienced. However, Table 5 does show the exceedance of the lower end of the range
of estimated mode II fracture toughness for the 1000C contact case at tip 1 of the crack. This supports the possibility of
immediate crack extension under the condition of a 1000C contact temperature, which would not occur under cold or
moderately hot contact conditions.
5.4 Fatigue crack growth and stress intensity threshold
Considering fatigue it is only likely that cold or moderately hot contact cases will be repeated rather than the 1000C
case, however, all three are considered here. The significance of the predicted stress intensity factor (SIF) ranges for
fatigue crack growth can be judged by comparison with the fatigue threshold ranges for tensile (ΔKσth) and shear (ΔKτth)
mode growth. As a Ôfirst orderÕ approach it would be possible to compare the mode I stress intensity factor range alone
with the tensile fatigue threshold, and similarly for shear mode growth. However, the situation is mixed-mode, with
both mode I and II stresses present at the same time and it is more realistic to combine the individual mode I and II SIFs
using Equations 2-5 to get resultant tensile and shear mode values. The approach has some difficulties, for example that
mode I and II peak SIFs are almost always out of phase during passage of the contact, but has been usefully applied in
much rolling contact fatigue research and is effectively representing the worst case of peaks in mode I and II stress
occurring together.
For models of rolling contact fatigue cracks including the crack face friction Kaneta et al. [21] found that in the absence
of fluid pressure growth is always by shear, and takes place close to the line of the original crack. The actual angle is
given as θτ, the solution to Equation 5. Otsuka et al. [17] found that crack growth would always occur by a tensile
mechanism in preference to a shear mechanism if either were possible (i.e. when the stress intensity factor exceeds
threshold) and this result was applied by Kaneta et al. [21] in analysis of rolling contact fatigue failures. Although the
crack considered here is not a classic inclined rolling contact fatigue crack it is similar, with the thermal stress rather
than pressurised fluid acting to open the crack. This earlier work can therefore be used to guide assessment of which
modes of failures are predicted by the model.
Threshold stress intensity factors for growth of cracks in carbon steel are available from Otsuka et al. [17] for both
tensile and shear modes of crack growth, with values of ΔKσth=6MPa.m½ and ΔKτth of 1.5MPa.m½. Crack growth in a
rail can therefore be predicted when, during the passage of a wheel contact, either ΔKτ > ΔKτth or ΔKσ > ΔKσth.
However, if both thresholds are exceeded, growth may be expected to take place preferentially by a tensile mechanism.
Table 4 shows the values of ΔKτ and ΔKσ for the current investigation, indicating that for the cold (20C) contact crack
growth would be expected by a tensile mode at tip 1, and a shear mode at tip 2, although all the values of stress intensity
are very close to threshold. This indicates only very slow growth of a crack of the size studied under cold conditions,
and the prediction of growth or no growth will be very sensitive to variation of modelling parameters such as contact
pressure and crack face friction coefficient. The difference in stress intensity factor range and mode of growth for the
two tips of the crack supports the non-symmetrical growth of the cracks which has been observed in the samples
removed from traffic [4].
Under the 500C or 1000C contact cases all the predicted stress intensities exceed threshold, so based on Otsuka et al.
tensile mode growth would be predicted. However, as mentioned at the start of this section, if persistent traction system
events at a specific location are excluded, the repeated application of heated contacts would be dependant on wheel
6 CONCLUSIONS
A simple model has been developed to examine how significant the surface temperature of the rail is to the growth of a
sub-surface defect in a rail suffering from squat type or ÔstudÕ defects. This question was addressed using a 2D
boundary element model of the rail-wheel contact in which stresses due to thermal expansion of the rail steel and
contact loads were combined. The model did not consider the volume change (and consequent additional stress) which
steel undergoes during transformation from pearlite to martensite [28]. The initial defect considered was a horizontal
crack of 5mm size at 0.5mm below the rail surface, aiming to simulate the early stages of the defects observed in the
physical rail examination [4][5].
Temperatures of 1000C, 500C and 20C (referred to as ÔcoldÕ) were considered, covering the range at which martensite
transformation takes place and also the milder case of significant heat input which would not leave this evidence in the
rail. Results were generated in terms of stress intensity factors which can be used to predict fatigue and fracture of the
rail, and also deformed geometry images showing opening and sliding of the crack faces under load which are helpful in
understanding how the crack would develop. The deformed geometry indicated that the compressive stress caused by
thermal loading and expansion of the surface is relieved by the thin heated layer bulging up, and this provides a crack
opening stress which can ÔunlockÕ shear mode crack growth and which would not be present in the standard cold case.
This crack opening effect is very similar to the crack opening effect of fluids trapped in surface breaking inclined
rolling contact fatigue cracks, and it links squat type or stud defects with the findings of Bower [2] that extended shear
mode crack growth in rails is only possible when shear loading from a contact is accompanied by a crack opening stress
cycle.
The predicted peak stress intensity factors showed that crack growth by fracture will not occur under cold (20C) or
500C contact conditions. For the 1000C case the predicted stress intensity factor was very close to the fracture
toughness of typical rail steels. A slightly larger initial defect, higher contact load or a slightly higher contact
temperature would be expected to show fracture toughness exceedance, providing a mechanism of immediate crack
extension at high contact temperatures which would not occur under cold or moderately hot contact conditions.
Considering stress intensity factor range fatigue crack growth can be predicted based on exceedance of fatigue
thresholds available in the literature for rail steels. For the cold (20C) case the model indicates only very slow growth of
a crack of the size studied. Choice of the model parameters such as contact pressure and crack face friction coefficient
could push the value into no growth, or into more definite growth, but it would be likely to be at a very slow rate. Under
the 500C or 1000C contact cases all the predicted stress intensity ranges exceed threshold, so crack growth is predicted.
Growth of cracks through persistent application of high temperature contacts would depend on the wheel temperatures
reached during normal running, or on repeated traction system problems at the crack location.
ACKNOWLEDGEMENTS
The author would like to thank London Underground for funding this work, and Dan Scott and Stuart Grassie for their
contributions to the research.
REFERENCES
[1] S Way, Pitting due to rolling contact, ASME J Applied Mechanics, 2, (1935) A49-58
[2] AF Bower, The Influence of Crack Face Friction and Trapped Fluid on Surface Initiated Rolling Contact Fatigue Cracks, ASME J. Tribol., 110, 4, (1988) 704-711.
[3] M Kaneta, Y Murakami, Propagation of semi-elliptical surface cracks in lubricated rolling/sliding elliptical contacts, ASME J. Tribol.,113, (1991) 270-275.
[5] DI Fletcher, S Lewis, Investigation of rail defects, Report for London Underground, MERail report no. WR120810, The University of Sheffield, 20th August 2010.
[6] WD Callister, Materials Science and Engineering: An Introduction, 2007, John Wiley & Sons.
[7] SB Newcomb, WM Stobbs, A Transmission Electron Microscopy Study of the White-etching Layer on a Rail Head, Materials Science and Engineering, 66 (1984) 195-204.
[8] J Ivanisenko, I MacLaren, X Sauvage, R Valiev, H Fecht, Phase Transformations in Pearlitic Steels Induced by Severe Plastic Deformation, Solid State Phenomena, 114 (2006) 133-144.
[9] S Simon, et al., Tribological characterization of rail squat defects, Wear, 297, 1-2 (2013) 926-942.
[10] D Scott, DI Fletcher, BJ Cardwell, Simulation Study of Thermally Initiated Rail Defects, Accepted by IMechE J Rail & Rapid Transit, 2012, DOI: 10.1177/0954409712465697.
[11] BEASY Boundary Element software, www.beasy.com.
[12] K Knothe, S Liebelt, Determination of temperatures for sliding contact with applications for wheel-rail systems, Wear 189 (1995) 91-99
[13] DI Fletcher, JH Beynon, The effect of intermittent lubrication on the fatigue life of pearlitic rail steel in rolling-sliding contact, Proceedings of IMechE, Journal of Rail and Rapic Transit, 214, 3 (2000) 145-158.
[14] DI Fletcher, JH Beynon, A simple method of stress intensity factor calculation for inclined surface-breaking cracks with crack face friction under contact loading, Proceedings of IMechE, Journal of Engineering Tribology, 213, 6 (1999) 481-486.
[15] P C Paris and F Erdogan. A critical analysis of crack propagation laws. Journal of Basic Engineering, 85 (1963) 528Ð534.
[16] A Otsuka, K Mori, T Oshima, and S Tsuyama. Mode II fatigue crack propagation in aluminium alloys and mild steel. In Advances in Fracture Research, Proceedings of the 5th International Conference on Fracture, volume 4, pages 1851Ð1859, Cannes, 1981. Pergamon, Oxford.
[17] A Otsuka, K Mori, and T Miyata. The condition of fatigue crack growth in mixed mode condition. Engineering Fracture Mechanics, 7 (1975) 429Ð439.
[18] A Otsuka, K Tohgo, T Kiba, and S Yamada. Mode II fatigue crack growth characteristics and mechanisms I: aluminium alloy 7n01-t4 weldments under mode II loading. In Proceedings of the 6th International Conference on Fracture, volume 4, page 1671, New Delhi, India, 1984.
[19] A Otsuka, K Mori, and K Tohgo. Mode II fatigue crack growth in aluminium alloy. In Current research on fatigue cracks, page 127. The Society of Materials Science, Japan, 1984.
[20] F Erdogan and GC Sih. On the crack extension in plates under plane loading and transverse shear. ASME Journal of Basic Engineering, 85 (1963) 519Ð525.
[21] M Kaneta, H Yatsuzuka, and Y Murakami. Mechanism of crack growth in lubricated rolling/sliding contact. ASLE Transactions, 28, 3 (1985) 407Ð414.
[22] JP Amaral Braga, NC Oliveira, OP Montciro, FJD Rcis, Railway wheel temperature measurement system, Transactions on the Built Environment, 6 (1994) 373 Ð 380.
[23] KD Cole, CM Tarawneh, AA Fuentes, BM Wilson, L Navarrob, Thermal models of railroad wheels and bearings, International Journal of Heat and Mass Transfer 53 (2010) 1636Ð1645.
[24] Fracture and Fatigue Damage Tolerance of Bainitic and Pearlitic Rail Steels, U.S. Department Of Transportation Federal Railroad Administration, Research Results, RR06-02, February 2006.
[25] Yasuo Ochi, An evaluation of the fatigue crack growth and fracture toughness characteristics of rail steels, Engineering Fracture Mechanics, 29, 2 (1988) 159-172.
[27] V Tikare, SR Choi, Combined Mode I and Mode II Fracture of Monolithic Ceramics. Journal of the American Ceramic Society, 76, 9, (1993) 2265-2272.
[28] N Narazaki, GE Totten, GM Webster, Hardening by Reheating and Quenching, In Handbook of Residual Stress and Deformation of Steel, Eds. Totten, G, Howes, M, Inoue, T, 2002, ASM International, pp227-274.
Figure captions
Fig. 1:
Composite micrograph of sectioned rail containing a ÔstudÕ defect [4].
Fig. 2:
WEL, including undeformed pro-eutectoid ferrite. [4]
Fig. 3:
Stress in x (longitudinal) direction with thermal load alone (MPa). 1000C at contact surface
falling to 20C over 0.5mm. The heat is applied over the contact patch which is 15mm long.
Fig. 4:
Stress in y (vertical) direction with thermal load alone (MPa). 1000C at contact surface falling
to 20C over 0.5mm. The heat is applied over the contact patch which is 15mm long. The resolution
and smoothness of the plot is low. It could have been enhanced with additional internal calculation
points in the model, but is mathematically correct.
Fig. 5:
Deformed rail surface with contact and thermal load (1000C) -2.5mm relative to crack centre.
The horizontal crack is indicated by thickened lines, the Hertzian contact load by pointed arrows,
and the thermal load by diamond arrows.
Fig. 6:
View of the crack and deformed rail surface with contact and thermal load (1000C) -7.5mm
relative to crack centre. The crack is indicated by thickened lines, the contact load by pointed
arrows, and the thermal load by diamond arrows. Maximum surface height rise due to heating is
approximately 7
μ
m.
Fig. 7:
Detailed view of the crack shown in Fig. 6. The ÔdoubleÕ appearance of the crack indicates it
is open. Shear deformation of the crack walls relative to one another can also be seen by comparing
position of the mesh points that are initially coincident.
Fig. 8:
Variation in mode I stress intensity factor with contact position for cold (20C), 500C and
1000C contact temperatures. Results are for crack tip 1, left side of model.
Fig. 9:
Variation in mode I stress intensity factor with contact position for cold (20C), 500C and
1000C contact temperatures. Results are for crack tip 2, right side of model.
Fig. 10:
Variation in mode II stress intensity factor with contact position for cold (20C), 500C and
1000C contact temperatures. Results are for crack tip 1, left side of model.
Fig. 11:
Variation in mode II stress intensity factor with contact position for cold (20C), 500C and
1000C contact temperatures. Results are for crack tip 2, right side of model.
Fig. 12:
Trend in mode I stress intensity factor range with contact temperature, crack tip 1 (left of
model).
Fig. 14:
Resolved tensile mode stress intensity factor K
σat crack tip 1 (left) for cold (20C), 500C and
1000C.
Fig. 15:
Resolved tensile mode stress intensity factor K
σ at crack tip 2 (right) for cold (20C), 500Cand 1000C.
Fig. 16:
Resolved shear mode stress intensity factor Kτ at crack tip 1 (left) for cold (20C), 500C and
1000C contact conditions.
Tables
Table 1. Material properties
YoungÕs modulus 210 GPa
PoissonÕs ratio 0.3
Thermal expansion coefficient 13 µm/mK
[image:12.595.48.478.276.374.2]Thermal diffusivity (k) 1.1x10⁻⁵ m2/s
Table 2. Stress intensity factor ranges (MPa.m!
)
Contact temperature
Cold (20C) 500C 1000C
Tip 1 (left) ΔKI 1.6 3.2 5.4
ΔKII 6.0 24 43
Tip 2 (right) ΔKI 0 1.3 3.2
[image:12.595.51.479.442.541.2]ΔKII 4.4 20 37
Table 3. Peak stress intensity factors, ignoring sign for mode II values. (MPa.m!
)
Contact temperature
Cold (20C) 500C 1000C
Tip 1 (left) KImax 1.6 3.2 5.4
KIImax 6.0 17.4 30.0
Tip 2 (right) KImax 0 1.3 3.2
[image:12.595.50.478.606.705.2]KIImax 4.4 11.9 19.6
Table 4. Resolved tensile and shear mode stress intensity factor ranges. (MPa.m!
)
Contact temperature
Cold (20C) 500C 1000C
Tip 1 (left) ΔKσ 6.9 20.1 36.0
ΔKτ 6.0 24.0 44.2
Tip 2 (right) ΔKσ 5.1 13.7 22.6
Table 5. Peak resolved shear and tensile stress intensity factors. (MPa.m!
)
Contact temperature
Cold (20C) 500C 1000C
Tip 1 (left) Kσmax 6.9 20.1 36.0
Kτmax 6.0 17.4 30.0
Tip 2 (right) Kσmax 5.1 13.7 22.6
Figures
[image:14.595.123.472.332.569.2]Fig. 1. Composite micrograph of sectioned rail containing a ÔstudÕ defect [4].
Fig. 3. Stress in x (longitudinal) direction with thermal load alone (MPa). 1000C at contact surface falling to 20C over 0.5mm. The heat is applied
[image:15.595.107.490.327.487.2]over the contact patch which is 15mm long.
Fig. 4. Stress in y (vertical) direction with thermal load alone (MPa). 1000C at contact surface falling to 20C over 0.5mm. The heat is applied over
the contact patch which is 15mm long. The resolution and smoothness of the plot is low. It could have been enhanced with additional internal
[image:15.595.141.455.579.713.2]calculation points in the model, but is mathematically correct.
Fig. 5. Deformed rail surface with contact and thermal load (1000C) -2.5mm relative to crack centre. The horizontal crack is indicated by thickened
Fig. 6. View of the crack and deformed rail surface with contact and thermal load (1000C) -7.5mm relative to crack centre. The crack is indicated by
thickened lines, the contact load by pointed arrows, and the thermal load by diamond arrows. Maximum surface height rise due to heating is
[image:16.595.139.463.305.458.2]approximately 7μm.
Fig. 7. Detailed view of the crack shown in Fig. 6. The ÔdoubleÕ appearance of the crack indicates it is open. Shear deformation of the crack walls
relative to one another can also be seen by comparing position of the mesh points that are initially coincident.
Fig. 8. Variation in mode I stress intensity factor with contact position for cold (20C), 500C and 1000C contact temperatures. Results are for crack tip
[image:16.595.153.445.530.720.2]Fig. 9. Variation in mode I stress intensity factor with contact position for cold (20C), 500C and 1000C contact temperatures. Results are for crack tip
2, right side of model.
Fig. 10. Variation in mode II stress intensity factor with contact position for cold (20C), 500C and 1000C contact temperatures. Results are for
[image:17.595.153.447.349.539.2]Fig. 11. Variation in mode II stress intensity factor with contact position for cold (20C), 500C and 1000C contact temperatures. Results are for
crack tip 2, right side of model.
[image:18.595.160.437.327.530.2]Fig. 13. Trend in mode II stress intensity factor range with contact temperature, crack tip 1 (left of model).
Fig. 14. Resolved tensile mode stress intensity factor Kσat crack tip 1 (left) for cold (20C), 500C and 1000C.
[image:19.595.152.444.560.745.2]Fig. 16. Resolved shear mode stress intensity factor Kτ at crack tip 1 (left) for cold (20C), 500C and 1000C contact conditions.
[image:20.595.153.445.328.516.2]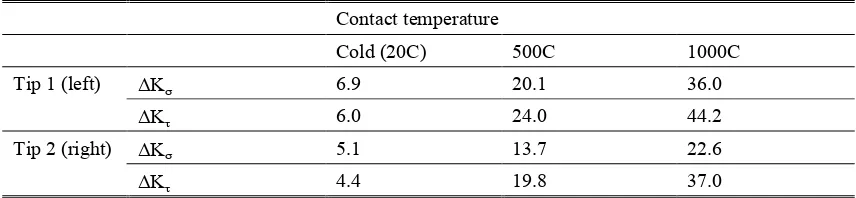

![Fig. 2. WEL, including undeformed pro-eutectoid ferrite. [4]](https://thumb-us.123doks.com/thumbv2/123dok_us/7933135.194140/14.595.123.472.332.569/fig-wel-including-undeformed-pro-eutectoid-ferrite.webp)