White Rose Research Online
[email protected]
Universities of Leeds, Sheffield and York
http://eprints.whiterose.ac.uk/
This is a copy of the final published version of a paper published via gold open access
in
Modelling and Simulation in Engineering
.
This open access article is distributed under the terms of the Creative Commons
Attribution Licence (
http://creativecommons.org/licenses/by/4.0/
) which permits
unrestricted use, distribution, and reproduction in any medium, provided the
original work is properly cited.
White Rose Research Online URL for this paper:
http://eprints.whiterose.ac.uk/85473
Published paper
Chaudhry, H.N., Calautit, J.K. and Hughes, B.R. (2015)
Computational analysis to
factor wind into the design of an architectural environment.
Modelling and Simulation
Research Article
Computational Analysis to Factor Wind into the Design of
an Architectural Environment
Hassam Nasarullah Chaudhry,
1John Kaiser Calautit,
2and Ben Richard Hughes
21School of Energy, Geoscience, Infrastructure and Society, Heriot-Watt University, P.O. Box 294345, Dubai, UAE 2Department of Mechanical Engineering, University of Sheffield, Sheffield S10 2TN, UK
Correspondence should be addressed to Hassam Nasarullah Chaudhry; [email protected] and John Kaiser Calautit; [email protected]
Received 9 November 2014; Accepted 27 January 2015
Academic Editor: Ahmed Rachid
Copyright © 2015 Hassam Nasarullah Chaudhry et al. This is an open access article distributed under the Creative Commons Attribution License, which permits unrestricted use, distribution, and reproduction in any medium, provided the original work is properly cited.
The effect of wind distribution on the architectural domain of the Bahrain Trade Centre was numerically analysed using computational fluid dynamics (CFD). Using the numerical data, the power generation potential of the building-integrated wind turbines was determined in response to the prevailing wind direction. The three-dimensional Reynolds-averaged Navier-Stokes (RANS) equations along with the momentum and continuity equations were solved for obtaining the velocity and pressure field. Simulating a reference wind speed of 6 m/s, the findings from the study quantified an estimate power generation of 6.4 kW indicating a capacity factor of 2.9% for the benchmark model. At the windward side of the building, it was observed that the layers of turbulence intensified in inverse proportion to the height of the building with an average value of 0.45 J/kg. The air velocity was found to gradually increase in direct proportion to the elevation with the turbine located at higher altitude receiving maximum exposure to incoming wind. This work highlighted the potential of using advanced computational fluid dynamics in order to factor wind into the design of any architectural environment.
1. Introduction
The wind power industry has gone through a steady evolution since the 1970s, when interest in generating electricity from the wind was revived. With the global energy concerns about the increasing greenhouse gas emissions, considerable invest-ment has been made into using wind as a renewable source of energy for the purpose of generating electricity. As the world economy continues to be on the rise, the dependency on usage of nonrenewable resources of energy increases in direct proportion. Nevertheless, the nonrenewable potential of these resources is certainly a leading international issue. Fossil fuels are finite. Hence its price needs to be carefully monitored in order to make full exploitation of the resource. In simpler terms, an all-loss system is on hands with the depleting fuel reserves, because of a drastic increase in cost of utilising the fuel or because of extensive damage to the environment as a result of high carbon emissions and green house effects. The expansive prospective of utilizing renew-able resources for producing a much higher percentage of
global energy is promising, in particular wind power. Not only does the use of these resources help in reducing the harmful carbon emissions into the atmosphere, but also its “renewable” potential allows it to push aside the serious con-sequences of depletion of fuel reserves.
Despite the renewable energy generation potential of wind turbines, their integration into high rise building struc-tures has not advanced significantly. Apart from the lack of architectural appeal, the turbulence and wind shadowing effects represent a risk for uptake of the technology in the built environment [1].Figure 1displays examples of existing wind turbines integrated to commercial high rise buildings. In 2007, the Bahrain World Trade Centre introduced the world’s first building-integrated wind turbines (Figure 1(c)). This was the first instance that a commercial development integrated large-scale wind turbines within its design to harness the power of the wind. The three turbines, measuring 29 meters in rotor diameter, were supported by bridges spanning between the complex’s two towers. Through its
(a) (b) (c)
Figure 1: (a) Wind turbines on the roof of twelve west buildings, (b) the Strata tower with three building-integrated wind turbines, (c) Bahrain tower.
Rotor
Rotor diameter
Rotor
Gear box Gear box
Generator
Generator
Hub height
Rotor hub Tip height
Horizontal axis wind turbine Vertical axis wind turbine
[image:3.600.58.543.73.209.2]X Y
Figure 2: Structural comparison between the vertical axis wind turbines and horizontal axis wind turbines [3].
positioning and the unique aerodynamic design of the towers, the prevailing on-shore Gulf breeze is intended to be funneled into the path of the turbines, helping to create power gen-eration efficiency. The anticipated benefits determined that once the system was operational, the wind turbines delivered approximately 11–15% of the energy needs of the building, or 1,100 to 1,300 megawatt-hours per year [2].
There are currently two major types of operational wind turbine technologies which can be used for building inte-gration. These are classified as the horizontal axis wind tur-bines (HAWT) and the vertical axis wind turtur-bines (VAWT). Horizontal axis wind turbines are the more common type of wind turbines in demand. In these turbines, the focus rotor shaft is pointed parallel to the direction of wind while the blades move perpendicular to that direction, thus providing high overall efficiency. On the other hand, the vertical axis wind turbines orientate on vertical axis where the focus rotor shaft is aligned vertically. A two-dimensional “not-to-scale” design modeling based on the two wind turbine technologies is shown inFigure 2. The schematic provides the essential information on the individual situation of the major components in the wind turbine structure [3].
Theoretically, the air velocity incrimination is directly proportional to increasing elevation, as it is unaffected by
the urban environment and surrounding topography. Thus, installing wind turbines on top of buildings allows for taking advantage of this height efficiently. However, in many cases, the building geometry and its aerodynamic features can further assist in enhancing wind turbine performance by inducing a higher volume of air than the macroclimate [4,5]. Numerical analyses involving computational fluid dy-namics (CFD) are often carried out for evaluating building design and energy performances. In the past few years, CFD has been playing an increasingly important role in the design of buildings. The information provided by CFD assists in investigating the impact of building technologies, quantifying indoor environment quality, and integrating renewable energy systems. In this paper, the CFD modeling approach is used in order to determine the influence of building morphology on the efficiency of building-integrated wind turbines.
2. Previous Related Work
[image:3.600.135.462.261.425.2]Chong et al. [6] conducted a study on the design of a wind turbine generator for the purpose of energy consumption in buildings. Two VAWTs in cross-wind orientation were integrated with an enclosure and were installed above a cooling tower in order to harness the discharged wind for electricity generation. The tests were conducted with and without the VAWTs on the performance of the system. From the laboratory testing, it was observed that installing VAWTs at a correct position above the exhaust air system did not indicate any significant negative impacts on the performance of the cooling tower model. The performance of the cooling tower model was improved by the increment of intake air speed and the reduction off the motor power consumption. The rotational speed of the VAWTs was very high (>400 rpm) while the tip speed ratios were in the range of 1.28-1.29, making it preferable for electricity generation.
Sharpe and Proven [7] carried out detailed work on the concept and early development of a building-integrated wind turbine in Scotland. The Crossflex proposal used in this investigation is based on the Darrieus turbines approach, consisting of two or more flexible aerofoil blades attached to both the top and the bottom of a vertical rotating shaft. The blade design incorporated low solidity and low mass materials for its construction. Although the development of this technology is still in its early stage, the study has outlined the remaining tasks of its work. The subsequent stages will involve supplementary computer modeling using CFD analysis to model airflow over the cowling to establish the nature of augmentation and flow stability that may occur and to optimise the design in respect of these.
Lu and Sun [8] presented an integrated method of both macro- (weather data and domain topography) and microas-pect (CFD) analysis in order to design wind turbines around numerous high-rise buildings with predominant wind in Hong Kong. Long-term wind data were compared at dense urban island and small island stations. The mean wind speeds for the urban locations were estimated at 2.93 m/s at 25 m above ground level. The study’s findings determined that the wind power density at 4 m above the building roof was enhanced numerously by 1.3–5.4 times with 5–7 m/s inlet velocity.
Mithraratne [9] investigated the performance of wind turbines mounted on roof-tops, used for microgeneration in municipal houses in New Zealand. The research focused on energy consumption over a lifetime of the wind turbine with respect to the energy generation and greenhouse gas (GHG) emissions at various circumstances in the life cycle. The work concluded that the feasibility level of roof-top wind turbines is generally poor as compared to large-scale wind turbines for microgeneration.
Li et al. [10] investigated the wind loads on the Pearl River Tower building in China to determine the power generation potential of wind turbines using wind tunnel testing. The Pearl River Tower, located in Guangzhou, has 71 stories and rises about 310 m from the ground, which features four open holes (tunnels) equipped with four wind turbines at mechanical floors on two height levels. The objective of this study was to evaluate the wind speed amplifications in the tunnels for wind power generation through the installation
of wind turbines and to gain a better understanding of the wind effects on such a high-rise building with open holes. The findings from the analyses indicated that the bell-mouthed shape of the wind tunnels with contracted inner sections was useful in increasing the wind velocities at the location of the turbines. In addition, the work revealed that the presence of surrounding buildings influences wind speed amplifications and wind loads on the building structure.
In this paper, the effect of wind distribution on the archi-tectural domain of the Bahrain Trade Centre is numeri-cally analysed using CFD. Individual parameters including air velocity distribution, pressure profiles, and turbulence kinetic energy were computationally investigated to illustrate the variations in relation to increasing altitude. The power generation potential of the building-integrated wind turbines was then determined using the study’s findings.
3. Computational Domain
The computational domain is comprised of the building geometry, which was designed according to the actual speci-fications of the high-rise tower and the specific wind turbines. The two 50-storey sail shaped towers are reported to measure to a height of 240 m and support three horizontal-axis wind turbines incorporating a rotor diameter of 29 m [2].
The three-dimensional Reynolds-averaged Navier-Stokes (RANS) equations along with the momentum and continuity equations were solved using the commercial CFD code for the velocity and pressure field simulations. The model employs the control-volume technique and the Semi-Implicit Method for Pressure-Linked Equations (SIMPLE) velocity-pressure coupling algorithm with the second order upwind discretisation. The standard 𝑘-𝑒 transport model which is frequently used for incompressible flows was used to define the turbulence kinetic energy and flow dissipation rate within the model [11,12]. The use of the standard𝑘-𝑒transport model on building configurations has been found in previous works of [3, 13–15]. The turbulence kinetic energy,𝑘, and its rate of dissipation,𝑒, are obtained from the following transport equations formulated in
𝜕
𝜕𝑡(𝜌𝑘) +
𝜕
𝜕𝑥𝑖(𝜌𝑘𝑢𝑖) =
𝜕
𝜕𝑥𝑗 [(𝜇 +
𝜇𝑡
𝜎𝑘)
𝜕𝑘
𝜕𝑥𝑗]
+ 𝐺𝑘+ 𝐺𝑏− 𝜌𝜖 − 𝑌𝑀+ 𝑆𝑘,
(1)
𝜕
𝜕𝑡(𝜌𝑒) +
𝜕
𝜕𝑥𝑖(𝜌𝑒𝑢𝑖) =
𝜕
𝜕𝑥𝑗 [(𝜇 +
𝜇𝑡
𝜎𝑒)
𝜕𝑒
𝜕𝑥𝑗]
+ 𝐶1𝑒𝑘𝑒(𝐺𝑘+ 𝐶3𝑒𝐺𝑏)
− 𝐶2𝜖𝜌𝑒2
𝑘 + 𝑆𝑒,
(2)
where 𝐺𝑘 represents the generation of turbulence kinetic energy due to the mean velocity gradients and𝐺𝑏represents the generation of turbulence kinetic energy due to buoyancy.
𝑌𝑀 represents the contribution of fluctuating dilatation in
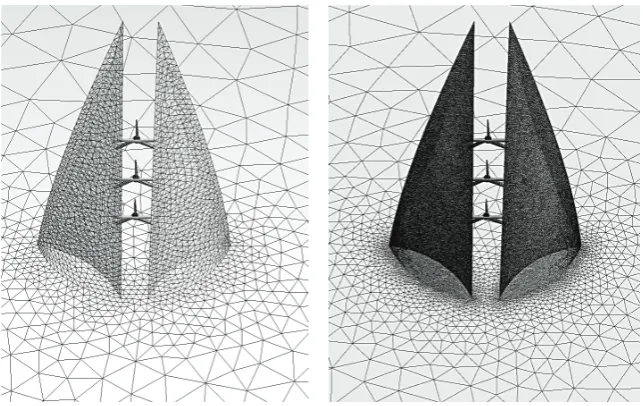
(a) (b)
Figure 3: (a) Actual building configuration, (b) meshed model.
Flow direction
Ground
Inlet
[image:5.600.134.467.73.232.2]Outlet
Figure 4: Representation of the flow domain.
𝐶2𝑒, and𝐶3𝑒are constants;𝜎𝑘and𝜎𝑒are the turbulent Prandtl
numbers for𝑘and𝑒.
3.1. Mesh Generation. Mesh generation is one of the most
important processes in CFD simulation. The quality of the mesh plays an important role in the accuracy of results and the stability of the solution. For the investigated com-putational domain, patch independent CFD tetrahedron meshing technique was applied on the geometry wherein the boundary conditions were applied on the edges and faces. The patch independent mesh algorithm for tetrahedron elements is based on the subsequent spatial subdivision algorithm which ensures refinement of the mesh where essential but retains larger elements where feasible, therefore allowing faster computing times. The meshed model is comprised of 2,013,428 nodes and 10,849,999 elements as displayed in Figure 2. The minimum face angle was 5.67∘ while the maximum edge length and element volume ratios were 9.9 and 44.6. Figures3and4display the schematic of the bench-mark geometry along with the meshed model.
3.2. Grid Independency. In order to verify the accuracy of the
[image:5.600.54.287.280.425.2]numerical models, a grid independency test was carried out
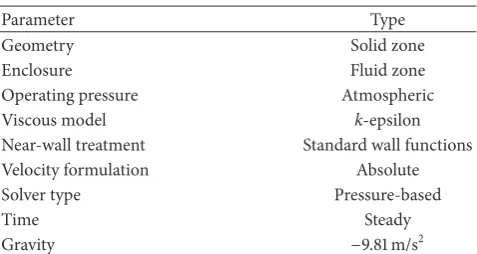
Table 1: Boundary conditions.
Parameter Type
Geometry Solid zone
Enclosure Fluid zone
Operating pressure Atmospheric
Viscous model k-epsilon
Near-wall treatment Standard wall functions Velocity formulation Absolute
Solver type Pressure-based
Time Steady
Gravity −9.81 m/s2
to determine the variation in results over increasing mesh sizes. Basic concepts associated with mesh refinement deal with the refinement and evaluation of elements where the posterior error indicator is larger than the preset criterion, while mesh enrichment considers running higher order polynomials till the solution is expected to improve with a fixed mesh [12]. Grid verification was carried out using mesh refinements (ℎ-method) in order to optimise the distribution of mesh sizeℎover a finite element.
The area-weighted average value of the static pressure on the three wind turbines located on the building fac¸ade was taken as the error indicator, as the grid was refined from 1,519,000 to 10,849,999 elements with the average pressure value being 4.36 Pa. The grid was evaluated and refined until the posterior estimate error became insignificant between the number of elements and the posterior error indicator. The discretisation error was found to be the lowest at over ten million elements for both indicated variables and the mesh was thus selected to achieve a balance between accuracy and computational time (Figure 5).
The𝑦+values at the wall varied between 5 and 61.Figure 6 displays the wall 𝑦+ values and variation in discretisation error at increasing number of meshed elements.
3.3. Boundary Conditions. The applied boundary conditions
[image:5.600.310.549.296.423.2]Figure 5: Low and high volume mesh for grid independence test.
0.0 0.5 1.0 1.5 2.0 2.5 3.0
1,519,000 2,658,250 3,797,500 6,455,749 10,849,999
Dis
cr
etis
atio
n
er
ro
r (%)
Total number of elements
Figure 6: Variation in discretisation error at increasing number of elements.
a height of 300 m (𝑧ref) approaching directly perpendicular to the building fac¸ade [16]. The geometry was modeled as a solid zone while the enclosure was modeled as a fluid zone for the analyses. The boundary conditions were kept identical throughout the numerical investigation for all analysed mod-els.
3.4. Weather and Wind Energy Potential in Bahrain. Bahrain
features relatively hot and arid climate throughout the year. However, from December to March, prevailing winds from the south east bring damp air over the islands. Figure 7 displays the weather statistics along with the wind days per month and wind direction distribution in Bahrain [17]. The predominant wind direction was observed to be from the North West. Evidently, the building structure was oriented in the direction of the dominant prevailing wind in order to allow the turbines to operate at maximum efficiency. Additional simulations were also carried out to investigate the effect of other wind directions ranging from 0∘ to 180∘
in order to understand the effect of wind orientation on the power production capacity of wind turbines.
3.5. Wind Distribution and Turbine Specifications. In order to
estimate how much energy a specific turbine will be expected to produce at a given location, the wind resource at that loca-tion must be identified. A wind turbine works by extracting kinetic energy out of the wind and converting it to mechanical and then electrical energy. The power that is available in the wind to be converted to electrical energy is defined in the following:
𝑃wind= 1
2𝜌𝐴𝑈3, (3)
where𝑃windis the power available in the wind,𝜌is the density of air,𝐴is the swept area of the turbine, and𝑈is the wind speed approaching the wind turbine.
Large-scale integration of wind turbines into buildings requires extensive research and development for it to operate at high efficiencies in order to balance the high cost of instal-lation. The specification of the wind turbines used in this study was mapped on the ones installed on the Bahrain Trade Centre. The fixed horizontal axis wind turbine is comprised of a conventional nacelle design containing an enclosure with the gearbox, cooling system, and the associated control system. The nominal electrical power rating of the turbine was 225 kW with the rotor diameter measuring 29 m. The rotor speed at full load was 38 rpm. The cut-in wind speed for the wind turbine operation was 4 m/s while the cut-out speed was 20 m/s [1].
[image:6.600.59.285.321.472.2]≥4Beaufort (%)
Month of year Jan. Feb. Mar. Apr. May Jun. Jul. Aug. Sep. Oct. Nov. Dec.
Dominant wind direction
Wind probability 41 46 47 39 43 64 50 30 39 28 42 46 42
Average wind speed (kts)
10 11 11 10 11 13 11 9 10 9 10 11 10
19 20 24 28 34 36 37 37 35 32 26 20 29
Year
01 02 03 04 05 06 07 08 09 10 11 12 1–12
Average air temperature (∘C)
(a)
January February
March April May June
July August September October November
December
0 5 10
(m/s)
>6.7m/s >11m/s
>9m/s
(b)
June-all time-avg
(c)
Figure 7: (a) Weather statistics based on observations taken between 2005 and 2014. (b) Wind days per month and (c) wind direction distribution in Bahrain [17].
divided by the area and the expression is displayed in the following:
𝑃density =
1
2𝜌𝑈3. (4)
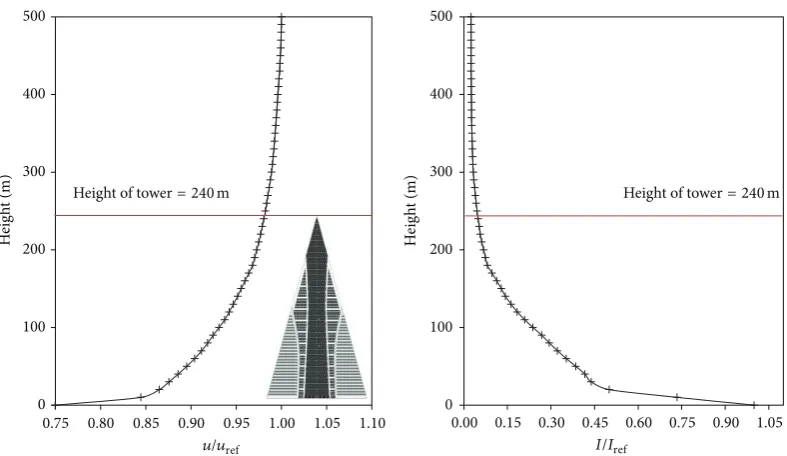
Using the computational domain, a representation of velocity boundary layer profile and turbulence intensity (𝐼) at the windward side of the building is shown inFigure 8 wherein the wind speed is taken from the direction of the sea. The thickness of boundary layer of the atmosphere varies with wind speed, turbulence level, and the type of surface. The power law is an empirical equation expressed in(5). For neutral stability conditions,𝛼is approximately 1/7, or 0.143, regarded as a reasonable but conservative estimate [16]:
𝑢 = 𝑢ref(𝑧ref𝑧 )𝛼, (5)
where𝑢is the speed at a particular point,𝑢refis the reference
speed, 𝑧 is the height at a particular point, and𝑧ref is the reference height.
4. Results and Discussion
4.1. Evaluation of Pressure, Velocity, and Turbulence Profiles.
[image:7.600.95.508.70.422.2]0 100 200 300 400 500
0.75 0.80 0.85 0.90 0.95 1.00 1.05 1.10
H
eig
h
t (m)
0 100 200 300 400 500
0.00 0.15 0.30 0.45 0.60 0.75 0.90 1.05
H
eig
h
t (m)
u/uref I/Iref
Height of tower= 240m
[image:8.600.104.498.70.298.2]Height of tower= 240m
Figure 8: Representation of the boundary layer profile and turbulence intensity.
20Pa
10Pa
4.2Pa
−14Pa
20
[image:8.600.319.538.359.523.2]18 16 14 12 10 8.2 6.2 4.2 2.2 0.25 −1.7 −3.7 −5.7 −7.7 −9.7 −12 −14 −16 −18 −20 −22 −24 −26 −28 −30
Figure 9: Contour levels of static pressure on the surface of the building and ground.
Figure 10: Streamlines and contour levels of velocity magnitude formation upstream and downstream of the building.
Turbulence kinetic energy
0.0 0.3 0.5 0.8 1.0 1.3 1.5 1.8 2.0 2.3 2.5 2.8 3.0 3.3 3.5
(J
k
g
−
1)
[image:8.600.59.279.361.513.2]Contour2
Figure 11: Contour levels of turbulence kinetic energy upstream and downstream of the building.
[image:8.600.87.256.577.715.2]the wind turbine located at the lowest level. At the windward side of the building, it was observed that the layers of tur-bulence intensified in inverse proportion to the height of the building with an average value of 0.45 J/kg. The turbulence kinetic energy was however found to increase (maximum value of 1.35 J/kg) at the leeward side of the building as the wind came in contact and sheared away towards the sides of the structure.
6.5 6.1 5.6 5.2 4.8 4.3 3.9 3.5 3 2.6 2.2 1.7 1.3 0.87 0.43 0 6.5 6.1 5.6 5.2 4.8 4.3 3.9 3.5 3 2.6 2.2 1.7 1.3 0.87 0.43 0 6.5 6.1 5.6 5.2 4.8 4.3 3.9 3.5 3 2.6 2.2 1.7 1.3 0.87 0.43 0 6.5 6.2 5.8 5.2 5.5 4.9 4.6 4.2 3.9 3.6 3.3 2.9 2.6 2.3 2 1.6 1.3 0.98 0.65 0.32 0 6.5 6.1 5.6 5.2 4.8 4.3 3.9 3.5 3 2.6 2.2 1.7 1.3 0.87 0.43 0
0∘wind 45∘wind
90∘wind 135∘wind
[image:9.600.130.470.69.399.2]180∘wind
Figure 12: Contour levels showing the wind velocity at high altitude (Wind Turbine 3) at different wind angles.
0 1 2 3 4 5 6 7
0 45 90 135 180
W
ind sp
eed (m/s)
Wind direction (∘)
WT1 WT2
[image:9.600.58.283.447.599.2]WT3
Figure 13: Numerical relationship between extracted wind velocity and wind direction.
extraction was determined at 90∘when the flow was perpen-dicular to the building facade. The graphical representation depicting the relationship between extracted wind velocity and wind direction is displayed inFigure 13.
4.2. Power Density and Wind Turbine Capacity Factor.
Fol-lowing the numerical investigation, an estimation of the wind
0 5 10 15 20 25 30 35 1 10 100 1,000 10,000 100,000
1 5 9 13 17
T ip s p ee d ra ti o W ind p o w er (kW)
Wind speed (m/s)
[image:9.600.309.546.448.597.2]Wind power Tip speed ratio
Figure 14: Analytical relationship between wind power and tip speed ratio at increasing wind speeds.
power characteristics was calculated theoretically. Using the rotor diameter of 29 m for the wind turbine used in the Bahrain Trade Centre, an analytical comparison between power in the wind and the tip speed ratio is illustrated in Figure 14.
Table 2: Estimated power density and capacity factor at varying wind directions.
Wind direction Turbine Velocity (m/s) Estimated power (W) Power density (W/m2) Capacity factor (%)
0∘
Turbine 1 2.6 — — —
Turbine 2 3.3 — — —
Turbine 3 4.1 6,430 43.1 2.86%
45∘
Turbine 1 2.4 — — —
Turbine 2 2.8 — — —
Turbine 3 3.1 — — —
90∘
Turbine 1 2.3 — — —
Turbine 2 1.1 — — —
Turbine 3 0.8 — — —
135∘
Turbine 1 1.7 — — —
Turbine 2 2.1 — — —
Turbine 3 2.2 — — —
180∘
Turbine 1 4.5 10,793 58.1 4.80%
Turbine 2 5.6 22,783 99.3 10.13%
Turbine 3 6.2 29,323 121.9 13.03%
from the air stream. For a grid connected wind turbine with three rotor blades, the optimum tip speed ratio is recom-mended between 6 and 8 [18]. While a linear increase in wind power was obtained with increasing wind speeds, the recommended tip speed ratio values were found to be at 4 m/s and 5 m/s, respectively. Using the wind speeds obtained from the CFD models, the conservative figures of estimated power generation capability of wind turbines for all analysed cases are displayed inTable 2.
Three wind turbines were used on the buildings which were categorised as Turbine 1 (low-altitude), Turbine 2 (mid-altitude), and Turbine 3 (high-altitude). Using the benchmark model, the study quantified an estimate power generation of 6.4 kW indicating a capacity factor of 2.9%. As expected, wind directions ranging between 45∘ and 135∘ had a significant impact on the power production capability of the turbines as the windward velocity dropped below the cut-in speed of 4 m/s. The investigation determined that the wind direction of 180∘yielded most favorable results with a maximum power production capacity of 29.3 kW indicating a high capacity factor of 13%.
5. Conclusion
In this paper, the feasibility of implementing building-inte-grated wind turbines was determined by investigating the effect of structural morphology on the extraction of pre-vailing inlet wind. The power generation capacity of wind turbines was determined using the specifications of the Bahrain Trade Centre which was taken as the benchmark model. The three-dimensional Reynolds-averaged Navier-Stokes (RANS) equations along with the momentum and continuity equations were solved using the commercial CFD code for velocity and pressure field simulations. Using a ref-erence wind speed of 6 m/s, the findings revealed an increase of 15.4% in velocity obtained at the top of the tower. With reference to the turbulence intensity, the investigation
determined that the layers of turbulence intensified in inverse proportion to the height of the building with an average value of 0.45 J/kg. The study quantified an estimate power generation of 6.4 kW indicating a capacity factor of 2.9% for the building model. In addition, the investigation determined that the wind direction of 180∘yielded most favorable results with a maximum power production capacity of 29.3 kW indicating a high capacity factor of 13%. The work concluded that the design parameters of the building enable the prevail-ing wind to be accelerated when in contact with the wind turbines; however there is a possibility to achieve an increase in efficiency by altering the design of future buildings to a more circular cross-sectional fac¸ade.
Conflict of Interests
The authors declare that there is no conflict of interests regarding the publication of this paper.
References
[1] G. M¨uller, M. F. Jentsch, and E. Stoddart, “Vertical axis resist-ance type wind turbines for use in buildings,”Renewable Energy, vol. 34, no. 5, pp. 1407–1412, 2009.
[2] S. Killa and R. F. Smith, “Harnessing energy in tall buildings: Bahrain World Trade Center and beyond,” inProceedings of the 8th World Congress on Tall and Green: Typology for a Sustainable Urban Future (CTBUH ’08), pp. 144–150, Dubai, United Arab Emirates, March 2008.
[3] H. N. Chaudhry and B. R. Hughes, “Computational analysis of dynamic architecture,”Proceedings of the Institution of Mechan-ical Engineers, Part A: Journal of Power and Energy, vol. 225, pp. 85–95, 2011.
[5] B. R. Hughes, H. N. Chaudhry, and S. A. Ghani, “A review of sustainable cooling technologies in buildings,”Renewable and Sustainable Energy Reviews, vol. 15, no. 6, pp. 3112–3120, 2011. [6] W. T. Chong, S. Y. Yip, A. Fazlizan et al., “Design of an
exhaust air energy recovery wind turbine generator for energy conservation in commercial buildings,”Renewable Energy, vol. 67, pp. 252–256, 2014.
[7] T. Sharpe and G. Proven, “Crossflex: concept and early devel-opment of a true building integrated wind turbine,”Energy and Buildings, vol. 42, no. 12, pp. 2365–2375, 2010.
[8] L. Lu and K. Sun, “Wind power evaluation and utilization over a reference high-rise building in urban area,”Energy and Buildings, vol. 68, pp. 339–350, 2014.
[9] N. Mithraratne, “Roof-top wind turbines for microgeneration in urban houses in New Zealand,”Energy and Buildings, vol. 41, no. 10, pp. 1013–1018, 2009.
[10] Q. S. Li, F. B. Chen, Y. G. Li, and Y. Y. Lee, “Implementing wind turbines in a tall building for power generation: a study of wind loads and wind speed amplifications,”Journal of Wind Engineering and Industrial Aerodynamics, vol. 116, pp. 70–82, 2013.
[11] H. N . Chaudhry, J. K. Calautit, and B. R. Hughes, “Numerical analysis of the integration of wind turbines into the design of the built environment,”American Journal of Engineering and Applied Sciences, vol. 7, no. 4, pp. 363–373, 2014.
[12] T. J. Chung,Computational Fluid Dynamics, Cambridge Uni-versity Press, 2002.
[13] J. K. Calautit, B. R. Hughes, and S. A. Ghani, “Numerical investigation of the integration of heat transfer devices into wind towers,”Chemical Engineering Transactions, vol. 34, pp. 43–48, 2013.
[14] J. K. Calautit, B. R. Hughes, and S. A. Ghani, “A numerical investigation into the feasibility of integrating green building technologies into row houses in the Middle East,”Architectural Science Review, vol. 56, no. 4, pp. 279–296, 2013.
[15] B. R. Hughes, J. K. Calautit, and S. A. Ghani, “The development of commercial wind towers for natural ventilation: a review,” Applied Energy, vol. 92, pp. 606–627, 2012.
[16] M. L. Kubik, P. J. Coker, and C. Hunt, “Using meteorological wind data to estimate turbine generation output: a sensitiv-ity analysis,” in Proceedings of the World Renewable Energy Congress, Linkoping, Sweden, May 2011.
[17] Wind & weather statistics Bahrain Airport, 2014,
http://winda-lert.com.
Submit your manuscripts at
http://www.hindawi.com
VLSI Design
Hindawi Publishing Corporation
http://www.hindawi.com Volume 2014
Machinery
Hindawi Publishing Corporation
http://www.hindawi.com Volume 2014 Hindawi Publishing Corporation http://www.hindawi.com
Journal of
Engineering
Volume 2014
Hindawi Publishing Corporation
http://www.hindawi.com Volume 2014 Shock and Vibration
Hindawi Publishing Corporation
http://www.hindawi.com Volume 2014 Mechanical
Engineering
Advances in
Hindawi Publishing Corporation
http://www.hindawi.com Volume 2014
Civil Engineering
Advances inAcoustics and VibrationAdvances in
Hindawi Publishing Corporation
http://www.hindawi.com Volume 2014
Hindawi Publishing Corporation
http://www.hindawi.com Volume 2014
Electrical and Computer Engineering
Journal of
Hindawi Publishing Corporation
http://www.hindawi.com Volume 2014 Distributed
Sensor Networks
International Journal of
The Scientific
World Journal
Hindawi Publishing Corporationhttp://www.hindawi.com Volume 2014
Sensors
Journal ofHindawi Publishing Corporation
http://www.hindawi.com Volume 2014
Modelling & Simulation in Engineering Hindawi Publishing Corporation
http://www.hindawi.com Volume 2014
Hindawi Publishing Corporation
http://www.hindawi.com Volume 2014 Active and Passive Electronic Components
Hindawi Publishing Corporation
http://www.hindawi.com Volume 2014
Chemical Engineering
International Journal of
Control Science and Engineering
Journal of
Hindawi Publishing Corporation
http://www.hindawi.com Volume 2014
Antennas and Propagation
International Journal of
Hindawi Publishing Corporation
http://www.hindawi.com Volume 2014
Hindawi Publishing Corporation
http://www.hindawi.com Volume 2014
Navigation and Observation
International Journal of
Advances in OptoElectronics
Hindawi Publishing Corporation
http://www.hindawi.com Volume 2014
Robotics
Journal ofHindawi Publishing Corporation

![Figure 7: (a) Weather statistics based on observations taken between 2005 and 2014. (b) Wind days per month and (c) wind directiondistribution in Bahrain [17].](https://thumb-us.123doks.com/thumbv2/123dok_us/7874850.182799/7.600.95.508.70.422/figure-weather-statistics-based-observations-taken-directiondistribution-bahrain.webp)