A STUDY TO ANALYZE PATTERNS OF STRUCTURAL
CHANGES IN CLINICALLY SIGNIFICANT DIABETIC
MACULAR EDEMA ON OPTICAL COHERENCE
Submitted in partial fulfilment of requirements of
M.S. OPHTHALMOLOGY
REGIONAL INSTITUTE OF
MADRAS MEDICAL COLLEGE
DR.M.G.R. MEDICAL UNIVERSITY
Dissertation on
A STUDY TO ANALYZE PATTERNS OF STRUCTURAL
CHANGES IN CLINICALLY SIGNIFICANT DIABETIC
MACULAR EDEMA ON OPTICAL COHERENCE
TOMOGRAPHY
Submitted in partial fulfilment of requirements of
M.S. OPHTHALMOLOGY
BRANCH – III
REGIONAL INSTITUTE OF OPHTHALMOLOGY
MADRAS MEDICAL COLLEGE
CHENNAI- 600 003
THE TAMILNADU
DR.M.G.R. MEDICAL UNIVERSITY
CHENNAI
APRIL 2013
A STUDY TO ANALYZE PATTERNS OF STRUCTURAL
CHANGES IN CLINICALLY SIGNIFICANT DIABETIC
MACULAR EDEMA ON OPTICAL COHERENCE
2
CERTIFICATE
This is to certify that this dissertation entitled “A STUDY TO
ANALYZE PATTERNS OF STRUCTURAL CHANGES IN
CLINICALLY SIGNIFICANT DIABETIC MACULAR EDEMA ON
OPTICAL COHERENCE TOMOGRAPHY” is a bonafide record of the
research work done by Dr. SHIVARAJ BUDIHAL, Post graduate in
Regional Institute of Ophthalmology, Madras Medical College and,
Government General Hospital, Chennai-03, in partial fulfilment of the
regulations laid down by The Tamil Nadu Dr.M.G.R. Medical University
for the award of M.S. Ophthalmology Branch III, under my guidance and
supervision during the academic years 2010-2013.
Prof. Dr. R.ravikumar, M.S, D.O Chief, uvea and retina services Regional Institute of Ophthalmology Govt ophthalmic hospital
Chennai - 600008
Prof. Dr. K. MARAGATHAM, M.S
Director and Superintendent I/C
Regional Institute of Ophthalmology
Govt ophthalmic hospital
Chennai - 600008
Prof. Dr. V.KANAGASABAI,M.D.,Ph.D
Dean
Madras Medical College Chennai – 600 003
3
ACKNOWLEDGEMENT
I express my sincere thanks and gratitude to
Prof. DR. V. KANAGASABAI, M.D., Dean, Madras Medical College for
permitting me to conduct this study.
I have great pleasure in thanking professor Dr. K. MARAGATHAM,
M.S., DO., Director and Superintendent RIO – GOH, Madras Medical
College, Chennai, for her valuable advice in preparing this dissertation.
I express my profound gratitude to Prof . Dr. R. RAVIKUMAR
M.S., D.O., my unit chief and my guide for his valuable guidance and
constant support at every stage throughout the period of this study.
I am very grateful to my unit assistants,Prof B.RADHAKRISHNAN
M.S., D.O., Dr. A. PALANIRAJ M.S., Dr. R. PADMAPRIYA M.S., and
Dr. K.RAVIKUMAR, M.S.,for rendering their valuable advice and
guidance for the study.
I wish to express my sincere thanks to all the professors, assistant
professors and all my colleagues who had helped me in bringing out this
study.
Finally, I am indebted to all the patients for their sincere co-operation
4
7
DECLARATION BY THE CANDIDATE
I hereby declare that this dissertation titled “A STUDY TO
ANALYZE PATTERNS OF STRUCTURAL CHANGES IN
CLINICALLY SIGNIFICANT DIABETIC MACULAR EDEMA ON
OPTICAL COHERENCE TOMOGRAPHY” is a bonfide and genuine
research work carried out by me under the guidance of Prof. Dr, R .
Ravikumar M.S.,D.O, Professor Department of Uvea and Retina services ,
Regional institiute of ophthalmology. Government Ophthalmic hospital.
Chennai -600008.
Date
Place
8
CONTENTS
S.NO. TITLE PAGE NO
PART -1
1. INTRODUCTION TO OPTICAL COHERENCE
TOMOGRAPHY
1
2. OPTICAL COHERENCE TOMOGRAPHY PRINCIPLE
AND INTERPRETATION
4
3. SCAN PROTOCOLS FOR MACULA 17
4. RECENT ADVANCEMENTS IN OPTICAL
COHERENCE TOMOGRAPHY
21
5. COMPARISON OF OPTICAL COHERENCE
TOMOGRAPHY WITH OTHER TECHNIQUES OF RETINAL IMAGING
23
6. COMPARISON OF OPTICAL COHERENCE
TOMOGRAPHY WITH OTHER IMAGING
MODALITIES
24
7. INTRODUCTION TO DIABETIC MACULAR EDEMA 26
8. ANATOMY OF RETINA 28
9. RISK FACTORS AND CLINICAL ASSOCIATIONS 37
10. PATHOPHYSIOLOGY 40
11. CLASSIFICATION 43
12. OPTICAL COHERENCE TOMOGRAPHY IN
DIABETIC MACULAR EDEMA
49
13. MANAGEMENT 55
PART II
14. AIM OF THE STUDY 59
15. MATERIALS AND METHODS 60
16. OBSERVATION AND ANALYSIS 62
17. DISCUSSION 80
18. CONCLUSION 85
PART III
19. BIBLIOGRAPHY
20. PROFORMA
21. MASTER CHART
9
ABBREVIATIONS
OCT - Optical coherence tomography
FFA - Fundus fluorescein angiography
DR - Diabetic retinopathy
NPDR - Non proliferative diabetic retinopathy
PDR - Proliferative diabetic retinopathy
WESDR - Wisconsin Epidemiologic Study of Diabetic retinopathy
ETDRS - The Early Treatment Diabetic Retinopathy study
VEGF - Vascular endothelial growth factor
CSME - Clinically significant macular edema
CME - Cystoid macular edema
SRD - Serous retinal detachment
VMT - Vitreomacular traction
10
INTRODUCTION TO OPTICAL COHERENCE
TOMOGRAPHY
A variety of imaging modalities have been utilized to assess the
retinal pathology. Among the frequently used imaging modalities include
the fundus photography, fundus fluorescein angiography, indocyanine green
angiography and ultrasonography. However detailed information about the
retinal microstructure and quantitative retinal thickness are not obtained by
these techniques1.
Thus there existed a need for a technology which could perform
optical biopsy, image at or near the resolution of histopathology without
performing an excisional biopsy2. Recent advances in fibre optics and
technological advancements in laser have provided us with a non contact,
high resolution optical biomedical imaging technology called optical
coherence tomography3.
Optical coherence tomography was first invented in 1990 at
Massachusetts institute of Technology in boston. First in vivo image of
human retina was obtained in 1993 and the first clinical retinal images were
obtained in 1995.Optical coherence tomography has become a revolutionary
11
sectional visualization of retinal structure and other tissues which require
micrometer resolution and millimetre depth perception4.
Low coherence interferometry5 a classical optical measurement
technique along with near broad band light is used by OCT to provide high
resolution cross sectional visualization of tissue morphological structure at
depth significantly greater than penetrating depth offered by confocal
microscopy and conventional bright - field. OCT is analogous to ultrasound
imaging, except that it uses light instead of sound.
Presently OCT is being utilized in 3 different fields of optical
imaging. First is in macroscopic imaging of structures which can be
visualised by the naked eye or with the help of weak magnifications.
Secondly is in microscopic imaging using magnifications upto the limit of
microscopic resolution. Thirdly in endoscopic imaging, using medium and
low magnification6.
Commercially available optical coherence tomography systems are
being used for diverse applications. Few of the areas include in diagnostic
medicine notably in ophthalmology where it is being used for obtaining high
resolution cross sectional images of anterior segment of the eye and retina.
12
diagnose coronary artery disease7. In combination with catheters and
endoscopes enables high-resolution intraluminal imaging of organ systems.
OCT is also being used in non medical fields like in conservation of
paintings and in variety of industrial applications like non destructive
testing, material thickness measurements and in silicon and semiconductor
wafer thickness measurements8.
OCT offers several advantages over the other imaging techniques
• Non contact and non-invasive.
• Easily tolerated by patients especially the children.
• Changes in macular thickness over time can be assessed.
13
BASIC PRINCIPLE OF OPTICAL COHERENCE
TOMOGRAPHY
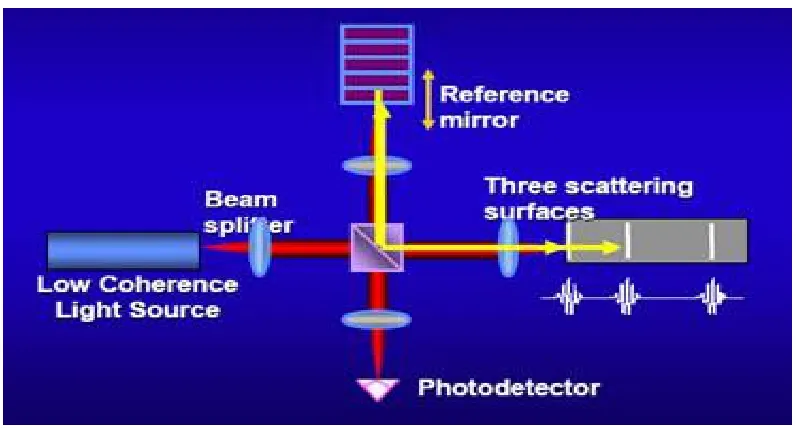
OCT is a non contact, non invasive device based on the principle of
Michelson interferometry9. Broad band with near infrared beam (820nm)
coupled to a fiber optic is projected to a beam splitter and reaches the retina
and a reference mirror respectively after passing through the ocular
media10. Boundaries between the retinal microstructures reflect this light
and also the light is scattered differently by tissues with different optical
properties.
Time delay between light reflected by different layers of retina is
compared with time delay of light reflected from reference mirror at a
known distance. These reflected pulses from the retina and reference mirror
are combined by the interferometer to produce a phenomenon called
interference11.
Photodetector measures the interference. The distance travelled by
various light pulses is determined by varying distance to the reference
mirror. This produces a range of time delay which is compared. The
interferometer constructs a tomogram of retinal structure by integrating
14
using a false colour scale. Degree of light backscattering is represented by
different colours.
Thus the OCT image generated has a 10mm axial resolution and
20mm transverse resolution. A scans are aligned using digital processing to
correct for eye motion. Signal- to- noise ratio is further improved using
digital smoothing techniques12.
Image display
Retinal image can be acquired by using the OCT even in the absence
of pupillary dilation. A 3mm pupil is sufficient for adequate visualization.
Retina is focused by adjusting the imaging lens placed at a distance of 1 cm
from the eye. Position of the scanning beam over the retina is documented
by an infrared- sensitive charge coupled device video camera.
Scan image can be displayed in two forms in an OCT. One is on grey
scale where more reflected light appears brighter than less reflected light.
Other is using a colour scale where different degrees of reflectivity are
represented by different colours. Highly reflective layers appear in bright
colours (white and red) and darker colour represents lowly reflective layers
15
Fig 1 OPTICAL COHERENCE TOMOGRAPHY
Fig2 PRINCIPLE OF OCT
16
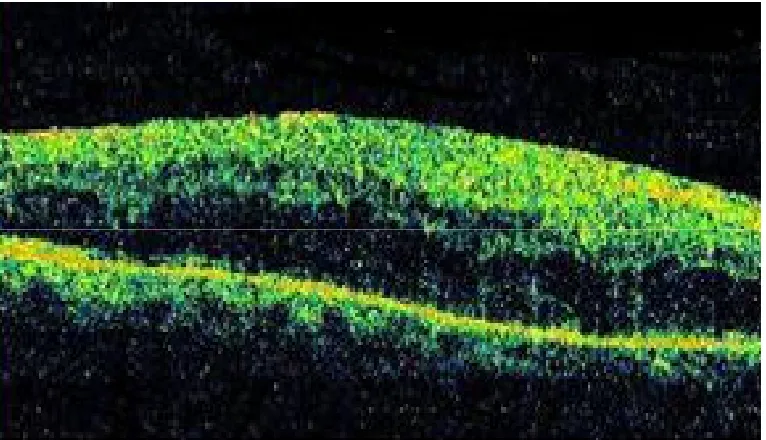
NORMAL OCT SCAN
OCT allows retina to be studied from vitreous to choriocapillaries and
superficial choroidal layers in terms of cross section. Two major structural
landmarks seen on a normal horizontal 10 mm scan include the optic disc
and fovea.
Optic disc is easily identifiable by its contour on the right side of the
tomogram. Optic nerve head cup is seen as a central depression and anterior
part of optic nerve is represented by stalk continuing behind the central
depression. The characteristic thinning of the retinal nerve fibre layer on the
left of the tomogram helps in identifying the fovea.
Dark space anterior to retina represents the vitreous which is not
reflective. Vitreo-retinal interface is the interface between non reflective
vitreous and the first backscattering retinal layer14. The posterior hyaloid is
visible as a faint and slightly reflective line which may be in contact with
retina or detached.
The retinal nerve fibre layer is thicker on nasal side due to density of
papillomacular bundle and is a highly reflective layer. A second
hyper-reflective layer is retinal pigment epithelium - choriocapillaries complex
17
The photoreceptor layer is a minimally reflective layer lying just
anterior to RPE -choriocapillaries complex and its poor reflectivity is due to
vertical orientation of the photoreceptors15. This area is thick in areas of
foveal depression. Alternating layers of moderate and low reflectivity lie
anterior to layer of photoreceptors representing different layers of
neurosensory retina. Plexiform layer are more reflective than nuclear layers.
Retinal blood vessels show backscattering.
Different layers of retina have different reflectivity pattern and are
represented by different colours in false colour map-
a. Highly reflective layers are the retinal nerve fibre layer and
RPE- choriocapillaries complex represented by dark colour.
b. Nuclear layers are hypo-reflective.
c. Plexiform layers are hyper-reflective compared to nuclear layer.
d. Another hyper-reflective structure is the choroid but frequently not
well resolved because reflection of light by overlying RPE.
Thus the structures oriented vertically in retina have lesser reflectivity
18
INTERPRETATION OF THE OPTICAL COHERENCE
TOMOGRAPHY
There are two modes of interpreting an OCT image i.e objective and
subjective. Combination of both of these modes is necessary for accurate
interpretation of the OCT image16.
Retinal abnormalities are detected by OCT in terms of thickness,
morphology and reflectivity.
OCT must be read in two stages
1. Qualitative and quantitative analysis
2. Deduction and synthesis
The analysis study can be further classified into
QUALITATIVE ANALYSIS
1. Morphological study
Variations in morphology - structural changes in overall retina,
retinal outline changes, structural changes within the retina and posterior
layers.
2. Reflectivity study
19
QUANTITATIVE ANALYSIS
This includes surface mapping, retinal volume and thickness. All the
analytical data, results of clinical examination and all the other available
data are compared in deductive and synthetic study.
Protocols are available for both qualitative and quantitative estimation
in the OCT software.
QUALITATIVE ANALYSIS
several image modification protocols are available for qualitative
analysis
1. Normalize-
The background noise is eliminated using this protocol and the signal
strength is improved. Using this protocol scan images are normalized with
respect to noise and signal strength. After application of this protocol to
scan images made with different noise or signal strength, the images appear
"bright" equally. All of the resulting images have the same range of colour.
2. Align
The errors resulting from movements of the patient in axial direction
are corrected using this protocol. Head movement’s toward or away from
the OCT machine results in vertical shifting of the scan image resulting in
20
each of longitudinal A- scans in data set with its neighbour. This process is
called correlation. Data are aligned by sliding A-scan 1 in relation to A-scan
1 till they align. Then A-scan 3 is aligned with A- scan 2 and this process is
repeated till all A scans are aligned thus negating the errors due to the
movement of the patients head.
3. Normalize with align
This protocol performs both the above function.
4. Gaussian and median smoothing
These protocols balance the background noise and blend the colours
of the scan images. By using these protocols the large scale features in data
are better appreciated.
Gaussian smoothing calculates a moving average of signal values in
3x3 regions. Gaussian function is used to weigh the signal values. The outer
points are weighed less compared to the centre point and there by average
are calculated.
Similar to Gaussian smoothing is the median smoothing. Difference
being the median smoothing utilizes the median value of the 3x3 region
unlike the gaussian smoothing which uses the moving average. Median
smoothing has the advantage of preserving small details in data which are
21
5. Proportional
This protocol provides an image that is true in its horizontal and
vertical proportions. Usually the scan image is elongated vertically allowing
complete visualization of longitudinal plane. After using this protocol the
image produced is compressed vertically.
6. Scan profile
The signal values for all data points are provided by this protocol. The
graph changes dynamically on moving the cursor over the OCT image.
These image processing protocols can be used prior to objective assessment
of the OCT scan image. These protocols apply mathematical algorithms for
giving the visual analysis .
MORPHOLOGICAL STUDY
Deformation of retina
A) Concavity:
In certain conditions the OCT may show the presence of pronounced
concavity as in posterior staphyloma and high myopia. However processing
the scan image using the alignment function may make the concavity less
22
B) Convexity:
Sub retinal cysts and retinal pigment epithelial detachment produce
convexity which can be accurately detected by performing on OCT imaging.
DEFORMATION OF THR RETINAL PROFILE
a. Disappearance of foveal depression
Foveal depression can be lost in retinal condition such as macular
edema sub-foveal retinal detachment and other pathologies. This
alteration n foveal contour can be accurately identified by OCT
imaging technique. Assessing the foveal contour also helps in
predicting the response to the treatment.
b. Epiretinal membrane
Can have various presentations, either adherent or separate from the
retina. Folds may be visible on the retinal surface.
c. Macular pseudo hole or lamellar macular hole
d. Macular holes
OCT plays a important role in diagnosing and staging of macular hole.
23
INTRARETINAL STRUCTURAL CHANGES
a. Cysts in cystoid macular edema appear as hypo reflective spaces of
varying size. These are mainly confined to the outer retinal layers.
Fusion of these spaces can occur in chronic cases leading to formation
of very large cystic spaces occupying the full thickness of retinal
layers.
b. Pseudoholes
c. Hard exudates are hyper-reflective shadows at the margin of the
edematous and normal retina and block the reflections from the
underlying retina.
d. Cotton wool spots are hyper-reflective retinal nodules in nerve fibre
layer are present at margins of ischemic lesions of NFL.
POSTERIOR MORPHOLOGICAL CHANGES
a. Retinal pigment epithelial detachment produce deformation of posterior
retina on OCT scan. These form a steep angle with the
choriocapillaries.
b. Serous retinal detachment of form shallow angles with RPE
c. Drusens are seen as irregularities and wavy undulation of the RPE and
24
d. Choroidal neovascular membrane appears as nodular rounded fusiform
structures anterior to RPE. Edema and serous retinal detachment may
be present. Occult neovascular membranes are difficult to detect.
REFLECTIVE STUDY
An OCT scan may show areas of increased or decreased reflectivity
or shadow areas whenever retinal pathology is present.
Shadow areas
A OCT scan shows a shadow area when a area of dense,
hyper-reflective tissue is present producing a screen which may be complete or
incomplete. Elements lying behind the shadow area are concealed.
Anterior shadow and screen effects are seen in
Normal - Retinal blood vessels
Abnormal - Hemorrhage
- Exudates
Posterior shadow and screen effects are seen in
- Pigment epithelial hypertrophy/hyperplasia
- Accumulation of pigment
- Retinal scars
25
QUANTITATIVE ANALYSIS
a) Retinal thickness/ volume
Thickness and volume of the retina are obtained by using this
protocol in the form of two circular maps one for each eye.
b) Retinal thickness/volume tabular
This protocol in addition to providing retinal thickness and volume
also provides a table that displaying average thickness and volume of retina
in each quadrant, ratios and differences between the quadrants and between
the 2 eyes.
c) Retinal thickness/volume change
Retina thickness /volume changes in between examinations can be
26
OCT SCAN PROTOCOLS
various scan acquisition protocols are offered but the Stratus OCT 3.
Appropriate protocols have to be used to get most accurate information.
OCT SCAN PROTOCOLS FOR IMAGING MACULA
1. Line scan
2. Radial scan
3. Macular thickness map
4. Fast macular thickness map
5. Raster lines
6. Repeat scan
ANALYSIS PROTOCOLS
1. Retinal thickness
2. Retinal map
3. Retinal thickness/volume
Line scan
Using this protocol multiple line scans can be acquired without the
need of returning to the main window. Default angle being 00. Nasal
position is taken as 00. It is possible to alter the length and angle of the line
27
image is inversely proportional to the length of the line scan. Protocol also
helps in acquiring multiple scans of different parameters .
Radial scan
This protocol is a combination of 6 to 24 line scan which pass
through a central common axis and are equally spaced. Size and parameters
can be varied .Default setting consists of 6 lines each of which measure 6
mm in length. By adjusting the size of the aiming circle the length of these
line scans is altered. However this change has to be made before saving the
first scan. Macular scan and retinal thickness/volume analysis can be
acquired using radial scans.
Macular thickness map
Similar to radial lines with only difference being that the aiming
circle has a fixed diameter of 6mm.useful for retinal thickness measurement.
Fast macular thickness map
This protocol acquires 6 scans each of 6 mm length quickly i.e within
1.92 second .It is not possible to alter the size and number of scans in this
protocol. This protocol is used with retinal thickness analysis and by
performing in both the eyes retinal thickness and volume can be compared
28
Raster lines
Using this protocol about 6 -24 line scans are obtained which are
parallel and spaced equally. These line scans are acquired over a rectangular
area. Size of this area can be altered to include the entire area of pathology.
This protocol is useful when one wishes to acquire scan at multiple levels as
in choroidal neovascular membrane. Default area is a 3mm square
consisting of 6 lines which are acquired from superior to inferior followed
by nasal to temporal.
Repeat
Using this protocol it is possible to repeat any of the previously saved
protocols which utilize the same parameters like size, angle, placement of
fixation and landmark. It is not possible to change any of the parameters
except for the placement. Landmark is placed on reference point helping in
reproducibility during repeat scan. Landmark can be placed accurately by
looking at the previous image which can be displayed on the screen.
OCT AND SCANNING LASER OPHTALMOSCOPE
TECHNOLOGY
Two specific limitations of OCT include
1. Errors in A - scan image correlation and interpolation- The image
quality becomes less reliable due to increase in correlation and interpolation
29
2. Precise anatomic localization of the OCT image from the red free
image - The red free image showing the position of OCT is not pixel linked.
Because of this the precise anatomic localization is compromised. A newer
device is being developed which provides precise OCT image localization.
It creates OCT B- scan image and uses simultaneous red free scanning laser
ophthalmoscope to achieve this. Horizontal scanning is performed in
ophthalmoscopic plane at increasing depths to create OCT B -scan images.
C scan image is produced by accumulating information from entire plane of
tissue at varying depths. 3-D OCT images can be constructed by processing
numerous C scan images allowing for linear and volumetric measurements.
This device utilizes a beam splitter at the light source to produce two
channels. Conventional SLO is used by one channel to produce red free
image by one channel. Other channel is used to produce simultaneous OCT
images and precise anatomic localization is possible since these images are
pixel linked. Hence this device provides better resolution and image
30
RECENT TECHNOLOGICAL ADVANCEMENTS IN OCT
TECHNOLOGY
a) ULTRA HIGH RESOLUTION OCT
A recent improvement in OCT technology is ultra high resolution
OCT17 that allows for unprecedented in vivo sub cellular and intraretinal
visualization. UHR OCT provides a superior axial image resolution of
compared to that of conventional OCT and thus allows enhanced
visualization of retinal layers and can perform a non invasive biopsy of
retina18.
This improvement is achieved by using ultra broad bandwidth light
source instead of super luminescent diodes used in conventional OCT. A
clinically viable UHR OCT based on femtoseconds titanium-sapphire laser
was developed by Drexler and Fujimoto.
UH OCT is an time domain OCT which provides a axial resolution
of 3 microns and transverse resolution of 15- 20 microns and provides with
both A scan and B scan imaging capabilities. It utilizes femtoseconds
sapphire laser which provides a light with 815 nm wavelength and 125 nm
bandwidth allowing for visualization of foveal and optic disc contour and
internal architecture of retina and choroid which the conventional OCT
31
b) 3D – OPTICAL COHERENCE TOMOGRAPHY
Is the latest technological advancement in the field of OCT which
uses higher speeds and acquires more data in less time providing
unparalleled view of the retinal and subretinal structures with best
resolution. 3D-OCT is base on principle of spectral domain technology19.
Conventional OCT and UHR OCT are based on time domain principle. The
moving parts in conventional OCT are replaced by a stationary spectrometer
in SD-OCT.
Conventional OCT are depend on mechanical movements of internal
components to measure retinal thickness hence limiting the speed and
number of scan acquisitions. Current time domain OCT instruments
measure on 5% of the macular area and approximate 95% of the output data.
Hence a chance to miss very small focal lesions but SD-OCT captures a grid
of data in macular area and is unlikely to miss these small focal lesions.
3D-OCT uses super luminescent diode laser which produces light of 840 nm
and 50 nm bandwidth. It provides axial resolution of 5 microns and
transverse resolution of <20 microns. 3D-OCT can capture 256 B-scans in
succession providing a 3 dimensional cube of details which can be viewed
32
COMPARISON OF OCT WITH STANDARD TECHNIQUES OF
RETINAL IMAGING
Macular thickness can be evaluated by other technique like
stereo-fundus photographs and fluorescein angiography. Retinal thickness assessed
by stereo - fundus photography and macular hyperfluorescence on FFA
correlates well with retinal thickness measured by OCT.
However macular hyperfluorescence on FFA may not always show
increased thickness on OCT and vice versa. Quantitative assessment of
retinal thickness and cross sectional retinal morphology cannot be assessed
by fundus photography and FFA. But origin of macular fluid and retinal
microvascular abnormalities are well defined by FFA and subtle macular
lesions are demonstrated by fundus photography which is not provided by
OCT20. Thus all three imaging techniques provide complementary
33
COMPARISON OF OCT WITH OTHER IMAGING MODALITIES
Different criteria can be used to compare OCT with other imaging
modalities which include depth of imaging, resolution, acquisition time,
complexity and intrusiveness. Imaging depth of OCT is limited to few
millimetres less than CT, MRI or ultrasound but has greater resolution
compared to these modalities.
However confocal microscopy is better than OCT in all these aspects.
The acquisition time in OCT is short similar to the ultrasound sufficient to
support topographic imaging and is thus more tolerant to subject motion
than CT OR MRI.OCT doesn’t require contact with and can be used in air
COMPARISON OF OCT WITH CONFOCAL MICROSCOPY, CT,
MRI AND ULTRASOUND
COMPARISON OF OCT WITH CONFOCAL MICROSCOPY, CT,
MRI AND ULTRASOUND
35
INTRODUCTION
About 4 percent of world population are estimated to be affected by
diabetes mellitus almost half of who have some degree of diabetic
retinopathy at any given time21. In about 86% of type 1 and 33% of type 2
DM patients in western population suffered visual loss due to diabetic
retinopathy22.
World health organisation reported that there has been an epidemic
increase in type 2 DM in India .More than 90% of the patients have type 2
DM being diagnosed usually in 4th decade. However the prevalence of type
2 DM is increasing in children and adolescent population.Diabetic
retinopathy is becoming a important cause of visual disability.
One of the leading causes of blindness worldwide is diabetic
retinopathy. (wilkinson 1988). It is preventable. DR is basically a
microangiopathy occurring as a complication of both the types of diabetes.
Main structures which are affected in this condition are the precapillary
arterioles, capillaries and venules capillaries and venules.
36
In a population based study, Chennai Urban Rural Epidemiology
(CURES) 23Eye Study, in which representative sample of 26,001 individuals
(urban Component) were included, 17.6% of 1715 diabetic patients were
found to have diabetic retinopathy. This study used stereo retinal
photographs and Early Treatment Diabetic Retinopathy Study (ETDRS)
37
ANATOMY OF THE HUMAN RETINA
Retina is the only part of central nervous system which can be
visualized noninvasively as a thin delicate transparent membrane.
Retina can be divided into 3 parts
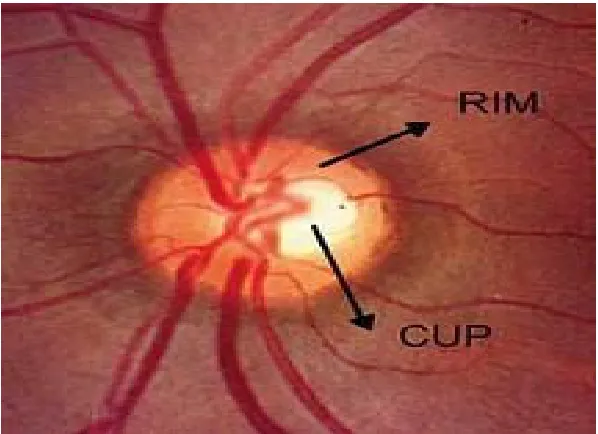
1) Optic disc
1.5 mm well defined circular area appearing pale pink in colour. It is
located about 3 to 4 mm nasal to the fovea. This site of optic disc sees the
termination of all the layers of retina except the nerve fibre layer. This layer
passes through the disc forming the optic nerve. Optic disc has a central
depression called physiological cup which is the entry site for retinal blood
vessels. It represents the physiological blind spot .Blind spot is not
perceived when both the eyes are open because of overlapping of the visual
feilds of both eyes. About 1 to 1.2 million neurons exit from the eye towards
the brain.
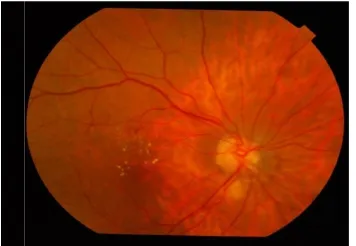
2) Macula lutea
Macula lutea meaning yellow spot in latin is a 5.5mm dark area
situated at the posterior pole. Yellow colour of macula is due to the presence
of lutein and zeaxanthin which are the yellow xanthophyll carotenoids.
It has an elliptical configuration and is located between the upper and lower
arcuate vessels and temporal retinal vessels.
38
a) Fovea centralis
It is the central depressed region of the macula. It is about 1.85 mm
in measurement.
b) Foveola
It measures 0.35mm from central floor of fovea and is located 2 disc
diameter from temporal edge of the disc and 1dd below the horizontal
meridian. It has the highest density of cones (1, 99,000/mm2) which are
narrower and elongated for maximum detection of light. Foveola contains
only cones and few muller cells.
c) Umbo
It appears as a tiny dip at the centre of foveola. It forms the foveolar
reflex which is lost in early stages of macular pathology.
d) Foveal avascular zone24
It is present within the fovea but outside foveola and measures
1.5mm. In this area there are no retinal capillaries and hence fovea is
dependent solely on choriocapillaries for blood supply in this region.
e) Parafoveal and perifoveal regions
39
3) Peripheral retina
Includes the remaining parts of the retina outside the temporal retinal
arteries. Anatomically this region of retina has only one layer of ganglion
cell. It is further divided into
a) Near periphery - Area of 1.5mm around the macula
b) Mid periphery - Area of 3mm around near periphery
c) Far periphery - Extends 16mm from optic disc on nasal side
and 10mm on temporal side in horizontal
meridian
d) Ora serrata - is the region where retina ends and pars plana of ciliary
body starts. Its width is about 2.1mm temporally and 0.7 mm nasally. It
40
Fig 3 OPTIC DISC
Fig 4 MACULA AND PERIPHERAL RETINA
[image:40.612.181.468.382.593.2]41
HISTOLOGY
10 layers have been described in retina. From posterior to anterior
include
1. Retinal pigment epithelium
Made up of a single layer of hexagonal cells which contain pigment
granules. This layer is firmly adherent to underlying bruch,s membrane and
loosely attached to overlying photoreceptors. Sub retinal space is the
potential space between RPE and photoreceptor layer.
2. Photoreceptor layer
This layer consists of end organs of vision i.e photoreceptors (rods
and cones).There are about 120 million rods and 7 million cones. Rods re
absent in fovea.
3. External limiting membrane
It is a fenestrated membrane formed by the junctions between cell
membrane of photoreceptors and muller cells. It is not a true basement
membrane. Processes of photoreceptors pass though these fenestrations.
4. Outer nuclear layer
This layer is formed by the nuclei of photoreceptors i.e rods and
cones. The number of rows of nuclei and thickness of this layer varies in
42
5. Outer plexiform layer
It is made up of synapses between the rod spherules and cone pedicles
with the dendrites of bipolar cells and processes of horizontal cells.
6. Inner nuclear layer
This layer consists primarily of nuclei of bipolar cells. This layer is
absent in fovea.
7. Inner plexiform layer
Consists of synapses between the axons of first order neurons (bipolar
cells) with dendrites of second order neurons (ganglion cells)
8. Ganglionic cell layer
This layer is made up of bodies and nuclei of ganglion cells. Most of
the retina has a single layer of ganglion cells, it is multilayered in macular
region .It has 2 layers on temporal side of the disc.
9. Nerve fibre layer
This layer is composed of unmyelinated axons of ganglion cells.
These axons converge at optic disc and after passing through the lamina
43
10. Internal limiting membrane
It is the innermost layer. It forms the interface between the retina and
vitreous.
BLOOD SUPPLY OF RETINA
Retina has a dual circulation. Outer retinal layers are avascular and
they depend on adjacent choroid for nutrition. Choroidal circulation is
supplied by the ophthalmic artery. Choriocapillaries supply the outer one
third of retina and the inner two thirds are supplied by central retinal artery
which is also a branch of the ophthalmic artery.
In the presence of cilioretinal artery the choroid also supplies the
inner retina.
The retinal arteries are end arteries. These arteries run outwards
within the nerve fibre layer towards peripheral retina. The smaller arterioles
form 2 types of capillary systems. One is horizontal which supplies the
nerve fibre layer .Second are the deeper branches which run into retina to
forming one peripheral and perifoveal network and 4 peripapillary network.
Thus all the layers of neurosensory retina are supplied by the retinal
circulation except the layer of photoreceptor which is supplied by the
44
There are two capillary free zones one around arterioles and at the
fovea which is supplied by diffusion from the choriocapillaries. All the
capillary blood runs back to central retinal vein which ends by draining into
ophthalmic vein or into cavernous sinus directly.
Elastic tissue and smooth muscles are absent in retinal capillary wall which
comprises of
1. Endothelial cells forming a single layer on basement membrane.
Tight junction links the adjacent endothelial cells.
2. Pericytes with multiple pseudopodial processes envelop the
capillaries and lie external to endothelial cells. These pericytes play a
role in auto regulation of micro vascular circulation.
BLOOD RETINAL BARRIER
Retina has two blood retinal barriers - outer and inner blood retinal
barrier. Tight junctions between the endothelial cells of retinal capillaries
form the inner BRB which surrounds all the retinal blood vessels where as
the zona occludens between the RPE form the outer blood retinal barrier.
Both these control the retinal microenvironment. Lipophillic molecules and
45
EPIDEMIOLOGY
The Wisconsin Epidemiologic Study of Diabetic retinopathy
(WESDR) 25documented prevalence of macular edema in 11% overall
among patients with diabetes in sothern wisconsinn. Prevalence was higher
in early onset compared to patients with older onset diabetes. Strong
association was noticed with duration and glycemic status
In some diabetic populations the retinopathy prevalence including
that of DME and CSME appears to be declining due to improved glycemic
control of diabetes.
However the overall prevalence of DME is increasing due to
increasing prevalence of diabetes in industrialized nations .
The WESDR determined a 10 yr rate of DME of 20% in young onset
diabetic patient, 25.4% in older onset diabetics on insulin and 13.9% in
older onset group not on insulin. 99% of type 1 and 60% of type 2 DM pts
develop DR after 20 yrs.
3% of patients with mild NPDR, 38% of patients with moderate to
46
RISK FACTORS AND CLINICAL ASSOCIATIONS
1) Severity
Severity of DR has a strong and positive correlation with macular
edema. Since most patients with PDR do not have DME and vice versa,
ETDRS26 described DR severity scale based on progression to high risk
PDR and excluded retinal thickness per se as a additional risk factor.
2) Duration
Most important risk factor. About 50% of the patients diagnosed with
diabetes before 30 years develop retinopathy after 10 yrs which increases to
90% after 30yrs. 5% of type 2 DM patients have retinopathy at presentation.
Duration of DM also has a strong relationship with prevalence and
incidence of macular edema
3) Poor glycemic controls.
Second most important risk factor indentified for DME is glycemic
control. Intensive control of glycemic status has shown to reduce the
progression of DR, nephropathy and neuropathy as shown by the
Epidemiology of Diabetes Intervention and control study.
4) Pregnancy
Rapid progression of retinopathy may be seen in pregnancy27 and the
47
worsen in pregnancy and is often associated with preexisting retinopathy
and preeclampsia. Poor glycemic control in pregnancy is also a contributing
factor.
5) Hypertension
United Kingdom prospective diabetic study (UKPDS) suggested that
visual loss from macular edema can be ameliorated by having a strict
control of systemic hypertension in type 2 DM28.
6) Nephropathy and proteinuria
Proteinuria is positively correlated with DR however the relationship
between renal failure and macular edema has not been clearly established.
Studies have demonstrated an increase in macular edema occurring in
patients who had fluid retention which improved following diuretics or
hemodialysis.
7) Dyslipidemia
It is an independent risk factor for DME29.
8) Intraocular surgery
May worsen the existing DME. Worsening of DME has been
observed in patients who had coexisting cataract and DME and underwent
48
9) Intraocular inflammation
10) Panretinal photocoagulation , Laser for PDR
Worsening of DME has been observed in patients following PRP
before managing the macular edema. ETDRS research group suggested
performing management of macular edema before doing a PRP in PDR
patients with DME.
11) Anemia
Hypoxia resulting due to anaemia leads to development of
microaneurysms and also leads to other changes in retina.
12) Association with genes
People with HLA DR4 and DR5 phenotype have been found to be
having increased risk of developing PDR
13) Protective ocular factors
Patients with glaucoma and high myopia have been found to be
having lesser prevalence of DR. Also the severity of DR is reduced in these
patients. This has been attributed to lower metabolic demands of the retina
49
PATHOPHYSIOLOGY
Diabetic retinopathy changes occur as result of combination of
several factors which can be structural, rheological, and biochemical.
1) Structural changes associated with diabetic retinopathy
As the blood glucose level increases the tight junctions between the
endothelial cells of capillaries breaks down. There is an increase in
transcellular endocytosis resulting in fluid movement into retinal tissue from
the vessel wall.
At some stage the fluid reuptake mechanism of retina is
overwhelmed by this fluid accumulation resulting in retinal edema
There also occurs
1. Thickening of capillary basement membrane
2. Pericyte loss
3. Endothelial cell loss
4. Dysfunction of endothelial cell
2) Rheological changes
1. Abnormalities of platelet function - Platelets become abnormally
adhesive and aggregate more. Also the survival of platelets is reduced
2. Abnormalities of red blood cell function - Which include reduced
50
3. Blood Protein abnormality - Fibrinogen, haptoglobulin, alfa 2
macroglobulin levels in blood are increased.
3) Biological changes
1) Long standing hyperglycemia.
Advanced glycation end products are formed due to non enzymatic
binding of sugars to proteins. These end products play a crucial role in
producing diabetic complications.
2) Sorbitol pathway
Aldose reductase is an enzyme which converts glucose to sorbitol.
Sorbitol dehydrogenase converts the sorbitol to fructose. However the
reaction catalyzed by sorbitol dehydrogense is slower leading to building up
of toxic levels of sorbitol which cause endothelial damage.
3) Vascular endothelial growth factor.
Has been detected in diabetic retinas, It increases vascular
permeability leading to DME.
4) Protein kinase c - is emerging as another target molecule for
pharmacological management of DME. It is selectively up regulated by
51
CLINICAL PRESENTATION
Depending on the degree of involvement of fovea the symptoms
experienced by the patients with DME vary widely. Gradual painless
progressive loss of vision, colour vision loss, defective night vision and dark
adaptation is experienced by the patient
DME shows following features on clinical examination
a. Macular thickening
b. underlying pattern of choroidal vessels gets blurred
c. Absent foveolar reflex following involvement of fovea
d. Formation of intraretinal cystic spaces.
e. Hard exudates which are lipoproteinaceous materials which may be
52
CLASSIFICATION OF DIABETIC MACULAR EDEMA.
There are classified as
a) Focal type of macular edema
This type of macular edema is characterized by presence of focal
areas of leakage due to presence of microaneursyms and capillary segments
which are dilated. Adjacent normal retina is separated from these areas by
hard exudates which may be arranged in the form of complete or incomplete
rings.
b) Diffuse type of macular edema
It is characterized by breakdown of the blood retinal barrier. There is
leakage from Microaneurysm and dilated capillary bed throughout the
posterior pole. It can have a bilaterally symmetrical presentation.
Exacerbation and amelioration of diffuse macular edema is noted in
association with systemic factors like renal, cardiovascular, systemic
hypertension.
C) Ischemic
Has a variable presentation and may have a normal looking macula
with low visual acuity. FFA shows enlargement of FAZ with foveal non
perfusion and other capillary drop out areas in posterior pole and periphery.
53
CLINICALLY SIGNIFICANT MACULAR EDEMA AS DEFINED BY
ETDRS
ETDRS31 defined clinically significant macular edema (CSME) as
- Retinal thickening within 500mm of centre of the macula.
- Exudates within 500 mm of centre of macula , if associated with
retinal thickening ( which may be outside 500mm)
- Retinal thickening of one disc diameter or larger any part of which is
within one disc diameter of centre of the macula
INTERNATIONAL CLINICAL DIABETIC MACULAR EDEMA
SEVERITY SCALE classified DME as
a) Diabetic macular edema absent - Absence of any retinal thickening or
hard exudates in posterior pole
B) Diabetic macular edema present - Retinal thickening or hard exudates
of some degree in posterior pole.
C) Mild diabetic macular edema - Presence of retinal thickening or hard
exudates in posterior pole but distant from centre of macula.
D) Moderate diabetic macular edema - Retinal thickening or hard
exudates approaching centre of macula but not involving it.
E) Severe diabetic macular edema - Hard exudates or retinal thickening
54
[image:54.612.155.483.327.455.2]Fig 4 FOCAL MACULOPATHY WITH FOCAL LEAK PATTERN
Fig 5 DIFFUSE MACULOPATHY WITH DIFFUSE LEAKAGE
[image:54.612.164.470.561.676.2]CLINICALLY SIGNIFICANT MACULAR EDEMA CLINICALLY SIGNIFICANT MACULAR EDEMA (Fig
Fig 7
Fig 8
Fig 9
[image:55.612.229.407.86.209.2] [image:55.612.223.409.88.659.2]56
EVALUATION OF PATIENTS WITH CSME
various parameters assessed in examination include
1) Visual acuity
Commonly assessed with the snellens distance vision chart or log mar
chart.
2) Colour vision
Tests used is Fransworth Munsell 100 hue test. In patients with DME
the sensitivity of blue cones is reduced. Most common defect observed
is blue yellow.
3) Fields
Charting of fields by tangent screen shows the presence of scotomas.
These scotomas correspond to the retinal area of involvement.
4) Slit lamp biomicroscopy
Allows the assessment of anterior segment pathology and cataract and
when combined with 90 / 78 D lens provides a stereoscopic view of the
fundus which is very useful in cases of CSME.
5) Direct ophthalmoscophy
Provides higher magnification but limited field of view for
57
6) Indirect ophthalmoscopy
Provides a wider field of view but lesser magnification. Useful for
examination of the periphery and in media opacities.
7) Amsler grid
Allows for assessment of patients central visual field
8) Electrophysiological tests
a) Electroretinography - Macular edema is associated with abnormalities
in ERG like delay in implicit time and abnormalities of oscillatory potential
in ascending limb of b wave.
b) Electrooculography - shows abnormal Ardens Ardens ratio
c) Visually evoked potential - shows amplitude reduction .latency remains
normal.
9) Fundus fluorescein angiography
Plays a role in diagnosing, documenting, determining the pattern of
leak, deciding on mode of treatment and follow up of treated patients.
10) Optical coherence tomography
Helps to determine the pattern of DME, retinal thickness,
58
OPTICAL COHERENCE TOMOGRAPHY IN DIABETIC
MACULAR EDEMA
Diabetic macular edema produces several changes at ultra structural
levels of the retina. Topographic view obtained with two dimensional
imaging techniques like fundus photography and FFA help in delineating
the treatable lesions but do not provide an insight into the changes occurring
within retinal layers which is provided by OCT.
The main purpose of doing an OCT in clinically significant DME are
- Define the pattern of DME
- Post treatment follow up of anatomical changes
- Define indications for vitrectomy.
Though slit lamp examination is very sensitive for detecting CSME
qualitatively and FFA for the type of fluid leakage, qualitative assessment
and quantitative measurement of retinal thickness correlates better with
retinal dysfunction in patients of CSME as shown by numerous studies.OCT
allows the study of subclinical retinal changes that may not be detected by
FFA and slit lamp bio microscopy.
59
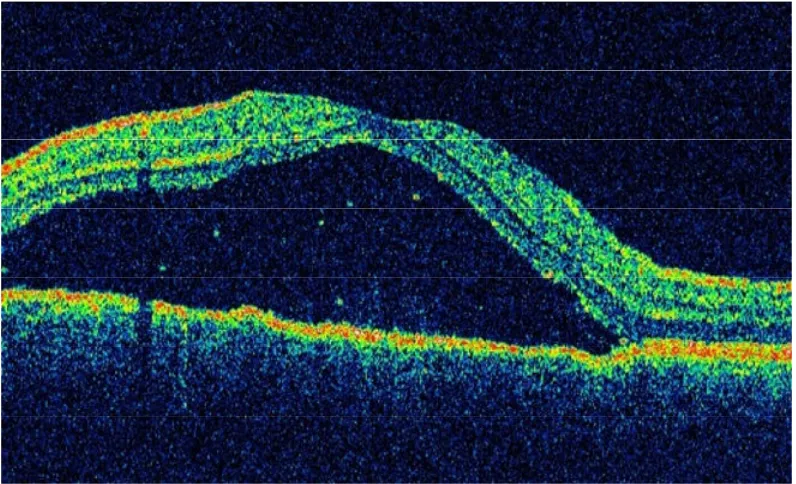
1) Sponge like retinal thickening
Appears as thickening of retina without definite cystic spaces. It is
mostly confined to outer retinal layers as the intraretinal fluid accumulation
caused backscattering. Hard exudates appear as areas of hyper-reflectivity
within the retinal layers with backscattering.
2) Cystoid macular edema
OCT imaging reveals the presence of several hypo-reflective cystoid
spaces with intervening septa located mainly in the outer retina. Size of the
cysts may vary. In long standing cases large cysts are formed due to fusion
of multiple smaller cysts.
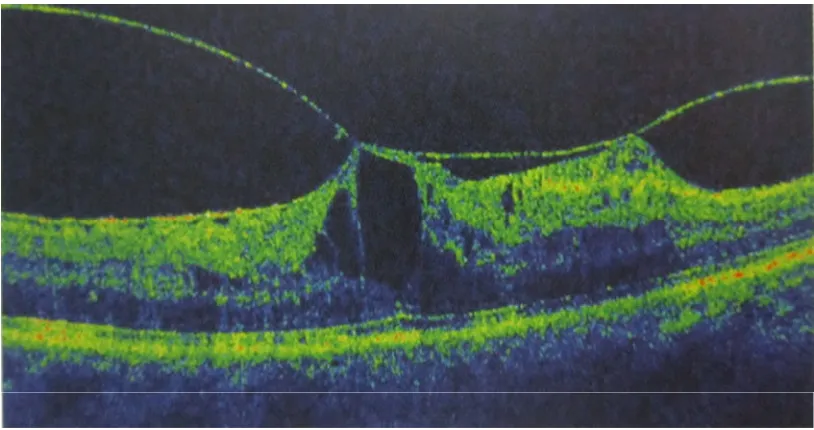
3) Serous retinal detachment
Horizontal scan through fovea in these cases show an area of hypo
reflectivity in sub retinal layers corresponding to areas of detachment due to
accumulation of fluid. These areas may disappear spontaneously following
laser.
4) Taut posterior hyaloids
OCT imaging in these cases shows the presence of taut posterior
hyaloid as a hyper reflective membrane. Bio microscopic examination may
reveal taut, shiny, glistening membrane associated with retinal striae. It may
60
5) Vitreomacular traction
This can result in detachment of the fovea. Laser can worsen the macular
edema in such eyes and are subjects for vitrectomy to release the traction.
Both VMT and Taut posterior hyaloid may be causes of recalcitrant
macular edema with foveal detachment. Both of these conditions can be
diagnosed easily on OCT, even when they are subclinical. Pars plana
61
Fig 10 SPONGY PATTERN OF CSME
[image:61.612.115.536.425.629.2]62
Fig12 SEROUS RETINAL DETACHMENT
[image:62.612.113.526.426.635.2]63
64
BREIF OVERVIEW OF MANAGEMENT OF CSME
PREVENTION AND CONTROL
Incidence and progression of DR can be reduced by having optical
metabolic control as shown by the Diabetes Control and Complication
Trial(DCCT) and the united kingdom prospective diabetes study(UKPDS)32.
A reduction of macular edema was noticed even before laser therapy by
strict control of risk factors like HbA1c, blood pressure, anemia, lipid
profile and proteinuria. Suggested Cut off value for blood pressure, LDL
cholesterol and HbA1c are <130/80, <100mg/dl and <7% respectively.
LASER TREATMENT FOR CSME
The ETDRS study demonstrated that laser treatment reduced the risk
of moderate visual loss (loss of 3 or more lines in snellens equivalent / 15 or
more letters on ETDRS chart) and improved the chances of visual
improvement in patients with CSME.
TREATABLE LESIONS
1. Focal leaks situated more than 500 microns away from the centre of
macula causing hard exudates or retinal thickening.
2. Focal leaks situated within 300- 500 microns from centre of macula
causing hard exudates or retinal thickening.
65
4. Capillary avascular areas other than foveal avascular zone not treated
previously.
Modified ETDRS Focal/Grid laser photocoagulation of CSME.
1. Do not treat lesions situated closer than 500 microns from the fovea
2. Avoid intense and excessively dense laser burns
3. Do not treat intra or pre retinal hemorrhages.
4. Large microanuerysms that appear the main cause of leakage must be
treated focally to the ETDRS end point of colour change( either
whitening or darkening).
TECHNIQUE OF FOCAL LASER
All the leaking microanuerysms are treated directly using a spot size
of 50-100microns for duration of 0.1 sec.
TECHNIQUE OF GRID LASER
Areas of diffuse leakage without any identifiable focal areas of
leakage are treated . Spot size used is 50-100 microns and a grid pattern of
light intensity equally spaced burns is produced. 2 burns are placed at a
66
LASER TYPES USED
Most commonly used wavelength is 514 nm and 810 nm infrared
diode laser.
MEDICAL MANAGEMENT OF CSME
a. Intravitreal Steroids
Steroids are beneficial in treatment due to their anti-inflammatory
properties. Intravitreal steroids have been used in patients who had
refractory CSME. Intravitreal triamcinolone 4mg/0.1ml alone or
combination with laser has been studied in various therapeutic
investigations. Side effects include cataract, iop raise, endophthalmitis and
retinal detachment33.
b. Intravitreal Anti Vascular Endothelial Growth Factors (VEGF)
VEGF34 has inflammatory properties and is found to play a role in
pathogenesis of DME by increasing capillary permeability. Anti VEGF
agents help in restoring the normal permeability of blood retinal barrier.
Bevacizumab , recombinant, humanized , monoclonal antibody against
VEGF has been used in diffuse type of macular edema where other
treatment have failed.
Dosage used is 1.25mg/0.05ml. However it has transient effect and
67
Pegatinib sodium ( Macugen) 1.3mg/0.05ml 3 injections are given at
an interval of 6 weeks and followed for 36 weeks. Its specifically neutralises
VEGF165.
Ranibizumab is humanized, recombinant monoclonal antibody
fragment. Injected intravitreally it inhibits all forms of VEGF.
OTHER PHARMACOLOGICAL AGENTS UNDER STUDY
1. Aldose reductase inhibitors- Sorbinil, Ponalrestat,Tolrestat act by
inhibiting aldose reductase enzyme responsible for conversion of
glucose to Sorbitol. These agents help in slowing development of DR.
2. Protein kinase inhibitors – Ruboxistaurin acts by inhibiting protein
kinase c beta which plays a role in pathogenesis of CSME.
3. Advanced glycation end products inhibitors and antioxidants
SURGICAL MANAGEMENT OF CSME
CSME with evidence of taut posterior hyaloid or posterior hyaloidal
traction are benefited by performing parsplana vitrectomy and detachment
of posterior hyaloid. CSME not responding to laser may be benefited by
68
AIM OF THE STUDY
PRIMARY OBJECTIVE
To analyze the patterns of structural changes in clinically significant
diabetic macular edema in patients with diabetic retinopathy by optical
coherence tomography.
SECONDARY OBJECTIVE
1. To quantitatively asses the central foveal retinal thickness by optical
coherence tomography in patients with clinically significant diabetic
macular edema.
2. To study the profile of diabetic patients with clinically significant
69
MATERIALS AND METHODS
METHODOLOGY
1. Diabetic patients with recently detected clinically significant macular
edema by fundoscopic examination are included in the study
2. These patients are subjected to optical coherence tomography
3. Patterns of macular edema and retinal thickness is studied
INCLUSION CRITERIA
All the patients with clinically significant macular edema which was defined
if one or more of the following criteria were met (ETDRS criteria)
1. Retinal thickening within 500 microns of centre of macula
2. Exudates within 500 microns of centre of the macula if associated
with retinal thickening
3. Retinal thickening of one disc diameter any part of which is within
one disc diameter of centre of the macula
EXCLUSION CRITERIA
1. Patients with macular edema due to any other cause
2. Patients with diabetic retinopathy who had undergone any form of
treatment – Grid /PRP
70
4. Patients with associated hypertension
5. Patients with media opacities
EXAMINATION
A brief history about the type, duration of diabetes, associated
hypertension, renal problems, past history of any treatment was taken. IOP
was measured using applanation tonometry, RBS, Urine albumin and sugar
were estimated, Visual acuity was assessed using the Snellen’s chart.
Anterior segment examination was done with slit lamp biomicroscopy.
Posterior segment evaluation was done with 90D/78 D lens with slit lamp
bio microscopy and binocular indirect ophthalmoscope. Fundus fluorescein
71
OBSERVATION AND ANALYSIS
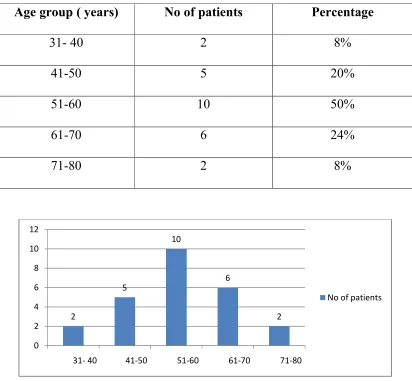
[image:71.612.111.523.162.543.2]1. AGE DISTRIBUTION
Table 1
Age group ( years) No of patients Percentage
31- 40 2 8%
41-50 5 20%
51-60 10 50%
61-70 6 24%
71-80 2 8%
As seen above in our study 20% of the patients were in 41-50 years
age group, 40% in 51-60 years age group, and 24% in 61-70 years age
group. Middle aged population i.e between 41- 60 years had highest
prevalence of the DR which correlates with the WESDR.
2
5
10
6
2
0 2 4 6 8 10 12
31- 40 41-50 51-60 61-70 71-80
72
15 10
Males
Females
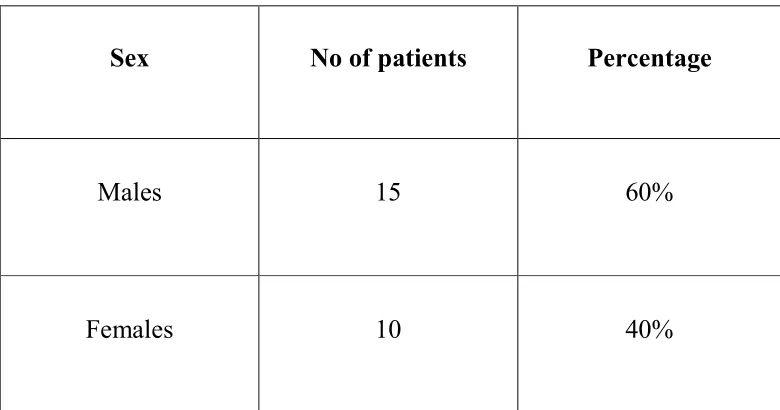
[image:72.612.121.511.113.318.2]2. SEX DISTRIBUTION
Table 2
Sex No of patients Percentage
Males 15 60%
Females 10 40%
Males were the predominant sex affected in our study i.e 60 %. This
observation correlates with that of Wisconsin Epidemiological study of
73
7
13
5
0 2 4 6 8 10 12 14
<5 years 5-10 years 10-20 years
No of patients with DME
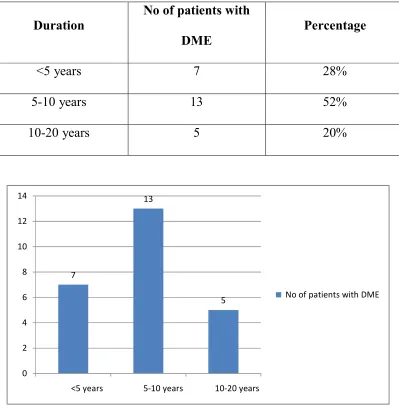
[image:73.612.119.518.114.523.2]3. DURATION OF DIABETES
Table 3
Duration
No of patients with
DME
Percentage
<5 years 7 28%
5-10 years 13 52%
10-20 years 5 20%
1. In our study the incidence Of DME with duration of <5 years was 28%
2. Incidence of DME in patients with duration of 5 – 10 years was 52%
5
[image:74.612.125.510.116.606.2]4. TYPE OF DIABETES
Table 4
Type
Type 1 ( insulin
dependent)
Type 2 ( on oral HGA )
Type 2 ( on insulin )
In our study 8% of patients were type 1
were type 2 diabetics who were on oral hypoglycaemic agents and 20 %
were type 2 diabetics on insulin therapy
2
18
Type 1 ( insulin dependent)
Type 2 ( on oral HGA )
Type 2 ( on insulin )
YPE OF DIABETES
No of patients Percentage
Type 1 ( insulin
2 8%
Type 2 ( on oral HGA ) 18 72%
Type 2 ( on insulin ) 5 20%
In our study 8% of patients were type 1 diabetics, 72% of patients
were type 2 diabetics who were on oral hypoglycaemic agents and 20 %
were type 2 diabetics on insulin therapy.
Type 1 ( insulin dependent)
Type 2 ( on oral HGA )
Type 2 ( on insulin )
Percentage
72% of patients
75
[image:75.612.109.525.113.568.2]5. TYPE OF DIABETIC RETINOPATHY
Table 5
Type of DR with
CSME
No of eyes Percentage
Mild NPDR 10 20%
Moderate NPDR 20 40%
Severe NPDR 18 36%
PDR 4 8%
In our study 20% of the eyes had mild NPDR, 40% moderate NPDR,
36% had severe NPDR and 8% had PDR
0 5 10 15 20 25
Mild NPDR Moderate NPDR Severe NPDR PDR
76
[image:76.612.202.431.113.272.2]6. VISUAL ACUITY
Table 6
Visual acuity No of eyes
<2/60 2
4/60 – 6/60 6
6/36- 6/18 30
< 6/12 12
30 eyes in our study had a visual acuity ranging from 6/36-6/18 and
12 eyes had VA of < 6/12. 12 eyes had visual acuity of < 2/60
0 5 10 15 20 25 30 35