process matters
.
White Rose Research Online URL for this paper:
http://eprints.whiterose.ac.uk/1603/
Article:
Holden, J. (2005) Peatland hydrology and carbon release: why small-scale process
matters. Philosophical Transactions of the Royal Society A: Mathematical, Physical and
Engineering Sciences, 363 (1837). pp. 2891-2913. ISSN 1471-2962
https://doi.org/10.1098/rsta.2005.1671
[email protected] https://eprints.whiterose.ac.uk/ Reuse
See Attached
Takedown
If you consider content in White Rose Research Online to be in breach of UK law, please notify us by
Peatland hydrology and carbon release: why
small-scale process matters
BY JOSEPH HOLDEN
Earth and Biosphere Institute, School of Geography, University of Leeds, Leeds LS2 9JT, UK
Peatlands cover over 400 million hectares of the Earth’s surface and store between one-third and one-half of the world’s soil carbon pool. The long-term ability of peatlands to absorb carbon dioxide from the atmosphere means that they play a major role in moderating global climate. Peatlands can also either attenuate or accentuate flooding. Changing climate or management can alter peatland hydrological processes and pathways for water movement across and below the peat surface. It is the movement of water in peats that drives carbon storage and flux. These small-scale processes can have global impacts through exacerbated terrestrial carbon release. This paper will describe advances in understanding environmental processes operating in peatlands. Recent (and future) advances in high-resolution topographic data collection and hydrological modelling provide an insight into the spatial impacts of land management and climate change in peatlands. Nevertheless, there are still some major challenges for future research. These include the problem that impacts of disturbance in peat can be irreversible, at least on human time-scales. This has implications for the perceived success and understanding of peatland restoration strategies. In some circumstances, peatland restoration may lead to exacerbated carbon loss. This will also be important if we decide to start to create peatlands in order to counter the threat from enhanced atmospheric carbon.
Keywords: wetlands; peat; hydrology; carbon; land management; climate change
1. Introduction
A 10 h walk into the Flow Country of northern Scotland takes us into the heart of the largest intact expanse of blanket bog in the world. We stand on top of 8 m of waterlogged peat deposit and try to avoid falling into the bog pools or the hidden ankle-twisting cavities that are located throughout the peatland. Here, we install probes to measure the water table, monitor dissolved organic carbon (DOC), which turns the river water brown, and measure the peat particles that are being washed downstream. We then turn to measuring the gas fluxes and install floating chambers on the river to measure stream degassing of CO2 and methane (CH4) and gas towers on the bog surface to measure gas inputs and outputs from the peat. We are trying to produce a carbon budget for the
Published online24 October 2005
peatland in order to find out whether the peatland stores more carbon than it releases. We also measure water and carbon movement through the peat to help us understand the processes involved in producing the carbon budget. However, the measurements we collect are only from a few points within a vast system. If we place the probes on different points, only a few metres away, will we get vastly different results? We must also bear in mind that the Flow Country system (1440 km2) is only one peatland out of the world’s 4 million km2of peatland. How can our results be meaningful? This paper will attempt to illustrate how an understanding of small-scale processes in peatlands informs our understanding (and management) of water and carbon fluxes both at the catchment and at the global scales.
Peatlands are one of the most important ecosystems in the world. While they cover only about 3% of the land and freshwater surface, they contain around one-third of the carbon stored in the terrestrial biosphere and 10% of available freshwater resources. They also contain many unique species and support the livelihoods of communities around the world. Peatlands occur in more than 130 countries. While peat occurs mainly as a high-latitude deposit, at least one-fifth occurs in warmer climates, most notably in the tropics. Peat consists of partially decomposed remains of plants that are lain down in waterlogged conditions. The plants that form peatlands, such asSphagnumspecies, tend to form a litter that is more resistant to decay than ordinary plant litter. This combined with immersion by water reduces the rate of decay so that it is less than the rate of production, allowing carbon accumulation in the form of the peat itself. Thus, understanding the way in which vegetation, decay processes and hydrology interact is crucial for understanding peatland development and carbon accumulation. Disturbance of just one of these factors can lead to the degradation of the peatland. Peatlands are unbalanced systems, which under the right climatic conditions, or conditions of poor drainage, will grow over time. However, the accumulation of peat can be slow and it may take many millennia to form just a 2 m layer of peat. The rate of accumulation depends upon a range of environmental conditions (up to 20 m of peat has formed in some places during the past 10 000 years). The long-term ability of peatlands to sequester carbon (12–23 g C mK2
yrK1
;Turunenet al. 2001) means that they play a major role in moderating atmospheric CO2 concentrations. It can be estimated that over the past 10 000 years the atmospheric carbon stored in peats has served to reduce global temperatures by about 1.5–28C. However, drainage, extraction and fires, combined with climate change, are converting more peatlands into sources of carbon rather than stores. Despite the importance of peatlands they are barely mentioned in standard texts on global warming or emissions scenarios.
inadvertent, such as climate change or chemical deposition in precipitation, an understanding of the temporal and spatial variability of hydrological processes is required. This paper will therefore review recent developments in our under-standing of peat hydrology and its relationship to carbon fluxes. It will become clear that there are a range of feedback mechanisms that follow peatland disturbance, some of which are irreversible, creating major challenges for the future in terms of landscape restoration and global carbon sequestration.
2. Peatland hydrology
(a) Water balance and river flow
The traditional approach to peat hydrology is to budget inputs, stores and outputs of water. These components are described below. Inputs of water and nutrients to peatlands come from either precipitation or groundwater influx. Bogs are ombrotrophic peatlands dependent on precipitation for water and nutrient supply, whereas fens, or minerotrophic peatlands, are reliant on groundwater. Therefore, fens tend to be supplied with far more water, per unit area, than bogs and this difference is usually undervalued (Malmer 1962). Bogs are highly acidic (pH!4) and contain low amounts of calcium and magnesium, whereas minerotrophic peats are less acidic and tend to be base rich. In areas of tropical and temperate climate, it is usual for peatlands to receive inputs of water from more than one source (precipitation, including fog, which in some areas can be a major input (Price 1992a), and groundwater flow). In contrast, in arid areas away from coasts, rivers and lake systems, groundwater is the only significant water component, such as in the South Park fens of Colorado.
spare storage capacity for an influx of fresh rainwater. Therefore, many peats tend to be source areas for flooding.
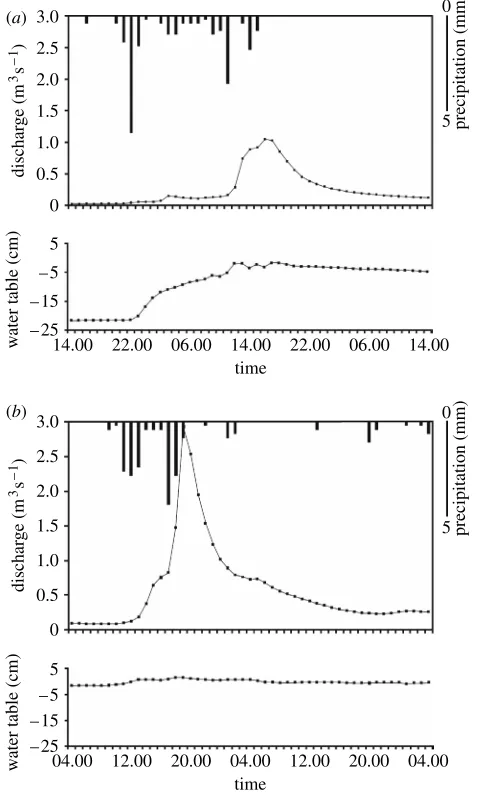
Some peatlands do contribute to baseflow, but these tend to be ones that are connected to a much wider hydrological system (e.g. Roulet 1990), where the peatland itself has little effect on the magnitude of the flux. Instead, the water flow out of the peatland is often controlled by groundwater discharge into the peatland. In certain topographic locations, some peatlands will influence regional flow regimes by intercepting catchment runoff and storing some of the storm waters. The impact of this would be to reduce peak flows. However, this will depend on the size and location of the peatland relative to the drainage network (Heathwaite 1995) and the time of year (Ogawa & Male 1986). In spring there may be a lower capacity to store water than in summer. Figure 2a illustrates the effect of water table recharge on runoff production after a dry summer spell. Rainfall greater than 5 mm hK1
produces minimal hydrograph response while the water table is (relatively) deep below the surface (24 cm). Later in the storm, just less than 4 mm hK1
of rainfall is sufficient to trigger a rapid and greater hydrograph rise by which time the water table had risen to within 5 cm of the surface. A second storm is shown infigure 2bwhere the water table was at the surface before the storm started and therefore there is a much bigger flood peak. Streamflow is dominated by runoff associated with peatland saturation (Holden & Burt 2003a,c). During the winter months, peatlands contribute to a higher flood peak, as they will be fully saturated. Only where a peatland lies between groundwater sources and the river can it exert some ameliorating influence on downstream hydrology (Burt 1995). Peatlands with permafrost, beaver pools and forests may behave in a more lagged way than other peats (e.g.Woo & Young 1998).
(b) The acrotelm–catotelm model
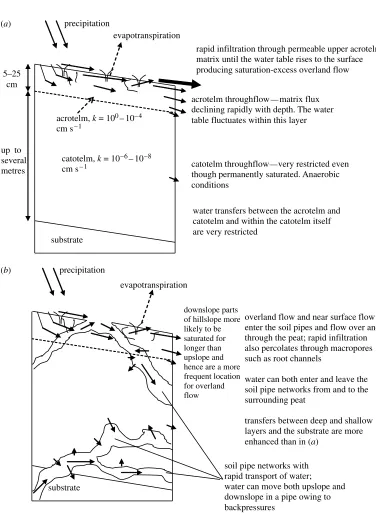
Since the mid-twentieth century Russian scientists have adopted a two-layered system to understand how peatlands function (figure 3a). This comprises an upper active ‘acrotelm’ peat layer with a high hydraulic conductivity (rate of water movement through the peat) and fluctuating water table and a more inert
20
16
12
8
4
0
Oct Dec Feb Apr Jun Aug Oct
dischar
ge, m
3s
[image:5.493.128.357.61.183.2]–1
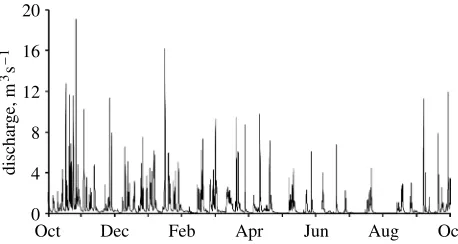
Figure 1. Discharge for the 1999 water year from the 11.4 km2Trout Beck blanket peat catchment,
lower ‘catotelm’ layer, which corresponds to the permanently saturated main body of peat (e.g. Ivanov 1948). Ingram (1983) noted that the distinction between the acrotelm and catotelm is an important concept and fundamental to any understanding of the hydrology, ecology and pedology of peatlands. This layering system became widely accepted around the world in the late 1970s and early 1980s (e.g. Clymo 1983) and is now used regularly in ecohydrological and peat-development modelling and budgeting (e.g.Kirkbyet al. 1995;Hilbertet al. 2000;Holden & Burt 2003b,c). The acrotelm–catotelm model implies that most runoff production and nutrient transfer will occur within the upper peat layer,
3.0 (a)
(b) 2.5
2.0
1.5
1.0
0.5
0
14.00 22.00 06.00 14.00 22.00 06.00 14.00 time
04.00 12.00 20.00 04.00 12.00 20.00 04.00 time
3.0
2.5
2.0
1.5
1.0
0.5
0
dischar
ge (m
3s
–1
)
dischar
ge (m
3s
–1
)
w
ater table (cm)
5
– 5
– 15
– 25
w
ater table (cm)
5 – 5 – 15 – 25
0
5 preci
p
itation (mm)
0
5 preci
p
[image:6.493.133.372.64.464.2]itation (mm)
close to or at the peat surface. The dominance of traditional water balance approaches in peatland environments and recent reliance on the acrotelm– catotelm model in ecohydrological and runoff modelling have meant that many hydrological processes occurring in peatlands remain poorly understood.
evapotranspiration
substrate
soil pipe networks with rapid transport of water; water can move both upslope and downslope in a pipe owing to backpressures
precipitation
overland flow and near surface flow enter the soil pipes and flow over and through the peat; rapid infiltration also percolates through macropores such as root channels
water can both enter and leave the soil pipe networks from and to the surrounding peat
transfers between deep and shallow layers and the substrate are more enhanced than in (a)
downslope parts of hillslope more likely to be saturated for longer than upslope and hence are a more frequent location for overland flow
up to several metres 5–25
cm
precipitation
evapotranspiration
catotelm,k = 10–6– 10–8 cm s– 1
acrotelm,k = 100– 10– 4
cm s– 1
[image:7.493.51.427.43.561.2]acrotelm throughflow—matrix flux declining rapidly with depth. The water table fluctuates within this layer
catotelm throughflow—very restricted even though permanently saturated. Anaerobic conditions
substrate
rapid infiltration through permeable upper acrotelm matrix until the water table rises to the surface producing saturation-excess overland flow
water transfers between the acrotelm and catotelm and within the catotelm itself are very restricted
(a)
(b)
Figure 3b presents a revised hydroecological model of peatlands. This incorporates bypassing flow and additionally considers hillslope position to be important in determining the spatial and temporal production of runoff. The following section challenges the use of the traditional acrotelm–catotelm model by focusing on recent process-based research in peatlands.
(c) Hydrological processes in peatlands
Streamflow is the end product of a range of runoff production processes. It is important to understand these hydrological processes because they control the speed of water movement and the nature of nutrient and sediment fluxes. The runoff processes range from overland flow to subsurface flow within the matrix (tiny pores between solid particles), within macropores and through natural pipes. The relative importance of the flow processes in any catchment varies with climate, topography, soil character, vegetation cover and land use and may vary at one location (e.g. seasonally) with antecedent moisture and with precipitation intensity and duration. Infiltration-excess overland flow is produced when the rainfall intensity is greater than the infiltration rate, and the overland flow therefore consists of water that has not been within the soil. Saturation-excess overland flow can occur at much lower rainfall intensities and is produced when the soil profile is completely saturated; the water at the surface is a mixture of water that has been within the soil mass that is returning to the surface from upslope and fresh rainwater.
[image:8.493.61.436.118.191.2]Many peatlands appear to be dominated by saturation-excess overland flow or throughflow in the upper peat layers.Table 1provides data from an undisturbed blanket peatland hillslope in Upper Wharfedale, UK. Most runoff (74%) measured from runoff troughs was produced from the surface of the peat and most of the rest from the upper 20 cm of the peat profile. However, such measurements rarely include components of flow through macropores and soil pipes and so, while peats may appear to be surface-flow dominated, the lack of other measurements may mask the full range of processes. While field mapping and rainfall simulation experiments on peats have confirmed the dominance of saturation-excess overland flow on both vegetated and bare peat surfaces (Holden & Burt 2002a), they have also demonstrated the spatial and temporal variability of the processes. For example,figure 4is a map of runoff across a peat hillslope during and after a rainfall event. Overland flow was recorded over almost the entire hillslope at the peak of the storm at 03.00, day 239 (figure 4a), Table 1. Percentage of runoff collected in automated runoff troughs from peat layers in Upper
Wharfedale, December 2002–December 2004
(Note that these data are based on runoff troughs that have not sampled subsurface pipeflow and instead illustrate soil matrix contributions to runoff.)
peat layer (depth, cm) percentage runoff from hillslope
0–1 74
1–8 21
8–20 5
but as the hillslope drains after the rainfall has stopped the source area for overland flow is reduced and varies depending on the topography. The steeper midslope sections of the slope produce overland flow less frequently (with concomitant increases in subsurface flow) than shallower hilltops and hilltoes. This fact is often neglected in the oversimplified acrotelm–catotelm model.
The acrotelm–catotelm model ignores the important role of turbulent flow in macropores (here defined as pores greater than 1 mm in diameter) and pipes (greater than 10 mm in diameter). Research has indicated that macropores can be important in solute transport through soils (e.g. Beven & Germann 1982). Macropore flow has been shown to develop in peats that have been cut and air-dried to supply Irish power stations (Holden 1998), but until recently little work had been done on macropore flow in intact peats.Baird (1997)andHoldenet al. (2001)have shown that over 30% of runoff in peats moves through macropores, which results in water and nutrients being transferred between deep and shallow layers of the peat profile. Soil pipes (figure 5) can be several metres in diameter and
100
100
100
100
100 100
100 100
98
98 98
98
98 98
98 98
102
102 102
102 102
102 102
102 102
102
100
100
100
100
minimum depth of flow distance, m
OLF 3 cm 6 cm 9 cm
0 10 20 30 40 50
(a) (b)
[image:9.493.52.436.56.411.2](c) (d)
Figure 4. Minimum depth of flow from a peat hillslope, Julian day 239–240 1999 as monitored by crest-stage tubes; (a) 03.00 day 239, (b) 09.00 day 239, (c) 21.00 day 239, (d) 09.00 day 240 (after
are present in both continental and oceanic peatlands including patterned and aapa mires. For example, they have been reported in the peatlands of Scandanavia, New Zealand, Tasmania, Indonesia, Canada, Siberia, Ireland and the UK (Jones 1981;Price 1992b;Market al. 1995;Norrstrom & Jacks 1996;Jones
[image:10.493.66.440.60.303.2]et al. 1997; Holden 2004, 2005). There have been few detailed surveys of pipe density or pipe contribution to runoff production in peat catchments but, where limited measurements have been done (e.g. in Arctic peatlands or peaty podzols), pipe drainage was found to be important (Joneset al. 1997; Quinton & Marsh 1998;Carey & Woo 1999; Price & Waddington 2000). The study by Holden & Burt (2002b)is the only detailed study of pipeflow in a peatland anywhere in the world and identified 10% of streamflow moving through the pipe network. It is likely that a much larger proportion of the dissolved and particulate organic carbon (POC) comes from the pipes, particularly as they are often coupled directly to the stream network. Again there is a dearth of data. Very little is understood about the role of pipes in peat hydrology, erosion or carbon cycling. Often sediment is deposited on the peat and vegetation surface where a pipe has overflowed during a storm event. This sediment can contain a large proportion of mineral material from the underlying substrate as pipe networks undulate throughout the soil profile. The existence of pipes and macropores therefore opens the way for water, sediment and nutrients to be transferred from deep within and below the peat rather than simply by rapid transfer through the acrotelm. This is important, particularly in ombrotrophic peats, because even if some pipe networks are actually ‘dead-ends’ and have little effect on water delivery to streams, they will still act to provide vertical coupling of sediments and solutes and provide additional subsurface connectivity across peatlands.
It is now possible, for the first time, to examine piping and macroporosity in peatlands systematically in order to determine what controls their location and frequency. Macropores can be measured through tension devices and dye staining, and recently it has been shown that pipes can be detected using ground-penetrating radar (GPR; Holden et al. 2002;Holden 2004). I performed a GPR survey of 160 peatlands in the UK and detected piping (when greater than 100 mm) in all catchments surveyed. Results showed that climate change and land management can dramatically increase piping (discussed in §4). A mean density of piping equivalent to 69 pipes per km of GPR transect was determined. Topographic position (but not slope angle) was found to be a significant control of both soil pipe frequency and macroporosity (p!0.001). Topslopes and toeslopes were found to have significantly higher densities of soil pipes and macropores than midslopes. Gully erosion (sometimes a product of pipe collapse) occurs in some peatlands and this appears to have the same topographic pattern. This suggests that there are links between small-scale subsurface erosion and water transfer processes (less than 1 mm matrix pores, 1–10 mm macropores, 100–3000 mm pipes) and hillslope-scale surface geomorphology and particulate carbon loss.
This leads us to question why such processes operate and why there are such strong topographic controls. Traditional theory would suggest that piping should be more severe on steeper slopes where there is a greater hydraulic gradient. An explanation may lie in the history (or ‘memory’) of peatlands. It has been found that the structure of the peat is much less uniform on top and footslopes than on midslopes (Holden 2005). I propose that the nature of the underlying topography (and its associated drainage conditions) promotes differential build-up of the peat deposits. This occurs because of the development of micropools and larger bog pool systems on hilltops and toes, which are colonized by a mosaic of plants with specialist positions within the microtopography. The remains of these plants are then incorporated into the peat as it thickens, resulting in a peat of variable properties throughout its profile. Better-drained midslopes have a more uniform structure and more (spatially and temporally) uniform runoff production with less overland flow and more subsurface flow. The associated midslope plant formations tend to be more homogeneous. Midslopes are, therefore, less susceptible to wandering and branching pipe networks. This homogeneity combined with gradient will allow macropore, pipe and gully branching to be at a minimum on midslopes. Further work is required to test the links between processes operating at different scales.
3. Peatland carbon processes
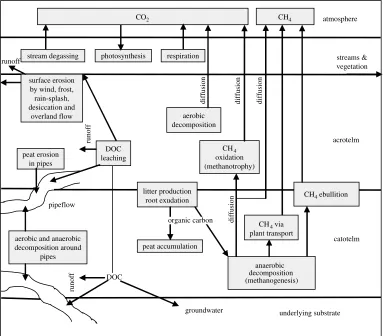
examine the release of CH4and CO2from the peat surface and the decomposition of peat into DOC, which is then released in runoff. From these relationships global estimates of current carbon emission from peatlands are produced. However, they do not account for surface or subsurface erosion and the uncertainties associated with peatland carbon fluxes are vast.Figure 6sketches a model of a peatland carbon cycle. Respiration and photosynthesis provide coupling with the atmosphere. Oxidation in the upper peat and anaerobic decomposition in the lower saturated peat produce CH4, which is released via diffusion, ebullition (bubbles released from saturated peat; Rosenberry et al. 2003) and plant transport via root tissues to the atmosphere. Gases may also be released via pipes to the atmosphere. Fluxes of CH4 may range from a minor uptake into the peat to emissions of 1000 mg mK2
dK1
(Klingeret al. 1994) with average emissions of 5–80 mg mK2
dK1
most common in northern peatlands (Blodau 2002). The largest emissions are often restricted to lawns and hollows on bogs. Fens tend to have even greater emissions, as the anaerobic zone is closer to the surface. Carbon dioxide production results from mineralization of soil organic carbon and plant respiration. Under normal peat temperature ranges, CO2
streams & vegetation acrotelm catotelm underlying substrate photosynthesis respiration anaerobic decomposition (methanogenesis)
CH4 ebullition
peat accumulation litter production
root exudation DOC
leaching
CH4 via
plant transport CH4 oxidation (methanotrophy) aerobic decomposition
CO2 CH4
diffusion diffusion DOC groundwater runoff runoff diffusion diffusion atmosphere
aerobic and anaerobic decomposition around pipes pipeflow peat erosion in pipes surface erosion
by wind, frost, rain-splash, desiccation and
overland flow runoff stream degassing
[image:12.493.60.443.61.397.2]organic carbon
production increases by threefold for every 108C increase, but this varies with depth and it is not clear what controls the temperature dependency of carbon mineralization rates (Blodau 2002).
Organic material is often leached as DOC, and the export from temperate and boreal peatlands ranges between 1 and 50 g DOC mK2
yrK1
(e.g. Dillon & Molot 1997), which typically represents around 10% of the carbon release. DOC is important in peatlands because any change in the flux of DOC will result in a significant regional redistribution of terrestrial carbon. In downstream ecosystems, DOC exerts significant control over productivity, biogeochemical cycles and attenuation of visible and UV radiation (Pastor et al. 2003). In addition, DOC affects water quality in terms of colour, taste, safety and aesthetic value as well as altering the acid–base and metal complexation characteristics of soil water and streamwater. DOC accumulates in peat pore waters and is flushed out by water movement, with concentrations often greatest following periods of warm, dry conditions when DOC has had time to accumulate. DOC concentrations are usually between 20 and 60 mg lK1
in northern peatlands (Blodau 2002), but concentrations are higher during low flow periods. Despite this the total flux of DOC exported is likely to be higher during storm flows, but many sampling programmes do not take this into account (Schiff et al. 1998). The controls on DOC production and export are poorly understood for peatlands, but include temperature, soil chemistry and microbial activity.
The idea that water movement exerts a strong control on carbon export is a crucial one. While much current research on carbon cycling focuses on the relationships among water table, temperature and carbon flux (e.g. McNeil & Waddington 2003), there is virtually no work that has examined the effect of water movement through peatlands on (i) retention and (ii) release of particulate, dissolved and gaseous forms of carbon. Recently, strong interest in water-borne carbon exports from peatlands has focused mainly on concentrations and fluxes of carbon, especially DOC, within the drainage system of peat-dominated catchments (e.g. Dawson et al. 2002;Billettet al. 2004). These have proved insightful studies and illustrate that processes such as degassing from streams are important. However, we still know little about what controls the transport of DOC and POC within peatlands themselves and the hydrological processes leading to their delivery to rivers. Most sampling programmes have ignored POC removal from peatlands, and comprehensive reviews of carbon cycling in peatlands such as that by Blodau (2002) often fail to mention particulate carbon loss and subsequent breakdown in the fluvial system. In some environments, POC removal by wind erosion is important or large peat blocks may erode downstream during stream bank collapse events, but neither of these is detected by most carbon sampling strategies (Evans & Warburton 2001; Warburton 2003). Estimates of POC loss from northern peatlands range from 2 to 40 g mK2
yrK1
complex than first thought. Therefore, predictions of carbon flux based on future scenarios of temperature or precipitation change alone may be insufficient.
4. Impacts of environmental change on peat hydrology and carbon processes
Large-scale changes to peatlands in the form of human-induced fires, such as the 1997–1998 burning events in Borneo (which released around 1000 million tonnes of carbon into the atmosphere), and peat extraction for fuel and horticulture have a direct and straightforward impact on the carbon and hydrological cycles. The peatland is lost, unable to sequester further carbon and the majority of the former carbon store is suddenly released into the atmosphere. However, other environmental changes such as climate change, land drainage or afforestation of peatlands may affect hydrology and carbon release.
Peatland drainage, for example, has been reported to both increase and decrease flood peaks, but most studies have simply measured inputs and outputs of water, which cannot explain why there are differences in response between different catchments. However, paying attention to the hydrological processes is illuminating. Two main changes to hillslope hydrological process are likely to result from artificial drainage of peat. The first is that there is an increased water storage capacity within the soil, reducing peak flows and increasing stream lag times. The second major change to hillslope hydrology is that the ditches now provide channels for fast-moving water to reach the stream increasing peak flows. However, the first process may also lead to increases in the river flood peak at the catchment scale as demonstrated in figure 7. While the flood peak from this drained hillslope is lower than it was before drainage, its timing now corresponds to when the main river channel has its flood peak. Therefore, there will be an increase in the overall river flood peak in the catchment because water delivery to the stream channel is now synchronous. This suggests that where land management change takes place in a catchment is very important. A manage-ment change in one part of a peatland can have a very different impact on peatland hydrology from a similar change in another part of the peatland depending on its location (Lane et al. 2003). It also shows how small-scale local changes can have larger-scale impacts.
table lowering. For example, oxygen enhances the mineralization of nutrients, particularly the carbon-bound nitrogen and sulphur and the organically bound phosphorus. However, there is not space here to discuss peat chemistry, and readers are referred to Clymo (1983) and Holdenet al. (2004)for more detail.
The structural and chemical changes to peats following environmental change provide an interesting problem. If we try to restore peatlands it may lead to even more water travelling to the stream via newly created macropores and soil pipes (e.g. from the walls of blocked ditches). Subsurface pipe erosion and the development of even more soil pipes might ensue. With this will come a change in carbon cycling with increased subsurface particulate and DOC release. There may be implications for flooding, water quality and carbon emissions. Changes to
rainfall
30 min
60 min
before drainage of subcatchment
[image:15.493.60.429.61.458.2]after drainage of subcatchment
soil processes brought about by land management may not be simply reversible just by reverting back to the original land use. This is an example where appreciation of small-scale processes is required if we are to understand the impacts of large-scale management on catchment and global-scale processes.
One of the key research questions we face is how will peatlands react to global climatic warming: will they become a carbon source or will they stay a carbon sink or even become a bigger carbon sink? Predictions of the effect of changing temperature regime on evapotranspiration and peat water tables combined with the effect of changing precipitation regimes on water tables are common (e.g. Silvola et al. 1996). Peats isolate carbon from atmospheric CO2 through plant photosynthesis. They do, however, convert some of this carbon into CH4, which is much more potent as a greenhouse gas than CO2. If the water table is lowered, the carbon sink–source relationship is likely to be disturbed because a greater percentage of the peat is available for oxidation in biochemical reactions. In addition, the rate of peat decomposition will increase with lowered water tables, and effectively more CO2and DOC will be available for release. Because peatlands are highly concentrated carbon stores, if just 2 mm of peat were oxidized annually (owing to a lower mean water table), then this would yield up to 1.6 billion tonnes of CO2, which is equivalent to 8% of current fossil fuel release. However, as a potential counterbalance, reduced water tables would result in a reduction in the concentration of CH4 released, because the increase in aerobic conditions will suppress the activity of the anaerobic methanogenic bacteria. This process may depend on where, in a global context, the peatland is located. As with peat drainage and the flooding question, an environmental change in one location may have a very different impact from that of the same change in another location. In contrast to peatlands of temperate zones, peatlands of boreal and subarctic regions have many more pools and have permafrost (palsa and plateau). With global warming these peatland types are expected to release more CH4, because methanogenic bacteria will be favoured by the melting of the permafrost. Indeed, recent research has shown that the frozen peatlands of a large area (1 million km2) of western Siberia are undergoing an unprecedented thaw owing to a mean temperature rise of 38C over the past 40 years, which could dramatically increase the rate of greenhouse gas emissions. These Siberian peats potentially hold 70 billion tonnes of CH4, a quarter of all CH4stored around the world. These thawed Siberian peats have also been shown to release substantially more DOC in rivers than where the permafrost remains intact (Frey & Smith 2005).
formed peat. Hence, surface structure can determine the peatland response to hydrological change (Belyea & Malmer 2004). However, the complexity of response to climate change in modelled simulations cautions against using past rates to estimate current or to predict future rates of carbon sequestration. Furthermore, while statistical models of peatland gas emissions may be locally acceptable, the variation between peatlands and regions is so great that the models are weak when they are lumped together (Blodau 2002). The fluxes of DOC, POC and gaseous carbon associated with water movement require further research, and the incorporation of such detail including the role of pipes, atmospheric deposition of nutrients and enhanced CO2 fertilization into models of the peatland carbon cycle provides a major challenge for the future.
5. Looking to the future: peatland restoration; field and modelling approaches
Despite continued peatland drainage for afforestation, extraction and agriculture there is now a public and policy-maker realization that degradation of an important terrestrial store and associated ecosystem destruction are not desirable. There is, therefore, a drive to protect undisturbed sites from disturbance and to restore damaged sites. In some places there are schemes to create new peatlands, despite the long time it takes for peat formation. A significant amount of restoration work is underway, but much of this is carried out on a pragmatic or even an ad hoc basis. This reflects the urgency of the requirement to protect important sites and the frequent shortfalls in available funding. It has therefore been difficult to sustain scientific assessments for a sufficient time period in order to evaluate success or to disentangle the precise effects of particular interventions.
(a) Water table recovery and vegetation recolonization
Water table recovery in peatlands can be relatively rapid (Priceet al. 2003). However, that is not to say that vegetation or hydrochemical recovery will follow. Bragg & Tallis (2001) emphasized that peatland biodiversity is highly vulnerable. Changes to peat pH and nutrient status as a result of environmental change can also make ecological restoration difficult.Price (1997)suggested that, in addition to blocking ditches to recreate a water table regime comparable to that in a natural area, more aggressive management techniques such as creating open reservoirs and using straw mulch (which increased soil moisture by 10–15%) may be required. It may often be necessary to seed vegetation on the surface of a damaged bog in addition to hydrological restoration and protection of existing vegetation.Sphagnumdiaspores, for example, can be spread across the surface of the bog. These may need additional protection by mulching to enable establishment (Priceet al. 1998;Rochefort et al. 2003).
(b) Modelling approaches
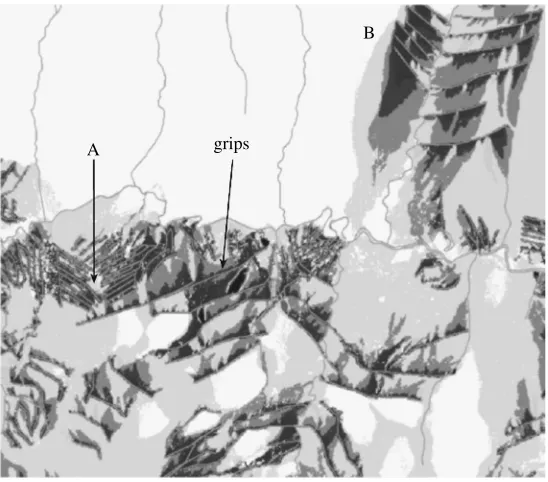
High-resolution topographic data can be collected using light detection and ranging to create a digital elevation model that has a precision of 12 cm in the elevations (Laneet al. 2004). It is important to use such high-resolution data in peatland environments, because very small differences in topography can be important for flow routing, saturation and ecology. From these data the topographic index of 2!2 m grid cells was calculated for several peatlands. The topographic index ln(A/tanb) is a measure of the upslope area (A) draining to a given point per unit contour length divided by the slope angle (tanb). The drains were mapped in the field and added to the digital elevation model using a geographical information system. The topographic index was then recalculated after the drains were added into the topography.
This approach enables upscaling from hillslope to regional scale and incorporation of POC, DOC and gaseous carbon fluxes into predictions. Such integration is challenging and deals with the spatial and temporal variability that the simple acrotelm–catotelm model ignores. However, the reliance on surface topographical data is still at odds with the need to incorporate subsurface bypassing flow into peatland models. This detail will be necessary if we are to manage peatland restoration properly and predict global carbon budget response in peatlands adequately, and so the models and approaches need further refinement. However, these developments are not far off and provide a useful focus for further research development.
(c) Thresholds of recovery and non-reversible trajectories
Most ideas about peatland restoration are based on the idea of returning a peatland to the functioning of an undisturbed site. The interrelationships of hydrological conditions in an undisturbed peatland and those within a disturbed peatland, however, may exhibit significant differences. This includes enhanced preferential flow through desiccation cracks and pipes. Further research is required to examine whether restoration strategies are able to cope with enhanced piping and to ensure that piping is adequately taken into account when developing peat management plans. It may be that restoration causes exacerbated subsurface carbon loss via piping. It is also unknown to what extent the chemical changes to peats and peat pore waters affect vegetation and water quality in the short or long term following peatland rewetting.
A
B
[image:19.493.106.380.59.300.2]grips
Figure 8. A map of the change in propensity to saturation for a 2!2 km area of the Upper
Wharfedale study catchment. The scale is set from no change (white) to a reduction in propensity to saturate (dark grey) when drains are added. Labels A and B refer to discussion in the text (after
An important example includes the potential for enhanced release of DOC as a result of peatland rewetting. Peatlands tend to have a better chance of recovery if there is a suitable depth of peat leftin situ, particularly if that peat is supplied with water and nutrients only by precipitation. Once the peat starts to regenerate it will eventually become self-sustaining and artificial water tables will no longer be needed, but a sufficient hydrological integrity of the peatland complex is necessary. Those peatlands that are at their climatic margins will be more sensitive to perturbation and will be less likely to recover. It may be possible to create new peatlands, by bunding up landscape areas, but it takes such a long time for peat to form that a long-term view of environmental sustainability is required, which is normally beyond the scope of most funding models.
When considering peatland restoration we must ask the question ‘restoration to what?’ The climate today is different from that when many peatlands began to form in the early Holocene. In some places it was human interaction (deforestation and grazing) combined with climate that triggered peatland development. Therefore, a peatland restored in today’s climate may well develop on an entirely different trajectory from that of peatlands a few thousand years ago. When ‘restoring’ peatlands do we simply want to maintain ‘current ecological functions’ (Charman 2002) or do we want to allow peatland ecosystems and their hydrochemistries to develop in new directions? The latter may not be avoidable. Judging the success of peatland restoration and management must then depend on our perception of peatland functions and our understanding of the links between small-scale and large-scale spatial and temporal processes.
This paper was written while J.H. was supported by a NERC Research Fellowship (NER/I/S/2001/00712). Work reported in this paper was also supported by a grant from NERC (NER/D/S/2000/01269) in collaboration with S. Lane, University of Durham, A. McDonald and M. Kirkby, University of Leeds, and C. Brookes, Victoria University of Wellington, and a grant from the RGS-IBG awarded to J.H.
References
Baird, A. J. 1997 Continuity in hydrological systems. InContemporary hydrology: towards holistic environmental science(ed. R. Wilby), pp. 25–58. Chichester: Wiley.
Bay, R. R. 1969 Runoff from small peatland watersheds.J. Hydrol.9, 90–102. ( doi:10.1016/0022-1694(69)90016-X.)
Belyea, L. R. & Malmer, N. 2004 Carbon sequestration in peatland: patterns and mechanisms of response to climate change.Global Change Biol.19, 1043–1052.
Beven, K. J. & Germann, P. 1982 Macropores and water flow in soils. Water Resour. Res. 18, 1311–1325.
Billett, M. F., Palmer, S. M., Hope, D., Deacon, C., Storeton-West, R., Hargreaves, K. J., Flechard, C. & Fowler, D. 2004 Linking land–atmosphere–stream carbon fluxes. Global Biogeochem. Cycles18, GB1024. (doi:10.1029/2003GB002058.)
Blodau, C. 2002 Carbon cycling in peatlands—a review of processes and controls.Environ. Rev.10, 111–134. (doi:10.1139/a02-004.)
Burt, T. P. 1995 The role of wetlands in runoff generation from headwater catchments. In
Hydrology and hydrochemistry of British wetlands(ed. J. M. R. Hughes & A. L. Heathwaite), pp. 21–38. Chichester: Wiley.
Carey, S. K. & Woo, M.-K. 1999 Snowmelt hydrology of two subarctic slopes, southern Yukon, Canada.Nord. Hydrol.29, 331–346.
Charman, D. 2002Peatlands and environmental change. Chichester: Wiley.
Clymo, R. S. 1983 Peat. InEcosystems of the world 4A. Mires: swamp, bog, fen and moor(ed. A. J. P. Gore), pp. 159–224. Amsterdam: Elsevier.
Dawson, J. J. C., Billett, M. F. & Neal, C. 2002 A comparison of particulate, dissolved and gaseous carbon in two contrasting upland streams in the UK.J. Hydrol. 257, 226–246. (doi:10.1016/ S0022-1694(01)00545-5.)
Dillon, P. J. & Molot, L. A. 1997 Effect of landscape form on export of dissolved organic carbon, iron, and phosphorus from forested stream catchments. Water Resour. Res. 33, 2591–2600. (doi:10.1029/97WR01921.)
Evans, M. & Warburton, J. 2001 Transport and dispersal of organic debris (peat blocks) in upland fluvial systems.Earth Surf. Process. Landforms26, 1087–1102. (doi:10.1002/esp.256.) Evans, M. & Warburton, J. 2005 Sediment budget for an eroding peat-moorland catchment in
northern England.Earth Surf. Process. Landforms30, 557–577. (doi:10.1002/esp.1153.) Evans, M. G., Burt, T. P., Holden, J. & Adamson, J. K. 1999 Runoff generation and water table
fluctuations in blanket peat: evidence from UK data spanning the dry summer of 1995.
J. Hydrol.221, 141–160. (doi:10.1016/S0022-1694(99)00085-2.)
Frey, K. E. & Smith, L. C. 2005 Amplified carbon release from vast Siberian peatlands by 2100.
Geophys. Res. Lett.32, L09401. (doi:101029/2004GL022025.)
Heathwaite, A. L. 1995 Overview of the hydrology of British wetlands. In Hydrology and hydrochemistry of British wetlands (ed. J. M. R. Hughes & A. L. Heathwaite), pp. 11–20. Chichester: Wiley.
Hilbert, D. W., Roulet, N. & Moore, T. 2000 Modelling and analysis of peatlands as dynamical systems.J. Ecol.88, 230–242. (doi:10.1046/j.1365-2745.2000.00438.x.)
Holden, N. M. 1998 By-pass of water through laboratory columns of milled peat.Int. Peat J.8, 13–22. Holden, J. 2004 Hydrological connectivity of soil pipes determined by ground penetrating radar
tracer detection.Earth Surf. Process. Landforms29, 437–442. (doi:10.1002/esp.1039.) Holden, J. 2005 Controls of soil pipe frequency in blanket peat. J. Geophys. Res. 110, F01002.
(doi:101029/2004JF000143.)
Holden, J. & Burt, T. P. 2002a Infiltration, runoff and sediment production in blanket peat catchments: implications of field rainfall simulation experiments. Hydrol. Process. 16, 2537–2557. (doi:10.1002/hyp.1014.)
Holden, J. & Burt, T. P. 2002bPiping and pipeflow in a deep peat catchment.Catena48, 163–199. (doi:10.1016/S0341-8162(01)00189-8.)
Holden, J. & Burt, T. P. 2002cLaboratory experiments on drought and runoff in blanket peat.Eur. J. Soil Sci.53, 1–15. (doi:10.1046/j.1365-2389.2002.00486.x.)
Holden, J. & Burt, T. P. 2003a Runoff production in blanket peat covered catchments.Water Resour. Res.39, 1191. (doi:10.1029/2003WR002067.)
Holden, J. & Burt, T. P. 2003bHydraulic conductivity in upland blanket peat: measurement and variability.Hydrol. Process.17, 1227–1237. (doi:10.1002/hyp.1182.)
Holden, J. & Burt, T. P. 2003c Hydrological studies on blanket peat: the significance of the acrotelm–catotelm model.J. Ecol.91, 86–102. (doi:10.1046/j.1365-2745.2003.00748.x.) Holden, J., Burt, T. P. & Cox, N. J. 2001 Macroporosity and infiltration in blanket peat: the
implications of tension disc infiltrometer measurements.Hydrol. Process.15, 289–303. (doi:10. 1002/hyp.93.)
Holden, J., Chapman, P. J. & Labadz, J. C. 2004 Artificial drainage of peatlands: hydrological and hydrochemical process and wetland restoration.Prog. Phys. Geogr.28, 95–123.
Ingram, H. A. P. 1983 Hydrology. InEcosystems of the world 4A. Mires: swamp, bog, fen and moor
(ed. A. J. P. Gore), pp. 67–158. Amsterdam: Elsevier.
Ivanov, K. E. 1948 Filtration in the top layer of convex mire massifs.Meteorol. Gidrol.2, 46–59. [In Russian.]
Jones, J. A. A. 1981 The nature of soil piping: a review of research.British geomorphological research group monograph series 3. Norwich: Geo Books.
Jones, J. A. A., Richardson, J. M. & Jacob, H. J. 1997 Factors controlling the distribution of piping in Britain: a reconnaissance.Geomorphology20, 289–306. (doi:10.1016/S0169-555X(97)00030-5.) Kirkby, M. J., Kneale, P. E., Lewis, S. L. & Smith, R. T. 1995 Modelling the form and distribution
of peat mires. InHydrology and hydrochemistry of British wetlands(ed. J. M. R. Hughes & A. L. Heathwaite), pp. 83–93. Chichester: Wiley.
Klinger, L. F., Zimmermann, P. R., Greenberg, J. P., Heidt, L. E. & Guenther, A. B. 1994 Carbon trace gas fluxes along a successional gradient in the Hudson Bay lowland.J. Geophys. Res.99, 1469–1494. (doi:10.1029/93JD00312.)
Lane, S. N., Brookes, C. J., Hardy, R. J., Holden, J., James, T. D., Kirkby, M. J., McDonald, A. T., Tayefi, V. & Yu, D. 2003 Land management, flooding and environmental risk: new approaches to a very old question. In Proc. Chartered Institution of Water Environmental Management National Conf.: the environment–visions, values and innovation. Harrogate, 10–12 September 2003.
Lane, S. N., Brookes, C. J., Kirkby, M. J. & Holden, J. 2004 A network-index-based version of TOPMODEL for use with high-resolution digital topographic data. Hydrol. Process. 18, 191–201. (doi:10.1002/hyp.5208.)
Malmer, N. 1962 Studies on mire vegetation in the Archaean area of southwestern Gotaland (south Sweden). 1. Vegetation and habitat conditions on the Akhult mire.Opera Bot.7, 1–322. Mark, A. F., Johnson, P. N., McGlone, M. S. & Dickinson, K. J. M. 1995 Southern hemisphere
patterned mires with emphasis on southern New Zealand.J. R. Soc. NZ25, 23–57.
McNeil, P. & Waddington, J. M. 2003 Moisture controls onSphagnumgrowth and CO2exchange
on a cutover bog.J. Appl. Ecol.40, 354–367.
Norrstrom, A. C. & Jacks, G. 1996 Water pathways and chemistry at the groundwater surface water interface to Lake Skjervatjern, Norway.Water Resour. Res.32, 2221–2229.
Ogawa, H. & Male, J. W. 1986 Simulating the flood mitigation role of wetlands.J. Water Resour. Plan. Manage.112, 114–128.
Pastor, J., Solin, J., Bridgham, S. D., Updegraff, K., Harth, C., Weishampel, P. & Dewey, B. 2003 Global warming and the export of dissolved organic carbon from boreal peatlands.Oikos100, 380–386. (doi:10.1034/j.1600-0706.2003.11774.x.)
Price, J. S. 1992aBlanket bog in Newfoundland. Part 2. Hydrological processes.J. Hydrol. 135, 103–119. (doi:10.1016/0022-1694(92)90083-8.)
Price, J. S. 1992bBlanket bog in Newfoundland. Part 1. The occurrence and accumulation of fog water deposits.J. Hydrol.135, 87–101. (doi:10.1016/0022-1694(92)90082-7.)
Price, J. 1997 Soil moisture, water tension, and water table relationships in a managed cutover bog.
J. Hydrol.202, 21–32. (doi:10.1016/S0022-1694(97)00037-1.)
Price, J. S. & Waddington, J. M. 2000 Advances in Canadian wetland hydrology and biogeochemistry.Hydrol. Process.14, 1579–1589. (doi:10.1002/1099-1085(20000630)14:9!1579:: AID-HYP76O3.0.CO;2-.)
Price, J. S., Rochefort, L. & Quinty, F. 1998 Energy and moisture considerations on cutover peatlands: surface micro-topography, mulch cover andSphagnumregeneration.Ecol. Eng. 10, 293–312. (doi:10.1016/S0925-8574(98)00046-9.)
Quinton, W. L. & Marsh, P. 1998 Melt water fluxes, hillslope runoff and streamflow in an arctic permafrost basin. InProc. 7th Int. Conf. on Permafrost, 23–27 June, Yellowknife, pp. 921–926. Rochefort, L., Quinty, F., Campeau, S., Johnson, K. & Malterer, T. 2003 North American approach to the restoration of Sphagnum dominated peatlands. Wetlands Ecol. Manage. 11, 3–20. (doi:10.1023/A:1022011027946.)
Rosenberry, D. O., Glaser, P. H., Siegel, D. I. & Weeks, E. P. 2003 Use of hydraulic head to estimate volumetric gas content and ebullition flux in northern peatlands.Water Resour. Res. 39, 1066. (doi:10.1029/2002WR001377.)
Roulet, N. 1990 The hydrological role of peat-covered wetlands.Can. Geogr.34, 82–83.
Schiff, S., Aravena, R., Mewhinney, E., Elgood, R., Warner, B., Dillon, P. & Trumbore, S. 1998 Precambrian shield wetlands: hydrologic control of the sources and export of dissolved organic matter.Climatic Change40, 167–188. (doi:10.1023/A:1005496331593.)
Silvola, J., Alm, J., Ahlholm, U., Nyka¨nen, H. & Martikainen, P. J. 1996 CO2fluxes from peat in
boreal mires under varying temperature and moisture conditions.J. Ecol.84, 219–228. Turner, N. 1757An essay on draining and improving peat bogs; in which their nature and properties
are fully considered. London: Baldwin and Pew.
Turunen, J., Tahvanainen, T., Tolonen, K. & Pitkanen, A. 2001 Carbon accumulation in West Siberian mires, Russia.Global Biogeochem. Cycles15, 285–296. (doi:10.1029/2000GB001312.) Warburton, J. 2003 Wind-splash erosion of bare peat on UK upland moorlands. Catena 52,
191–207. (doi:10.1016/S0341-8162(03)00014-6.)
AUTHOR PROFILE
Joseph Holden