1 Title: International patent systems strength 1998 - 2011
Author names and affiliations:
1) Dr Nikolaos Papageorgiadis,* University of Bradford (and Uppsala
University, Sweden)
Bradford University School of Management, Emm Lane, Bradford, West
Yorkshire, BD9 4JL, UK.
Tel: +44 (0)1274 234784, Fax: +44 (0)1274 235680
Email: N.Papageorgiadis1@bradford.ac.uk
2) Mr Adam R Cross, University of Leeds
Centre for International Business (CIBUL), Leeds University Business School,
University of Leeds, Leeds, West Yorkshire, LS2 9JT, UK.
Tel: + 44 (0) 113 3434587, Fax: +44 (0)113 343 4754
Email: arc@lubs.leeds.ac.uk
3) Dr Constantinos Alexiou, Cranfield University
Cranfield University School of Management, Cranfield University, Cranfield,
Bedfordshire, MK43 0AL, UK.
Tel: +44 (0)1234 754311, Fax: +44 (0)1234 751806
Email: constantinos.alexiou@cranfield.ac.uk
Corresponding Author:
2 Abstract:
In this paper we report on a composite index of international patent systems
strength for 48 developing and industrialized countries annually from 1998 to
2011. Building upon earlier indices we develop a conceptual framework
informed by transaction cost theory and derive measures which emphasize the
importance of enforcement-related aspects of the patent system of countries.
Findings reveal harmonization of the regulative aspects of patent protection
internationally in the post-TRIPs era but not of overall national patent systems.
The index should inform studies on the relationship between national patent
systems and a range of international business and other phenomena.
Keywords:
Intellectual property, patent, national patent systems index, patent enforcement,
3 International patent systems strength 1998 - 2011
1. Introduction
This study reports a new composite index of patent system strength for 48
countries annually for the period 1998 to 2011. Research shows that national
patent protection strength has a strong determinant effect on a range of
international business activity, including foreign direct investment, inter-firm
alliances, exports, R&D, innovation, licensing and technology transfer (Allred
& Park, 2007; Fink & Maskus, 2005, Ghauri & Rao, 2009; Hagedoorn, Cloodt
& Van Kranenburg, 2005; Ivus, 2010; Kafouros & Forsans, 2012; Khoury &
Peng, 2011; Papageorgiadis, Cross & Alexiou, 2013). Much of this empirical
investigation has relied upon quantifiable measures that capture the evolution of
patent systems in countries. To this end, numerous intellectual property (IP)
indices have been devised, such as those by Rapp and Rozek (1990), Ginarte
and Park (1997) and Ostergard (2000). However, these existing measures have
become outdated, with the exception of the most frequently employed indices
of national patent protection strength reported by Ginarte and Park (1997) and
updated by Park (2008). These two indices (henceforth the GP indices) have
become widely accepted as standard measures of patent protection levels (and
arguably, of IP protection regimes in general) not least because they account for
the presence, or not, of particular items of patent-related book-law contained in
the statutes of countries.1
4
In contrast to what the GP indices measure, the ability of firms to extract
value, or to appropriate returns, from the patents they own is dependent not
only upon the existence of patent-related book-law in the legal framework of
countries but also upon the ability of government agents and institutional actors
(such as the judiciary, law enforcement and customs officials) to administer,
police and enforce these laws in practice (Keupp, Beckenbauer & Gassmann,
2010; Shultz & Saporito, 1996; Staake & Fleisch, 2010; Yang, 2005; Yang,
Fryxell & Sie, 2008; Yang, Sonmez & Bosworth, 2004). Indeed, as Park (2008,
p. 761) points out, the GP indices were “designed to provide an indicator of the
strength of patent protection, not the quality of patent systems”. Consequently,
although the GP indices are commonly used as proxies for the regulatory
environment that underpins national patent protection in terms of book-law,
more research needs to be done to quantify additional aspects of the patent
system of countries within which patent rights are granted, infringed and
enforced (Arora, 2009; Cockburn, 2009; Ivus, 2010; Maskus, 2000). We
achieve this with the new index reported here.
The need for a new index that measures the strength of a national patent
system – and which places particular emphasis on the effectiveness of
enforcement practices, together with the overall administrative functioning of
the system as perceived by managers – can be justified on both managerial and
empirical grounds. From a managerial perspective, the original Ginarte and
Park index was created largely in response to a time when levels of book-law
protection of patents were highly variable across countries (Chaudhry & Walsh,
5
Aspects of Intellectual Property Rights (TRIPS) agreement has harmonized to a
great extent the minimum standards of legal protection for patents offered by
countries.2 However, the same cannot be said for enforcement levels (IPO, 2011; Li & Correa, 2009; OECD, 2009; USTR, 2011). The fact that patent
enforcement levels and practices are often ineffective or inadequate in countries
can be demonstrated in three ways: (i) by the latest IP-related plurilateral
Anti-Counterfeiting Trade Agreement (ACTA), concluded in October 2011, which
aims to establish international standards for IP enforcement across signatory
States on the basis that current conditions are often unsatisfactory; (ii) by the
patent enforcement-related clauses and conditions which are regularly included
for the same reason in bilateral trade and investment agreements (such as the
EU-India and EU-China trade agreements presently under negotiation); and (iii)
by the growing extent of counterfeiting and piracy around the world, which is
estimated to account for between 1 and 2 per cent of current global merchandise
trade in value terms (OECD, 2009; Staake & Fleisch, 2010).
On the empirical front, several recent contributions to the international
business literature have called for stronger measures to facilitate understanding
of how institutional variables such as IP systems matter to the strategic
management of intangible assets as firms extend their activities abroad (Peng,
2003; Peng, Sun, Pinkham & Chen, 2009). As Jain (2002) comments,
international business researchers need to be more mindful of IP-related issues
6
in general, and especially in relation to variable levels of enforcement and other
factors that influence patent protection intensity in a country. For all these
reasons, the need exists for a new index that extends the scope of coverage
offered by the GP indices by accounting for variable levels of patent
enforcement across countries.
This study contributes to existing literature by reporting a novel
composite measure of national patent system strength for 48 countries and
economies annually for the period 1998 to 2011. Following the rationale of
transaction cost theory, we calculate a new dataset that captures how managers
perceive levels of patent enforcement in a country as well as the general
effectiveness and efficiency of the national patent system. To create the new
index we use a number of uniform techniques recommended by the
Organization for Economic Co-operation and Development in their Handbook
on Constructing Composite Indicators (OECD, 2008). This is arguably the most
authoritative guide currently available on the creation of nationally comparable
measures of macro phenomena (Archibugi, Denni & Filippetti, 2009;
Fagerberg, Srholec & Knell, 2007).
The remainder of the paper is organized as follows. Section two
provides a brief background on patent systems and the IP index literature to
which this study relates. Our purpose here is to identify attributes that have led
the GP indices to become widely used as proxies for national patent and overall
IP protection strength, along with methodological insights from related studies
which we use to inform the design of the new index. In section three we
7
patent systems strength index is based, following the directions of transaction
costs theory. Section four then explains the methodology used to construct the
new composite index, with particular emphasis placed on transparency to
facilitate replication and future extension. In section five we report on the new
index for 48 countries and discuss its contribution in the context of a
comparison with the individual country scores of the GP index and with
national GDP per capita data. Finally, in section six we conclude by discussing
the implications of this study for both researchers and managerial
decision-making.
2. Background
2.1. National patent system
Patents represent a key source of competitive advantage to innovative firms
since, once granted, legal redress by the owner can be sought if the patent is
infringed or otherwise misappropriated through the sale, manufacture, use,
importation or distribution of the patented technology without permission
(Macqueen, Waelde & Laurie, 2008; WIPO, 2008). A national patent system
within which ownership rights are conferred is comprised of three elements,
namely: (i) the legal framework and instruments set out in book-law that define
and enable the formal protection of patents in a country; (ii) the operations
which enforce these rights in practice; and (iii) the efficient governance and
activities of public and private organizations concerned with the operations of
the patent system (Gowers, 2006). The legal framework sets forth the rules that
8
coherent legal framework provides a safeguard for patent owners who can seek
redress from the judicial system should misuse, infringement or
misappropriation of legal rights occur (Papageorgiadis et al., 2013; Peng et al.,
2009). However, the availability of a comprehensive legal framework is a
necessary but not sufficient condition to defend against imitation and
misappropriation. In order to uphold their rights, the patent owner is required to
engage with the administrative bodies responsible for the governance and
operations of the patent system and, especially, enforcement-related actors. The
administrative bodies are responsible for the clerical functions required for the
patent system to operate effectively, such as the efficiency of prior art searches,
patent examinations, and timely responses to applicants (Yang et al., 2008).
Similarly, enforcement-related operations involve the existence, availability,
effectiveness and quality of organizations and firms such as police forces and
customs officials as well as private enforcement agencies who facilitate the
effective use of the patent system by economic actors (Keupp et al., 2010;
Shultz & Saporito, 1996; Yang et al., 2008).
2.2. Indices measuring intellectual property strength
Over the last thirty years, many studies have reported indices of IP strength in
an effort to quantify and depict differences in the level of book-law protection
or enforcement offered by the IP systems of countries over certain periods of
time.3In this context, the two dominant approaches used are as follows: (i) indices which seek to quantify the existence and scope of IP law (book-law,
9
statutes, and so forth) and (ii) indices which seek to quantify differences in the
quality of IP enforcement.
2.2.1. Indices measuring IP book-law protection
Measurement of dissimilarities between book-law protection provisions within
the regulative systems of countries is the most widely adopted approach
followed in the IP index literature. These studies account for the level of
book-law protection in a country using binary variables to depict the existence (or
not) of particular items of IP-related legislation (Bosworth, 1980; Ferrantino,
1993; Ginarte & Park, 1997; Kondo, 1995; Rapp & Rozek, 1990; Seyoum,
1996; Van Kranenburg & Hogenbirk, 2005).4 In general, a country is awarded one point when a certain legal provision is incorporated into its IP regulatory
system and none when it is absent. In addition, countries are rewarded if they
are members of an international IP treaty such as the Paris or Berne
Convention. A final composite index is then calculated by summating the points
received from all variables. The higher the number of legal provisions offered
the higher a country scores in terms of the strength of its regulatory system.
With the exception of the GP index, all the studies following this approach use
differing methodologies to derive values for various country sets and different
time periods prior to 1998 and were then discontinued.
The first iteration of the GP index quantified the strength of book-law
patent protection for 110 countries, in five-year intervals for the period 1960 to
10
1990 (Ginarte & Park, 1997). It was subsequently extended by Park (2008) up
to the year 2005 and for a total of 122 countries. The index is comprised of five
constructs, namely: (i) patent coverage, (ii) membership of international
treaties, (iii) enforcement mechanisms, (iv) restrictions on patent rights, and (v)
duration of patent protection. The ‘coverage’ construct includes eight variables
designed to capture the availability of patent protection in certain industrial
sectors where patent protection is perceived as being particularly beneficial to
the patent holder, such as the patentability of pharmaceutical products. The
‘membership of international treaties’ construct includes five variables relating
to whether or not a country is signatory to patent-related treaties, such as the
TRIPS agreement. It should be noted that the TRIPS agreement is concerned
not only with matters relating to patents but also with other types of IP such as
copyright and trademarks. The ‘enforcement mechanism’ construct captures the
existence of laws that can enable patent enforcement, such as the availability of
preliminary injunctions. Importantly, in the GP indices this construct concerns
only the availability of book-law protection, not how such laws are actually
enforced. Nor does it concern other enforcement-related activities. The
‘restrictions on patent rights’ construct considers the existence of laws that have
the potential to negatively affect the appropriation of patent rights by owners,
such as those that enable the revocation of patents. Finally, the fifth construct,
‘duration of patent protection’, is measured by one variable where countries
offering protection for less than 20 years from the date of application score
lower than those meeting or exceeding this condition. The summated value of
11
construct. The overall patent protection score of a country reported in the GP
indices then consists of the unweighted sum of component construct values,
with scores ranging between ‘0’ (which signals an absence of patent protection
in a country) and ‘5’ (which signals much higher levels of protection).
Two important features of the methodology used to create the GP
indices have reinforced their usefulness as quantitative tools for researchers.
Firstly, the conceptual framework is easily comprehensible, whereby the five
constructs concerning patent-related law are clearly identified, defined and
quantified. Consequently, what the indices seek to proxy for and why is clearly
discernible. This means that researchers can readily determine if they are fit for
purpose. Secondly, the methodology employed is transparent, enabling
replication and extension of the index if required. Both these features have
resulted in the GP indices becoming the IP index of choice for international
business scholarship, as well as by policy-making organizations (Arora, 2009;
Cockburn, 2009; Intellectual Property Office, 2011).
2.2.2. Indices measuring IP enforcement
The second methodological approach found in the IP index literature focuses on
quantifying the enforcement-related aspects of the IP system. Indices that
sought to measure IP enforcement levels were developed for selected years in
the 1990s and were subsequently discontinued, mainly due to the difficulty
associated with identifying and collecting relevant data (Gadbaw & Richards,
1988; Marron & Steel, 2006; McCalman, 2004; Ostergard, 2000; Smarzynska,
2004). The studies by Gadbaw and Richards (1988) and Ostergard (2000)
12
quality of IP protection and enforcement in different countries. For example,
Ostergard (2000) calculated an IP enforcement index using content analysis of
the Country Reports on Economic Policy and Trade Practices published by the
US Department of State (USDS, 2013). The USDS report described in
qualitative terms IP enforcement levels evident in different countries.5
Ostergard collated time series data for 76 countries across three time intervals
(1988, 1991 and 1994). Similarly, Smarzynska (2004) developed an index that
proxies for IP enforcement in 24 countries for the year 1995, and used it in a
study together with the GP index. This index was calculated using evidence
derived from the qualitative analysis of IP systems in the US Trade
Representative’s (USTR) Special 301 Report which reviews IP protection and
enforcement issues for countries on an annual basis (USTR, 2013). Finally,
Marron and Steel (2006) attempted to account for IP enforcement using piracy
rates calculated by the Business Software Alliance for the period 1994 to 1997
in 70 countries, while McCalman (2004) used the Corruption Perceptions Index
(CPI) published by Transparency International in conjunction with the GP
index to develop a composite index of enforcement strength in 1997 for 40
countries.
This literature on IP-related indices – most notably the GP indices –
provides a useful platform on which to base the design of a new international
patent systems strength index, especially with regard to methodology, as we
explain below. Following OECD (2008) guidelines on the construction of
composite indicators, we first derive a conceptual framework which is then
5
13
used to identify the variables required to calculate the new index. We now
discuss and explain the component elements of a patent system and establish a
conceptual framework using transaction costs theory to illustrate how it impacts
on international business activity.
3. Conceptual framework and theoretical foundation 3.1. The effect of patent systems on international business activity
Studies show that firms encounter difficulties when engaging with foreign
institutions that are substantively different, or “distant”, from their home
institution or those with which they are already familiar (Kostova, 1999; Xu &
Shenkar, 2002). Firms seeking to appropriate value from their intellectual assets
need to ensure that they adequately account for institutional differences
associated with a host country (Kostova, 1999). The performance of institutions
such as the patent system becomes crucial when firms engage in cross-border
transactions (Henisz, 2003; Mudambi & Navarra, 2002; Peng, 2002, 2003). The
nature, structure and effectiveness of a national patent system impacts on the
way that firms are able to appropriate or extract value from their innovations
and, it follows, how business activity is organized and conducted within the
system and country (Teece, 2006).
According to Hargreaves (2011), the patent system imposes transaction
costs to firms in the form of search, administration and enforcement costs.
Transaction costs arise mainly from interactions between the patent system and
the strategies that patent owners undertake in order to successfully exploit their
14
the patent system raises the transaction costs that a company faces (Demirbag,
Glaister & Tatoglu, 2007; Jarzabkowski, 2008). In turn, and following
transaction costs thinking, the patent system influences firm decision-making
such as whether to internalize activities or transact outside corporate boundaries
using external markets (Papageorgiadis et al., 2013). Consequently, it is
necessary to understand the transaction costs that companies experience when
interacting with a country’s patent system.
3.2. Transaction costs originating from engagement with the patent system
Following the thinking and terminology of Hargreaves (2011) and Williamson
(1975) we recognize three specific types of transaction costs which arise from
the interactions of foreign firms with the patent system of host countries,
namely servicing costs, property rights protection costs and monitoring costs
(see also Anderson & Gatignon, 1986; Clegg & Cross, 2000).
3.2.1. Servicing costs
Servicing costs are those costs that arise from the transfer of patent rights to a
contracting party (either a related or unrelated concern) in a host country (Clegg
& Cross, 2000). Servicing costs are generated from both within and beyond the
boundaries of the firm. Internally, servicing costs consist of, inter alia, those
costs associated with (i) codifying the intellectual asset to facilitate its transfer,
(ii) implementing security measures to mitigate the threat of inappropriate
leakage of intellectual assets to rivals, and (iii) education, training and support
of contracting parties on how to effectively operationalize or exploit the
intellectual asset, such as the provision of practical advice, expertise and
15
Greater absorptive capacity of the recipient will have the effect of reducing
these internal servicing costs. Externally, servicing costs arise when dealing
with the patent system of a country. External servicing costs are determined by
(i) the quality of administration in terms of the efficiency, transparency and
timeliness of agencies that deal with patent-related matters and their systems
and routines; (ii) the complexity, clarity and communication of patent-related
regulations and procedures; and (iii) the quality of administrative decisions
made by government agencies who deal with patent-related matters for and on
behalf of foreign and domestic firms.
3.2.2. Property rights protection costs
The transaction costs which arise from property rights protection relate to, first,
whether or not ownership rights are upheld by the patent system when, for
example, infringement cases are taken to court and, second, the general
effectiveness of the judiciary, police forces, customs officials and other
government agencies when undertaking patent enforcement-related activities.
Should such actions fall short of the expectations of the patent owner, or are
otherwise deficient, then costs will be incurred as steps are taken to ameliorate
the effects of this outcome. With regard to the upholding of ownership rights,
time-related issues are important, since there are various costs involved in the
period between taking a patent-related case to court and the delivery of a
verdict. Long delays translate to direct costs (in the form of legal fees, for
example) and to the opportunity costs arising from the ability of the defendant
to continue to profit from sales of the disputed articles (with regard to patent
16
involves costs arising from the inefficiency of local judicial enforcement
procedures (Yang et al., 2008). On the one hand, transaction costs will be lower
when the judicial system is transparent, even-handed, independent and does not
behave arbitrarily and when it functions efficiently in terms of resourcing levels
and timeliness. On the other, an opaque, arbitrary or inefficient judicial system
that is receptive to corrupt practices will elevate transaction costs for foreign
firms engaging with a national patent system (Hillman & Keim, 1995; OECD,
2009; Papageorgiadis et al., 2013; USTR, 2011).
3.2.3. Monitoring costs
Monitoring costs arise from the efforts undertaken to constrain the activities of
those related or unrelated parties who behave opportunistically, thereby
infringing upon the property rights of patent owners (Clegg & Cross, 2000;
Shultz & Saporito, 1996). These concerns are closely related to the issues of
opportunity cost and free-riding potential. A firm whose intellectual assets are
exploited illegally may miss the opportunity to appropriate some or all of the
market returns. In addition, any resulting infringement acts which are not
pursued may help to establish a competitor in the marketplace who is then able
to profit illegally from the intangible assets of the patent owner (Granstrand,
1999; Maskus, 2000). Monitoring costs are thus incurred as the patent owner
scans the marketplace to identify instances of infringement of its intellectual
assets. Such costs also arise as the patent owner motivates, informs and
influences the activities of the relevant police forces, border customs and other
enforcement agencies in order to uphold their rights as and when patent
17
agencies can be ineffective in combatting infringement for a variety of reasons,
including understaffing, lack of resourcing, inexperience, and corruption,
amongst other things (USTR, 2013; Yang et al., 2008).
To a great extent, the need for enforcement-related intervention will be
dependent upon cultural and societal attitudes towards the production and
consumption of infringing goods, as well as on public commitment to patent
protection in general. Societal attitudes largely determine the extent to which
infringing acts are acceptable and if a market exists for the consumption of
infringing goods, since it is among society members that legitimization and
approval is achieved. A society in which a significant majority regards the
production, purchase and use of infringing products as acceptable behaviour is
more likely to foster and legitimize such activity (Yang, 2005). Similarly,
individuals may not be aware of what constitutes legal protection and the rights
of patent owners, and may therefore be more prone to violate those rights in the
belief that they are acting legally (Bryce & Rutter, 2005; Hung, 2003). In
contrast, greater awareness of the positive economic effects of patents within a
society will lead to higher commitment to patent protection (Lee & Yoo, 2009)
since consumers understand better the benefits of an effective patent system
(e.g. for employment or wealth creation reasons). Therefore, societal
understanding of, and commitment to, patent protection as well as enforcement
represent an important component of the national patent system. It contributes
to the success of enforcement measures, and also to the propensity in a country
18
Identification of these three types of transaction costs that arise from a
patent owner’s interaction with the patent system enables us to construct the
framework presented in Table 1. Here, we identify the focal transaction cost
type, the precise component of the patent system which generates the cost, and
the proxy variables we use to measure the component and build the index. The
new index contains proxies for each of the transaction costs identified above.
These focus on the enforcement dimension of the patent system as it is
perceived by managers.
---Table 1 goes about here---
4. Data Sources
We now discuss the secondary data and sources used to quantify the effect of
transaction costs resulting from a firm’s interaction with the national patent
system, as defined and described in our conceptual framework. To strengthen
the reliability and validity of the new composite index, and to allow it to be
regularly updated and recalculated (e.g. annually), it was decided a priori that
the selection of secondary data should first satisfy six criteria. These were that
the data should: (i) have a close conceptual relevance to the theoretical
framework in order to serve as meaningful proxies of the patent system and its
associated transaction costs; (ii) have an early date of initial publication to
increase the longitudinality of the index; (iii) be collected consistently over time
to enhance the reliability of the index; (iv) be reported frequently to strengthen
the discriminatory power of the index; (v) cover a wide range of countries to
bolster the applicability of the index; and (vi) be readily available to facilitate
19 4.1. Measures
Following an extensive review, six secondary data sources were identified
which satisfy each of the above criteria. These are: (i) the Global
Competitiveness Report (GCR) of the World Economic Forum (WEF); (ii) the
World Competitiveness Yearbook (WCY) of the International Institute of
Management Development (IMD); (iii) the International Country Risk Guide
(ICRG) published by the Political Risk Services (PRS) Group; (iv) the
Corruption Perceptions Index (CPI) produced by Transparency International;
(v) data on piracy rates reported by the Business Software Alliance (BSA); and
(vi) the USTR Special 301 Report. From these sources ten variables were
obtained to proxy for each of the transaction costs constructs discussed above.
4.1.1. The servicing costs measures
The servicing costs construct is captured by one element, namely the “quality of
IP administration”. Two variables are used to proxy for the measurement of this
construct: firstly, the “bureaucracy quality index” reported in the ICRG and
secondly, the “bureaucracy does not hinder business activity” indicator
published in the WCY. With regard to the first variable, the PRS Group ranks
the perceived political risk levels of countries in the ICRG, in which the
“bureaucracy quality index” is one of twelve components comprising the
overall political risk score. This measures a country’s ability to implement its
policies without significant changes and interruptions to government services.
Therefore countries with weak bureaucracies which cannot absorb policy
changes without affecting daily administration score low, whereas strong and
20
high. The values assigned to this component range along a scale from “0”
(weak bureaucracy) to “4” (strong bureaucracy). Our assumption is that the
quality of those agencies which administer patent-related laws and regulations
is approximated by the overall level of national bureaucratic performance as
reflected by this index. Regarding the second variable, the IMD evaluates in the
WCY the actual and perceived competitiveness of nations by, amongst other
things, collecting annual data through its “Executive Opinion Survey”. The
“bureaucracy does not hinder business activity” indicator is calculated from
responses to this survey question, with a minimum score “0” equating to
bureaucracy levels that heavily influence business activity, and the maximum
“10” to bureaucracy that does not restrict business activity. We incorporate this
variable to capture the additional effect of patent-related government agencies
on business activity beyond the quality of these agencies as indicated by the
ICRG score.
4.1.2. The property rights protection costs measures
The property rights protection construct is estimated using two elements,
namely judicial enforcement and the level of corruption in the judiciary. We use
three variables to proxy for the judicial enforcement component of the national
patent system and one to proxy for corruption levels. With regard to judicial
enforcement, first we take the indicator “justice is fairly administered” reported
in the WCY. Again, this is constructed from survey responses and varies along
a scale from “0” (‘low levels of fairness and even-handedness’) to “10” (‘high
levels’). We assume a close correlation between the way that patent rights are
21
overall fairness of a country’s judiciary. Second, we employ the “law and
order” indicator as quantified in the ICRG using two different sub-components,
those of “law” and “order”, with both ranging from a minimum score of “0” to
a maximum of “3”. The “law” sub-component is a measure of the strength and
impartiality of a country’s legal system, while the “order” sub-component is
calculated by evaluating popular beliefs concerning law enforcement (i.e. crime
rates). The combined indicator therefore ranges along a scale from “0” to “6” (a
summation of the two sub-variable scores). The third proxy derives from the
“judicial independence” indicator originating from the annual “Executive
Opinion Survey” published in the GCR, which was introduced in 1998 and is
measured by executives’ responses to the question “Is the judiciary in your
country independent from political influences of members of government,
citizens or firms?”. The minimum score is “1” (political influence is high) while
the maximum is “7” (the judicial system is entirely independent). Our
assumption is that higher levels of political interference correlate to weaker
judicial enforcement and therefore to higher property rights protection costs,
especially in relation to the patent system. Finally, following McCalman
(2004) we proxy for levels of corruption in the judiciary using the Corruption
Perceptions Index (CPI). This is an annual composite index calculated using
data from thirteen different sources and ten institutions to estimate corruption
levels in a country, with scores ranging from “0” (highly corrupt countries) to
“10” (highly ‘clean’) (Transparency International, 2011).
22
The monitoring costs construct is operationalized using five elements: (i) the
perceptions of patent owners to changes in a country’s patent protection and
enforcement regime; (ii) cultural and societal attitudes towards the purchase of
infringing goods; (iii) the level of public commitment to patent protection in
general; (iv) the effectiveness of police enforcement; and (v) the strength of
border controls. We identify four variables to proxy for the measurement of
these elements, namely: a) the “intellectual property rights” indicator reported
in the WCY; b) the “intellectual property protection” indicator reported in the
GCR; c) data from the Global PC Software Piracy study by the Business
Software Alliance (BSA); and d) data from the USTR Special 301 Report.
An indicator for “intellectual property rights” was introduced in the
WCY in 1997 and is measured by managers’ responses to the statement
“Intellectual property rights are adequately enforced”. The lowest score
assignable is “0” (weak or non-existent IP enforcement), and the highest is “10”
(the maximum level of IP enforcement available). We use this value to proxy
for perceptions of patent owners towards national patent enforcement levels.
Second, an “intellectual property protection” indicator was introduced in the
GCR in 1997 and it is measured by executives’ responses to the statement
“Intellectual property is well protected in your country”. The minimum score
assignable is “1”, equating to weak or non-existent IP protection and the
maximum is “7”, equating to protection levels comparable to “the world’s most
stringent” (a concept not defined further). This value is used to measure
perceived patent protection levels in countries. Third,the BSA publishes an
23
piracy. We employ BSA data here on the basis that software piracy rates
indicate the general preparedness of consumers in a country to acquire and use
products of questionable origin (Marron & Steel, 2006). These data are used to
proxy for the monitoring costs arising from two elements of the patent system,
namely: (i) cultural and societal attitudes towards the purchase of infringing
goods, and (ii) levels of public commitment to patent protection. The scale was
inverted to align it with the directionality of our other variables.
Finally, we construct a fourth indicator using the reviews of IP
enforcement efforts of countries published annually by the USTR. This is used
to measure the effectiveness of police enforcement and strength of border
controls present in the patent system. The reviews are published annually in the
“Special 301 Report”. Each report offers a qualitative assessment whereby
countries that are considered to offer inadequate levels of IP protection and
enforcement are grouped into one of three different categories, namely: (i)
“Watch List”, (ii) “Priority Watch List” and (iii) “Section 306 Monitoring”.
Countries named in the “Watch List” are those with problematic IP protection
and enforcement levels. Those placed in the “Priority Watch List” suffer from
the same issues but garner greater attention from the US government because of
their importance in bilateral trade (i.e. they attract more complaints from US
companies requesting remedial actions by US authorities).6 Lastly, the “Section 306 Monitoring” list includes countries previously named in the “Priority Watch
List” and that the USTR is monitoring closely with the aim of actually imposing
24
trade-related and other sanctions if they do not comply with its
recommendations. Additionally, some countries are not named in specific USTR
categories (due to their generally acceptable IP enforcement levels) but are still
mentioned in the report because they are perceived to suffer certain
enforcement-related deficiencies concerning particular aspects of the IP system.
This suggests that these countries offer what firms and policy-makers might
regard as an acceptable level of IP protection and enforcement but that this can
still be improved in some way. On the other hand, countries not named in the
report are assumed to present fewer patent enforcement-related concerns. To
quantify the information contained in the Special 301 Report we follow
Smarzynska (2004) who assigned different values depending on the list in which
a country is placed. However, we go one step further in order to positively
reward those countries which are not categorized, but are mentioned in the
report in addition to those not mentioned at all. Thus data are codified with
values ranging from a minimum of “1” (weak patent protection and
enforcement) to a maximum of “5” (strong) depending on whether a country is
listed in the USTR 301 report as follows: in “Section 306 Monitoring” (‘1’), in
the “Priority Watch List” (‘2’), in the “Watch List” (‘3’), negative IP
perceptions are indicated but the country is not named in an aforementioned list
(‘4’), the country is not named in any aforementioned list or it is mentioned as a
positive example of good practice in the area of patent protection and
enforcement (‘5’).7
25 5. International patent systems strength index: results and discussion
We now report on the new international patent systems strength index.
Following the recommendations of the OECD (2008) for composite index
construction, we focus on (i) the normalization of data, (ii) multivariate analysis
(in order to evaluate the index scales), (iii) weighting and aggregation of the
data, and (iv) linkages with other variables.
Because the data sources we employ use differing measurement scales,
we first normalized all the data using a standardization technique (z-scores) to
transform them into a single scale with a mean of zero (0) and a standard
deviation of one (1) (OECD, 2008).8 There were no missing values in the dataset since countries for which data were not available were omitted from our
calculations. To apply the multivariate tests, and in accordance with our
conceptual framework, we categorized and aggregated the data according to the
transaction cost construct they were used to proxy. This led to the derivation of
scales that captured the effect of each of the three transaction cost constructs.
Two multivariate analysis tests are commonly reported in the index scale
construction literature, namely Cronbach’s coefficient alpha and factor analysis
(OECD, 2008). The Cronbach’s alpha test was applied to the servicing costs,
property rights protection costs and monitoring costs constructs. Tests revealed
strong internal consistency for each of the three constructs, with all variables
scoring significantly higher or very close to the generally accepted 0.70
threshold (Hair, Anderson, Tatham & Black, 2009; Nunnally, 1978). The
26
Cronbach’s alpha score for the property rights protection construct is 0.92, with
a standard item alpha of 0.94. The monitoring cost construct also revealed an
extremely high internal consistency with a Cronbach’s alpha score of 0.87, and
a standard item alpha of 0.89. The Cronbach’s alpha test for the servicing cost
construct also exhibited an acceptable score of 0.77, and a standardized item
alpha of 0.82. Results of the Cronbach’s alpha test suggest that the variables
used to estimate the three constructs form reliable scales that are internally
consistent.
Factor analysis was then used to discern the relationship between the
different component variables of each of the constructs and to inform the
application of a weighting scheme to aggregate the variables into a single
numerical value for each construct. According to the OECD (2008, p. 89), a
weighting scheme derived from factor analysis “intervenes only to correct for
overlapping information between two or more correlated indicators, and is not a
measure of the theoretical importance of the associated indicator. If no
correlation between indicators is found, then weights cannot be estimated with
this method”. In other words, the weighting applied to construct the index does
not differentiate between the importance of each factor but instead represents
the highest possible variation in the indicators. Thus, “the composite
(index/construct) no longer depends upon the dimensionality of the dataset but
rather is based on the “statistical” dimensions of the data” (OECD, 2008, p. 89).
The ordering of the variables and the weighting of each of the constructs is
based on achieving high score variability (OECD, 2008). A more formal as well
27
methodological approach adopted in this study in relation to the construction of
the index and composite indices can be expressed as follows:
Index = ∑𝑛𝑖=1𝑋𝑖𝑤𝑖
where X1denotes the variables used in the factor analysis and wistands for the
respective weights (variances) that have resulted from the factor analysis. As
Table 2 shows, the communalities table for the monitoring cost construct
revealed that all four variables are equally represented in the calculation of an
aggregate index for this construct. The table of total variance explained
indicates the weighting to be used to calculate the monitoring cost construct
index, with the WEF IP protection variable receiving a weighting of 82%, the
IMD IPR variable 10%, the BSA piracy rates variable 5%, and the USTR
Special 301 Report variable 3%. Similarly, with regard to the property rights
protection construct, the communalities table revealed that all four variables
have a very good representation in the total scale of the construct. Findings
indicated that the CPI component of this construct should receive the highest
weight of 85%, with the WEF variable receiving 9%, the IMD judicial
independence variable 3% and the ICRG law and order variable receiving 3%.
Finally, the communalities table for the servicing costs construct also revealed
an equal representation of the two component variables in each calculation. The
ICRG bureaucracy variable should receive a weight of 85% and the IMD
bureaucracy variable 15%.
28
The weighting scheme suggested by factor analysis was applied to the
data for each of the variables within the servicing costs, property rights
protection costs and monitoring costs constructs. This allowed us to calculate
individual index scores that reflect the extent of transactions costs a firm is
likely to experience as it engages with the patent system of a country.
The same process was then followed to construct the overall composite
index of international patent systems strength. Again, this was done using
reliability and factor analyses to derive a composite index comprising the three
previously calculated constructs. The reliability analysis revealed a high
internal consistency for the composite index, receiving a Cronbach’s alpha
score of 0.89, and a standardized item alpha of 0.95. The factor analysis test and
the communalities table presented in Table 3 show that all factors have a very
good representation in the composite index, with each having a much higher
extraction score than 0.70.
---Table 3 goes about here---
Regarding the weighting scheme applied to the calculation of the
composite index, the table of total variance explained indicates that the
construct receiving the highest weight in the index is the property rights
protection costs construct (accounting for 91% of the final variance), followed
by the monitoring costs construct (6%), and the servicing costs construct (3%).
Average values of the new international patent systems strength index
for the period 1998 to 2011 are presented for 48 countries in Table 4, with
higher values (maximum of 10) indicating stronger patent systems. Table 5
29
above, the new index has been proven statistically to be reliable and internally
consistent. The mean score for all countries is 6.3 with a standard deviation of
2.1, suggesting that the average country measured by the composite index
offers slightly higher than the medium levels of patent system strength for the
14-year period in question. The lowest mean score is 2.9 for Venezuela (with a
minimum of 2.5 for 2009, 2010 and 2011, respectively) and the highest is 9.5
for Denmark and Finland (with maximum values of 9.9 for Finland in 2000 and
Denmark in 1999, respectively).
---Tables 4 and 5 go about here--- 5.1. The international patent systems strength index and GP indices compared
We now compare the scores of the new international patent systems strength
index with those of the GP indices for the year 2005. Our purpose is to
investigate if there are any differences between the levels of national patent
system strength as quantified here and book-law patent protection reported by
the GP index. If such differences are observable, this would elucidate the added
explanatory value of capturing enforcement-related issues associated with the
patent system of countries in the new index. In addition, we regress the new
index with data on national GDP per capita to reveal if it conforms to
theoretical expectations.
A simple regression between the international patent systems strength
index and the GP indices shows a positive and significant relationship. The
correlation coefficient between the two indices is relatively low at 0.58, with a
total variance explained (R2) value of 0.30. To better comprehend this
30
the two indices are not identical. Results indicate that they are different in terms
of their values and range. This is to be expected, both in terms of
conceptualization and theory, since the new international patent systems
strength index was devised to go beyond the measurement of the book-law
effects of the patent system as captured by the GP indices by quantifying
enforcement-related issues that arise from engaging with this system.
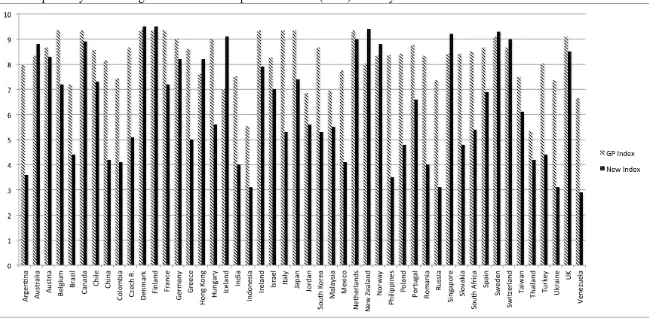
To investigate this relationship further, we compare diagrammatically
the new index with the GP index for 2005 by transforming the latter into a 0 to
10 scale, as seen in Figure 1.9 Substantial differences are observable between the scores of certain countries. A number of (mainly developing) countries,
such as Argentina, China, India and Indonesia are scored lower by the new
index than by the GP index. Whilst these countries have adapted their legal
systems to include provisions for stronger patent protection (as required by the
TRIPs agreement), and therefore score highly in the GP index, they remain
weak in enforcing these laws as reflected in the new index (USTR, 2011).
Additionally, the slightly lower values assigned by the new index to countries
that score highly in the GP indices (e.g. the Netherlands) reflect certain
enforcement-related deficiencies in countries with comparatively strong
book-law protection. In short, divergent performances across the two indices
highlight variable conditions in terms of the levels of book-law protection for
patentson offer in different countries and perceptions about how efficaciously
these rights are enforced in practice. This is an important finding, because it
31
demonstrates that scholars investigating the relationship between patent
strength and international business activity can use either the new index or the
GP indices depending on whether the focus of attention is on the book-law or
the enforcement aspect of the patent system of countries. Put another way,
researchers whose subject of enquiry includes the enforcement dimension will
be able to apply the new international patent systems strength index, whilst
those focusing on the role of the regulative book-law environment can continue
to use the GP indices.
---Figure 1 goes about here--- 5.2. The new index and GDP per capita
To investigate further the performance of certain countries in the new
composite index, and to reveal if it conforms to theoretical expectations, we
regressed the mean scores with the mean of national GDP per capita data for the
years 1998 to 2011. Prior research indicates that higher national GDP per capita
levels are closely associated with stronger patent protection levels (Gould &
Gruben, 1996; Park & Ginarte, 1997; Pryor, 2006; Thompson & Rushing,
1999). This is because as incomes rise so do consumer demand for higher
quality and more differentiated products on the one hand and the technological
capabilities of domestic producers on the other, putting pressure on national
governments to strengthen their IP system (Maskus, 2000). GDP per capita
figures (at current prices) were obtained from the United Nations Statistics
32
systems strength index.10 In line with theoretical expectations, a positive and statistically significant relationship was found between GDP per capita and the
new index scores (with a correlation coefficient of 0.69 and an R2 score of 0.58) (see Figure 2).11 Therefore, the new index makes theoretical sense when viewed in conjunction with prior work on the relationship between the economic
development of a country and patent protection levels.
---Figure 2 goes about here--- 6. Conclusions
It has long been recognized that a host country’s patent system has an important
effect on the strategies and decision-taking of multinational enterprises
(MNEs), not least because it shapes their ability to appropriate returns on their
investments in R&D and innovation (Ghauri & Rao, 2009, Maskus, 2000;
Teece, 2006). In the post-TRIPs era, the formal patent protection regimes of
countries have converged as governments have sought to improve and
harmonizebook-law protection levels to align them to international standards
and norms as part of their obligations as signatory States. However, problems
associated with the enforcement of book-law in practice means that MNEs
continue to experience difficulties in upholding their patent rights around the
world and countering the threat of illegal imitation and infringement (USTR,
2013; OECD, 2009). Hitherto, researchers investigating the relationship
10 With the exception of Taiwan (ROC), for which GDP per capita data were collected from the International Monetary Fund (2012) World Economic Outlook database.
11
33
between patent rights and the behaviour of economic actors have generally
employed the indices of Ginarte and Park (1997) and Park (2008) in empirical
work. However, these indices specifically measure the book-law conditions of a
country and not the enforcement dimensions of the patent system. Hence, the
main theoretical and empirical contributions of this study are threefold. First is
the development of a new index which extends the GP indices by capturing the
important role played by the enforcement dimension of a national patent system
and how this is perceived by managers. Second is the development of a
conceptual framework which identifies the costs experienced by firms as they
engage and interact with a national patent system. Our third contribution
concerns the application of a methodology which is fully transparent, following
established and reliable procedures recommended by the OECD (2008).
Several important implications for research and managerial practice arise from
these contributions.
6.1 Implications for research and policy-making
The new index of international patent systems strength reported here provides
up-to-date information for a good mix of developing and developed countries.
We expect it to be a useful tool for researchers investigating a range of
contemporary international business issues and a variety of different
macro-economic phenomena across a broad set of country types. Similarly, the index
should be helpful to empiricists (e.g. from international economic and
developmental organizations) who are looking to model and understand the
policy implications of macro-economic and institution-related phenomena from
34
expanded so that researchers can employ the new index in order to proxy for the
overall impact of the enforcementdimension of a national patent system, should
theory necessitate it. At the same time, the new index can be used alongside the
GP indices if differential effects of both the book-law and enforcement aspects
of national patent systems are under investigation or are anticipated. Moreover,
because we follow standard OECD (2008) guidelines for the construction of
composite indicators, the new index can be replicated and extended readily,
updated regularly, and applied in future research in combination with datasets
constructed using the same or similar methodological approaches, should this
be required.
6.2 Managerial relevance
Our study has implications for the management of the firm, especially in an
international context. Firstly, we provide a framework which illustrates and
highlights key aspects of patent enforcement mechanisms that managers should
take into account when evaluating the patent system of countries. It is not
sufficient for an assessment of the legal framework of host countries to be
restricted to the state of book-law protection. This is because there is a clear
contrast between levels of book-law protection on the one hand and the
enforcement system (as it is perceived by managers)on the other, as the new
index reveals for the majority of countries covered. In other words, when legal
protection for protectable technology is readily available, adequate enforcement
of these rights might not be. Secondly, and it follows, rather than simply
responding to infringement issues as they arise, managers should be cognizant
35
as they formulate strategies and take decisions when developing business
activities abroad. Whilst it is relatively straightforward to establish the state of
book-law protection, since this is codified and reported by most countries, it is
much harder to determine a priori how well government agencies enforce these
laws in practice, especially for inexperienced or under-resourced firms.
Managers will be able to use the new index to identify those countries where
the enforcement aspect of the patent system is liable to be problematic or to
consider numerical values that may confirm or reject their preconceptions.
Although such knowledge can be acquired using in-house or external legal
expertise, it is nevertheless important that product and area managers also
understand the implications arising from weak patent systems in countries,
since this is likely to determine their ability to appropriate returns on market
entry and development and, it follows, influence the costs of international
expansion. In countries where patent systems are weaker, managers are likely to
experience greater transaction costs as they engage with enforcement issues.
For example, for R&D, technology and licensing managers, this may arise from
the need to introduce or make more stringent those security systems, procedures
and organizational structures implemented to mitigate the threat of technology
leakage to rivals. For product and supply chain managers this may arise from
the greater resources allocated to, and expended on, engaging with local
organizations such as the police, customs officers, IP-specialist firms and other
patent enforcement-related agencies (Hopkins, Kontnik & Turngage, 2003;
Staake & Fleisch, 2010). Following the argumentation of Peng et al. (2009),
36
alongside an understanding of both industry-specific competitive forces and the
resources and managerial capabilities of their firm when designing and
implementing an international expansion and development strategy. The new
international patent systems strength index provides valuable information on
perceptions about variable patent enforcement levels across countries.
6.3 Limitations and future research
The limitations of our study provide pointers for future research opportunities.
First, to design the new index, we incorporate those enforcement aspects of the
patent system that have become increasingly relevant in the post-TRIPS era. It
is foreseeable that new patent enforcement-related treaties will be negotiated
and concluded by countries. These may bring to the fore additional and related
factors and concerns which are not addressed by the new index. Subject to data
availability, our conceptual framework and theoretical approach can be used by
future researchers to identify new variables and data to develop proxies for such
additional factors under the relevant transaction costs construct depicted in
Table 1. This is because no matter how many aspects of the patent system are
measured, their theorized effect will continue to impact upon the three types of
transaction costs we consider in the new index. If the new index is to be
extended, the fundamental structure underpinning its measurement remains
unchanged. Secondly, and depending on data availability, a comparable
methodology to ours could be followed to develop patent-related indices for
specific industries or sectors. Finally, it would be interesting to revisit studies
37
by incorporating the new index reported here to see if enforcement-related
38 7. Acknowledgements
We wish to thank the editor and anonymous reviewers for their helpful
suggestions and advice, and also the reviewers and participants of the Academy
of International Business (AIB) Annual Conference (2012), and the European
Policy for Intellectual Property (EPIP) Annual Conference (2010) for the
constructive comments we received on earlier versions of this paper. We are
also grateful to Professors John Dunning, Peter Buckley, Farok Contractor, Ulf
Holm, Keith Maskus, Frank McDonald and Kevin Reilly for their feedback,
39 8. References
Allred, B. B., & Park, W. G. (2007). Patent rights and innovative activity:
Evidence from national and firm-level data. Journal of International
Business Studies, 38: 878-900.
Anderson, E., & Gatignon, H. (1986). Modes of foreign entry: A transaction
cost analysis and propositions. Journal of International Business Studies,
17: 1-26.
Archibugi, D., Denni, M., & Filippetti, A. (2009). The technological
capabilities of nations: The state of the art of synthetic indicators.
Technology Forecasting and Social Change, 76: 917-931.
Arora, A. (2009). Intellectual property rights and the international transfer of
technology: setting out an agenda for empirical research in developing
countries. In World Intellectual Property Organization (WIPO) (Eds.), The
economics of intellectual property: Suggestions for further research in
developing countries and countries with economies in transition (pp.
41-58). Geneva, Switzerland: WIPO publication No 1012(E).
Bosworth, D. L. (1980). The transfer of US technology abroad. Research
Policy, 9: 378-388.
Bryce, J., & Rutter, J. (2005). Fake nation? A study into an everyday crime.
Retrieved 03 August 2012 from
http://www.allianceagainstiptheft.co.uk/downloads/pdf/Fake-Nation.pdf.
Business Software Alliance (BSA) (Various years). Global software piracy
40
http://portal.bsa.org/globalpiracy2011/downloads/study_pdf/2011_BSA_Pir
acy_Study-Standard.pdf.
Chaudhry, P. E., & Walsh, M. G. (1995). Intellectual property rights: changing
levels of protection under GATT, NAFTA and the EU. Columbia Journal
of World Business, 30: 80-91.
Clegg, L. J., & Cross, A. R. (2000). Affiliate and non-affiliate intellectual
property transactions in international business: An empirical overview of
the UK and the USA. International Business Review, 9: 407-430.
Cockburn, I. M. (2009). Intellectual property rights and pharmaceuticals:
Challenges and opportunities for economic research. In World Intellectual
Property Organization (WIPO) (Eds.), The economics of intellectual
property: Suggestions for further research in developing countries and
countries with economies in transition (pp. 156-173). Geneva, Switzerland:
WIPO publication No. 1012(E).
Demirbag, M., Glaister, K. W., & Tatoglu, E. (2007). Institutional and
transaction cost influences on MNEs’ ownership strategies of their
affiliates: Evidence from an emerging market. Journal of World Business,
42: 418-434.
Fagerberg, J., Srholec, M., & Knell, M. (2007). The competitiveness of
nations: why some countries prosper while others fall behind. World
Development, 35: 1595-1620.
Ferrantino, M. J. (1993). The effect of intellectual property rights on
international trade and investment. Weltwirtschaftliches archiv - Review of
41
Fink, C., & Maskus, K. (2005). Intellectual property development: Lessons
from recent economic research. New York: World Bank and Oxford
University Press.
Gadbaw, R.M., & Richards, T. (1988). Intellectual property rights: Global
consensus, global conflict? Boulder: Westview Press.
Ghauri, P., & Rao, P. M. (2009). Intellectual property, pharmaceutical MNEs
and the developing world. Journal of World Business, 44: 206-215.
Ginarte, J. C., & Park, W. (1997). Determinants of patent rights: A
cross-national study. Research Policy, 26: 283-301.
Gould, D. M., & Gruben, W. C. (1996). The role of intellectual property rights
in economic growth. Journal of Development Economics, 48: 323-350.
Gowers, A. (2006). Gowers review of intellectual property. Retrieved 03
April 2013 from
http://www.official-documents.gov.uk/document/other/0118404830/0118404830.pdf.
Granstrand, O. (1999). The economics and management of intellectual
property: towards intellectual capitalism. Cheltenham: Edward Elgar.
Hagedoorn, J., Cloodt, D., & Van Kranenburg, H. (2005). Intellectual property
rights and the governance of international R&D partnerships. Journal of
International Business Studies, 36: 175-186.
Hair, J. F., Anderson, R. E., Tatham, R. L., & Black, W. C. (2009).
Multivariate Data Analysis. Englewood Cliffs NJ: Prentice Hall.
Hargreaves, I. (2011). Digital opportunity: a review of intellectual property
and growth. Retrieved 03 April 2013 from
42
Henisz, W. J. (2003). The power of the Buckley and Casson thesis: The ability
to manage institutional idiosyncrasies. Journal of International Business
Studies, 34: 173-184.
Hillman, A., & Keim, G. (1995). International variation in the
business-government interface: institutional and organizational considerations.
Academy of Management Review, 20: 193-214.
Hopkins, D. M., Kontnik, L. T., & Turnage, M. T. (2003). Counterfeiting
exposed: protecting your brand and customers. Hoboken New Jersey: John
Wiley & Sons.
Hung, C. L. (2003). The business of product counterfeiting in China and the
post-WTO membership environment. Asia Pacific Business Review, 10:
58-77.
Intellectual Property Office (IPO) (2011). The UK’s international strategy for
intellectual property. Retrieved 03 April 2013 from
http://www.ipo.gov.uk/ipresponse-international.pdf.
International Institute for Management Development (IMD) (Various years).
World competitiveness yearbook. Lausanne: International Institute for
Management Development.
International Monetary Fund (IMF) (2012). World Economic Outlook
database. Retrieved 03 April 2013 from
http://www.imf.org/external/pubs/ft/weo/2012/02/weodata/index.aspx.
Ivus, O. (2010). Do stronger patent rights raise high-tech exports to the
43
Jain, S. J. (2002). Intellectual property rights in international business. In
Kotabe, M. & Aulakh, P. S. (Eds.) Emerging issues in international
business research (pp. 37-64). Cheltenham: Edward Elgar.
Jarzabkowski, P. (2008). Shaping strategy as a structuration process. Academy
of Management Journal, 51: 621-650.
Kafouros, M. I., & Forsans, N. (2012). The role of open innovation in
emerging economies: Do companies profit from the scientific knowledge of
others? Journal of World Business, 47: 362-370.
Keupp, M. M., Beckenbauer, A., & Gassmann, O. (2010). Enforcing
intellectual property rights in weak appropriability regimes: The case of de
facto protection strategies in China. Management International Review, 50:
109-130.
Khoury, T. A., & Peng, M. W. (2011). Does institutional reform of intellectual
property rights lead to more inbound FDI in developing countries?
Evidence from Latin America and the Caribbean. Journal of World
Business, 46: 447-345.
Kondo, E. K. (1995). The effects of patent protection on foreign direct
investment. Journal of World Trade, 29: 97-122.
Kostova, T. (1999). Transnational transfer of strategic organizational
practices: a contextual perspective. Academy of Management Review, 24:
308-324.
Lee, S. H., & Yoo, B. (2009). A review of the determinants of counterfeiting
and piracy and the proposition for future research. The Korean Journal of