Blasts from the past: 2. The search for Celtic Sea oil Background
“Blasts from the past” is the section of Teaching Earth Sciences where some of the teaching ideas and activities, originally produced for early publications of ESTA and the Association of Teachers of
Geology (the precursor to ESTA), are re-published. Teaching ideas and activities have been updated and revised before re-publication in the magazine. Copies of earlier publications of ESTA and the Association of Teachers may be accessed in the archive section of the ESTA website, although PDFs of TES 26.3 onwards may be downloaded from the website.
The search for Celtic Sea Oil
This simulation exercise for sixth forms was produced by Mike Merchant (Merchant, 1978). Following the discovery of hydrocarbons in Mesozoic basins in the North Sea, much exploration was carried out in the Southern Irish Sea (Celtic Sea) in the early and mid-1970s. Mike Merchant describes an exercise based on the steps taken in that exploration programme. The original map and diagrams for this exercise have been revised and costs, based on 1977 exploration costs originally provided by B. Holmes (Shell Exploration and Production) have been updated.
The game aims to show some of the techniques used by the oil companies in their search for oil and gas. The technical and economic problems faced by companies, as well as the geological methods employed in the search for oil are illustrated by the game. The main aim is to show that oil exploration is a unique combination of skill, luck and professional judgment. This exercise should help AS and A2 students understand some of the geological principles and methods used by oil companies, and how these decisions are evaluated in the light of economic and geographical factors.
Introduction
Each student represents an oil exploration company engaged in locating oil off the coast of Wales., Using the map, data sheet and section cards and following the instructions below, the aim is to bid for, and locate oil reservoirs, and exploit them economically. The most successful company will be that which has made the greatest profit (if any!).
Procedure
Data Sheet
Typical 2013 Costs
Exploration costs £
Seismic survey per km, Land 5,600
Seismic survey per km, Sea 800
Daily rate for semi-submersible rig 58,000
Drilling per month on land 1,200,000
Drilling per month at sea 4,000,000
Capital cost of drilling rig
Jack-up (<100m water depth)
Semi-submersible (100-500m water depth)
72,000,000 120,000,000
Engineering costs
Production platform installed 720,000,000
Production drilling (30 wells) 400,000,000
Pipeline:
0.75m pipeline in 30 – 45m water per mile 1.00m pipeline in 150m water per mile
4,000,000 4,000,000
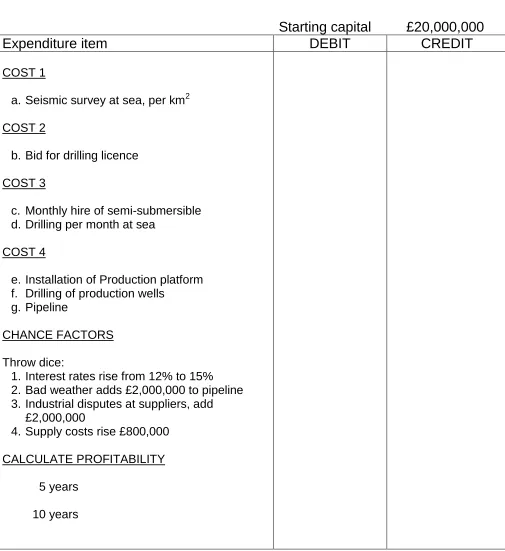
Cost Account Sheet
Starting capital £20,000,000
Expenditure item
DEBIT
CREDIT
COST 1
a. Seismic survey at sea, per km
2COST 2
b. Bid for drilling licence
COST 3
c. Monthly hire of semi-submersible
d. Drilling per month at sea
COST 4
e. Installation of Production platform
f. Drilling of production wells
g. Pipeline
CHANCE FACTORS
Throw dice:
1. Interest rates rise from 12% to 15%
2. Bad weather adds £2,000,000 to pipeline
3. Industrial disputes at suppliers, add
£2,000,000
4. Supply costs rise £800,000
CALCULATE PROFITABILITY
5 years
10 years
[image:4.595.42.547.85.636.2]Instructions
1. The first step in the exploration programme is the bidding for exploration blocks by the oil companies. The most sought after blocks will be those with the most promising geological structures, and the most profitable to develop.
2. Before a company bids, it will have to determine the sea floor geology of the area. This is done by seismic surveys, and by sampling.
COST 1: Find out the cost of a marine seismic survey and deduct this from your initial capital.
3. The relative value of the blocks may be determined quantitatively by allocating a weighting value to each square as shown in the table below:
Category Description Weighting
value Geological potential of the block Tertiary Basin 10
Mesozoic Anticline 9 Faulted Anticline 8 Faulted Syncline 6
Graben 5
Palaeozoic 2
Basement 0
Distance from a base at Milford Haven 0 - 20 km 5 21 - 40 km 4 41 - 60 km 3 61 - 80 km 2 81 - 100 km 1 > 100 km 0 Depth of water (use an Atlas to find depth) 0 - 50 m 5 51 - 100 m 4 101 - 150 m 3 151 - 200 m 2 > 200 m 1
4. Add the values of each block. The highest weightings represent the most promising areas, both economically and geologically. Choose the three most promising blocks.
5. Write your bid for your first choice block on a piece of paper and pass it to Department of Energy and Climate Change (DECC) Official (your teacher). Bids start at £2,000,000; the highest bid for a block ensures drilling rights for that company. Continue bidding until each company has been allocated a block.
COST 2: Enter cost of drilling licence from your capital, on the cost sheet.
6. Drilling of exploration well: You now have to sink an exploratory well, based on the results of the seismic survey, to determine the lithology and sedimentology of your sequence.
COST 3: Enter cost of drilling exploration well in the cost sheet (i.e. monthly hire of rig + cost of drilling for one month.)
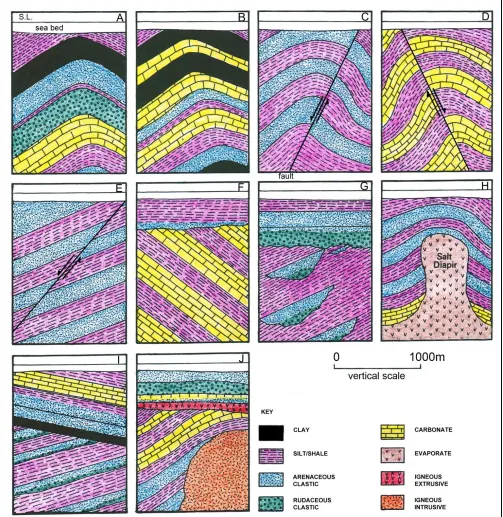
7. To "discover" the geological structure under your block, take a 'section card'. This shows a geological section showing lithology and structure (not necessarily that of the Celtic Sea).
Only one well in five is found to have oil or gas in commercial quantities. If you have drawn a card showing an oil bearing structure, it may still be dry!
9. To decide if your well is dry or not, throw a dice. Numbers 1-5, the well is dry, a 6 indicates oil.
10. If you have found oil, you must now construct a production platform, and lay a pipeline to the terminal at Milford Haven.
COST 4 Calculate the cost of installing a production platform, drilling production wells and constructing a pipeline in your block. Enter this in your cost sheet.
11. If your well is dry, begin the process again in your second choice block.
12. The profit you make will depend on the amount of recoverable oil in your trap. This will depend mainly on geological structure and lithology. Use the table below to calculate your annual revenue.
Structure Cost per annum
Anticlinal Sandstone £2000 million Anticlinal Limestone £1600 million Faulted Anticline £1200 million Fault trap £800 million Salt Dome £400 million Unconformity trap £200 million
n.b. These figures are speculative - no reliable information concerning these revenues is available.
13. When calculating profitability assume an average life of 5 years for your field.
References
Merchant, M. (1978) The search for Celtic Sea Oil. Geology Teaching, 3 (2), pp 83-86.
http://www.bp.com/liveassets/bp_internet/bp_australia/bp_education_australia/STAGING/local_ assets/downloads_pdfs/Module3_Oil_and_Gas_Exploration_and_Production/bp_module03_int. pdf [Accessed December 2013]
http://www.earthlearningidea.com/PDF/Trapped_why_cant_oil_gas_escape.pdf [Accessed December 2013]
https://www.gov.uk/government/uploads/system/uploads/attachment_data/file/182628/potential-future-exploration-uk-irish-sea.pdf [Accessed December 2013]
Hazel Mather University of Derby [email protected]
Maggie Williams
Department of Earth, Ocean and Ecological Sciences, School of Environmental Sciences, Liverpool, L69 3GP
Peter Williams
Department of Earth, Ocean and Ecological Sciences, School of Environmental Sciences, Liverpool, L69 3GP