Genomic analysis of stress, aggression and
boldness in rainbow trout
Thesis submitted in accordance with the requirements of the
University of Liverpool for the degree of Doctor of Philosophy
by Angela Sims
Abstract
Acknowledgements
I would like to thank my many supervisors for their valuable contributions, which have allowed me to mould and shape seeds of ideas into full grown chapters. In particular, I thank Phill Watts for his unending - and catching - enthusiasm. I thank Lynne Sneddon for sharing her behavioural and ichthyological knowledge with me. I thank Tom for his levelled guidance and also for conducting the radioimmunoassay for cortisol. Finally, thanks to Steve Paterson for his advice with statistics. I am grateful to The Leverhulme trust for funding the project.
I would like to express thanks to all the people who helped in the aquarium and in the lab. Specifically, to Jack Thomson for a), sharing his trout samples and behavioural data for work in Chapter 2 b) teaching me trout husbandry c) helping me dissect trout d) helping me with RNA extractions and RT-PCR. In addition, I also thank Gregor Govan for his work in trout husbandry. In addition, I thank Kieran Pounder for helping me fathom the protocols for the creation of cDNA libraries for 454 sequencing. I am grateful to Chris Lowe with all his help with the bioinformatics for Chapter 4. I am now a little less bioinformatic-illiterate. I thank Laura Gordon for helping me with PCRs. Thanks to Ewan Harney for his help with R and for his help with statistics in general.
Thank you to my proof-readers Steve Parratt and Louise Soanes. Also, thanks to Hélène Collin for her valuable advice in early drafts of Chapter 4.
Thanks also to:
Steve, Ewan, Louise and Leni for their friendship and support during both fun and difficult times.
My “massive but nice” family for their hustle and bustle, which has always helped me stay grounded.
David for his patience, support and pride.
Finally, to the aquarium:
Declaration of originality
I declare that all the work presented in this thesis is my own original research with the following acknowledgements:
Chapter 2: The rainbow trout samples used to assess boldness and stress responsiveness and the associated behavioural data were collected by Jack Thomson and are also presented in Thomson et al. (2011).
Abbreviations
ACTH Adrenocorticotrophic hormone
AVP Arginine vasopressin
AVT Arginine vasotocin
CRH Corticotrophic releasing hormone
EPD Ependymin
EST Expressed sequence tag
GAPDH Glyceraldehyde-3-phosphate dehydrogenase
GR Glucocorticoid receptor
ID Identity disequilibrium
LD Linkage disequilibrium
HFC Heterozygosity-fitness correlation
HHC Heterozygosity-heterozygosity correlation
HPA Hypothalamic-pituitary-adrenal axis
HPI Hypothalamic-pituitary-interrenal axis
HR High responding line
LR Low responding line
MR Mineralocorticoid receptor
P450SCC Cytochrome P450 side-chain cleavage enzyme
PHt Proportion of heterozygous loci
QTL Quantitative trait loci
StAR Steroidogenic acute regulatory protein
US Unselected line
V1a Vasotocin receptor 1a
VACM-1 Vasopressin-activated calcium-mobilizing receptor
Contents
Abstract ... 3
Acknowledgements ... 5
Declaration of originality ... 7
Abbreviations ... 9
Chapter 1 General Introduction... 15
1.1 Genomics of behaviour ... 15
1.2 Animal behaviour ... 18
1.2.1 The stress response... 19
1.2.2 Aggressive behaviour ... 21
1.2.3 Bold-shy continuum ... 23
1.3 The rainbow trout model ... 25
1.4 Aims ... 28
1.5 Chapter outlines ... 29
Chapter 2 Is genome-wide heterozygosity related to the evolutionarily important traits aggression, boldness and stress responsiveness? ... 31
2.1 Introduction ... 31
2.1.1 Heterozygosity-fitness-correlations ... 31
2.1.2 Behavioural traits ... 33
2.2 Methods... 36
2.2.1 Rainbow trout husbandry ... 36
2.2.2 Behavioural tests ... 37
2.2.3 Genotyping ... 38
2.2.4 Data analyses ... 39
2.3 Results ... 40
2.3.1 Behaviour ... 40
2.3.2 Heterozygosity-behaviour-correlations ... 45
2.3.3 Causes of HFCs ... 48
2.4 Discussion ... 49
2.4.1 The relationship between heterozygosity and aggression ... 49
2.4.2 Stress, boldness and heterozygosity ... 51
2.4.3 Genetic background of behavioural syndromes ... 52
Chapter 3 The genomic consequences of selective breeding for divergent responses to stress.
... 55
3.1 Introduction ... 55
3.1.1 Genome scans for selection ... 55
3.1.2 Genome scans for candidate genes ... 56
3.1.3 Is the genetic influence on stress responsiveness complex? ... 58
3.2.1 Rainbow trout husbandry ... 59
3.2.2 Genotyping ... 60
3.2.3 Statistical analyses ... 61
3.2.4 Verification of outliers ... 62
3.3 Results ... 63
3.3.1 Genome-wide selection ... 65
3.3.2 A link with function ... 65
3.3.3 Verification of outliers ... 68
3.4 Discussion ... 70
3.4.1 Success of the genome scan ... 70
3.4.2 Candidate regions ... 72
3.4.3 Complexity of the stress response ... 74
3.4.4 Conclusions ... 75
Chapter 4 Behavioural genomics: de novo transcriptome sequencing of aggressive behaviour ... 77
4.1 Introduction ... 77
4.1.1 Genetics of aggression ... 77
4.1.2 Transcriptome profiling ... 78
4.2 Methods ... 80
4.2.1 Rainbow trout husbandry ... 80
4.2.2 Behavioural tests ... 81
4.2.3 cDNA Library preparation ... 82
4.2.4 Differential gene expression ... 82
4.2.5 Gene Ontology of aggression ... 83
4.3 Results ... 84
4.3.1 Behaviour ... 84
4.3.2 Gene expression and candidate genes ... 87
4.3.3 Gene Ontology of aggression ... 93
4.4.1 Old and new candidates for aggressive behaviour ... 94
4.4.2 Genes in less aggressive trout ... 96
4.4.3 Gene Ontology of aggression ... 97
4.4.4 Implications for behavioural syndromes ... 97
4.4.6 Genomic resources ... 98
4.4.5 Conclusions ... 99
Chapter 5 How do genes involved in the hypothalamic-pituitary-interrenal axis relate to winning and losing in rainbow trout? ... 101
5.1 Introduction ... 101
5.2 Methods... 103
5.2.1 Husbandry ... 103
5.2.2 Behavioural tests ... 104
5.2.3 Gene expression ... 105
5.2.4 Data analysis ... 105
5.3 Results ... 106
5.4 Discussion ... 112
5.4.1 Vasotocin receptor 1a... 112
5.4.2 Ependymin ... 113
5.4.3 Mineralocorticoid and glucocorticoid receptors ... 113
5.4.4 Conclusions ... 114
Chapter 6 How do genes involved in the hypothalamic-pituitary-interrenal axis relate the response to an acute stressor? ... 117
6.1 Introduction ... 117
6.1.1 Stress physiology ... 117
6.1.2 Genes in the hypothalamic-pituitary-interrenal axis ... 118
6.2 Methods... 121
6.2.1 Husbandry ... 121
6.2.2 Gene expression ... 123
6.2.3 Data analysis ... 123
6.3 Results ... 123
6.3.1 Cortisol response to an acute stressor ... 126
6.3.2 Gene expression ... 126
6.4 Discussion ... 131
6.4.2 Genes in the brain ... 133
6.4.3 Genes in the kidney and liver ... 135
6.4.4 Conclusions ... 135
Chapter 7 General Discussion ... 137
7.1 Genomics to identify behavioural candidate genes ... 137
7.2 Genomic control of behaviour is complex ... 139
7.3 Genomics of behavioural syndromes ... 141
7.4 Wider implications ... 142
7.5 Conclusions ... 143
Appendix 1 ... 145
Chapter 1 General Introduction
Behavioural phenotypes are under many influences from the external and internal environments. Animals can alter their behaviour depending on previous experiences (Bendesky & Bargmann 2011). Moreover, behaviour shows plasticity in the face of differing environmental cues (Boake et al. 2002), such as a change in risk-taking behaviour in the presence and absence of a predator in rainbow trout, Oncorhynchus mykiss (Vilhunen et al. 2008; Thomson et al. 2012). Until recently, these non-genetic influences on behaviour led to a belief that the genetic component of behaviour was minimal, as described by the “phenotypic gambit” (Boake et al. 2002). Gradually, evidence demonstrating the influences of genes upon behaviour has mounted in a wide range of studies from family resemblance to gene knockouts to microarrays (Section 1.1). Now, the major challenge in behavioural ecology is to investigate the genomic architecture of behaviour, including the numbers, locations and effects of all genes associated with behaviour, with the aim of understanding how complex phenotypes are influenced by genetic variation intraspecifically.
1.1 Genomics of behaviour
(Greenspan 1997). Indeed, mammalian studies have shown that behaviour is the result of interactions among gene products in networks (Kinnally et al. 2010). For example in Rhesus macaques, Macaca mulatta, serotonin modulates response to an intruder, which is in turn modulated by monoamine oxidase A (Kinnally et al. 2010). Interactions among genes may occur among genotypes, where behaviour is influenced by heterozygous effects, such as dominance, or additive effects of alleles. Moreover, more dynamic gene interactions may occur between transcripts (Mackay 2001). The challenge for the study of behavioural genetics is to identify this genomic complexity to explain phenotypic variation.
The expression of almost all behaviours is often the result of the effects of many genes. It is thus important to study the genomic architecture of behaviour, including the number and location of loci, dominance effects of multiple alleles at a locus, additive effects of alleles (Vallejo et al. 2009), pleiotropy (where a gene has effects on many traits) or epistasis (where the effect of a gene is modulated by at least one other gene). Many types of study can be used to determine the numbers and locations of genes in complex traits. For example, assessing the level of variation in genome-wide heterozygosity may indicate local effects of single genes or general effects due to inbreeding. Heterozygosity is often related to fitness traits due to a reduction in the expression of deleterious recessive alleles (dominance) or heterozygote advantage (overdominance) (Slate et al. 2004). When fitness-related traits are correlated with heterozygosity, this relationship may be caused by two effects when neutral markers are used (Hansson & Westerberg 2002). The first is the local effect hypothesis, where neutral loci are in linkage disequilibrium (LD) with one or more fitness genes. The second is the general effect hypothesis, where the level of heterozygosity across a large set of neutral markers is generally correlated across loci within an individual’s genome (ID), where the heterozygosity at neutral markers is thought to represent genome-wide heterozygosity due to inbreeding (Weir & Cockerham 1973; Szulkin et al. 2010) (for more details, see Chapter 2). For example, Tiira et al. (2003) showed that aggressive behaviour in landlocked salmon, Salmo salar, was affected by genome-wide heterozygosity (estimated at 11 neutral markers), indicating that the effects of heterozygosity are associated with aggressive behaviour. However, single locus effects were detected in dominant brown trout, Salmo trutta, where two genomic regions showed a particular genetic influence (Tiira et al. 2006). Moreover, this approach may indicate how genotypic effects influence behaviour. Thus, these effects may affect a phenotype associated with heterozygosity.
Drew et al. 2007) and this may increase understanding of the networks involved in behavioural control. QTLs are a set of loci that attempt to explain genetic control of a quantitative trait that is under complex control, such as behaviour. Identifying QTLs typically involves breeding animals that exhibit a phenotypic trait. By back-crossing these individuals the location of polymorphic neutral markers may be statistically mapped (Jones et al. 1997). For example, the control of defensive behaviour in the honeybee, Apis melifera, was found to be associated with 13 genomic regions (Lobo et al. 2003) using this method. However, this approach may be time-consuming due to the extensive breeding programs involved. Genome scans use neutral molecular markers to detect genetic differentiation among populations to identify genome regions under natural selection, which can be used to infer adaptation to various situations (Nielsen 2005; Oleksyk et al. 2010). This may offer an alternative to QTL mapping for identifying candidate genes. By detecting genetic differentiation among groups or populations of animals, it may be possible to identify regions of the genome as candidates for a particular trait (Chapter 3). For example, approximately 40 physiologically important genes were under selection between groups of three-spined stickleback, Gasterosteus aculeatus, adapted to differing environmental salinity (Shimada et al. 2011). Selection for different types of behaviour among populations thus presents an opportunity to identify regions associated with the genetic basis of behavioural traits – a method of identifying novel candidate genes (Kayser et al. 2003; Kane & Rieseberg 2007).
may show pleiotropic or epistatic effects. Microarrays have cDNA probes or oligonucleotides fixed to a slide to which cDNA from samples bind, which can be visualised by fluorescence (Hoheisel 1997). This means that only known sequences can be probed, making it difficult to study gene expression of non-model organisms using microarrays. Next generation sequencing technology (NGS), such as the GS FLX 454 sequencer, makes it possible to sequence all transcripts in a sample irrespective of whether sequences are known or not (Wicker et al. 2006) and this could allow a more complete view of the genetic control of behaviour.
Next generation sequencing allows the de novo identification of novel candidate sequences without a priori knowledge of function (Wilhelm & Landry 2009). This has led to enterprising studies that discover candidate genes associated with complex phenotypic traits, such as the ecophysiological response to salinity (Lowe et al. 2011), birdsong (Lovell et al. 2008) and dominance (Sneddon et al. 2011). In addition, because NGS can sequence all the mRNA from a sample, not only can known genes be associated with a novel phenotype, but previously unknown genes can be sequenced, which is particularly important for non-model organisms (Hudson 2008) and has been used to generate sequence data for many non-model organisms. Moreover, the sequencing of transcriptomes may allow the identification of many genes with interacting effects in a phenotype and allow mapping of networks of genes and their interactions by using changes in Gene Ontology – a system of categorising genes according to their function (Liinamo et al. 2007). NGS could be a powerful tool with which to tackle questions in behavioural ecology. However, examples of the technology’s use in this way are rare and limited to invertebrates (Toth et al. 2007). Genomic study of behaviour is important to reveal the complex associations between genes and behaviour.
1.2 Animal behaviour
(Huntingford 1976; Drent et al. 2003; Sneddon 2003; Sinn et al. 2006; Beausoleil et al. 2008; Evans et al. 2010). Specifically, in sticklebacks, Gasterosteus aculeatus, that are aggressive in the context of intraspecific contests over territories also show risk-taking behaviour in the presence of a predator (Huntingford 1976). Whilst the level of aggression varies between contexts, some individuals are consistently more aggressive than others and this suggests a lack of behavioural plasticity (Conrad et al. 2011).
A specific example of behavioural syndromes is stress coping styles (Koolhaas et al. 1999; Koolhaas et al. 2007), which describes how an individual copes with an external stressor. The coping styles are usually distributed bimodally and the two extremes are termed proactive and reactive. These names describe the behavioural types that encompass the suite of correlated behavioural phenotypes, including aggressiveness, stress coping and routine formation. In rats, stress coping styles were determined by their reaction to a shock prod. Aggressive rats exhibited proactive burying of the prod and less-aggressive exhibited reactive avoidance of the prod (Benus et al. 1990). Further study also showed that aggressive males formed routines more easily (Koolhaas et al. 1999). There is evidence for coping styles in many vertebrates (Koolhaas et al. 2007), including in salmonids (Øverli et al. 2004; Øverli 2007). For example, Øverli et al. (2002b) showed that rainbow trout, Oncorhynchus mykiss, that resumed feeding sooner showed less activity in response to a stressor. Moreover, lines of rainbow trout bred for divergent plasma cortisol responses to stress (Pottinger et al. 1992; Pottinger & Carrick 1999) show behavioural differences in levels of aggression (Pottinger & Carrick 2001; Øverli et al. 2002b). Three traits that are often associated are aggression, boldness and stress responsiveness and it is useful to study these both together and separately in order to establish whether genetic correlations exist.
1.2.1 The stress response
termed allostatic load. For example, chronic stress can cause impaired reproduction (Campbell et al. 1992), growth (Pickering 1990; Pottinger 2006) or immunocompetency (de Kloet et al. 2005). These effects are seen in wild populations where chronic stress may impact upon individual fitness due to environmental challenges. Similarly, deleterious effects are also common in domesticated animals, where stressors may arise from husbandry processes due to, for example, crowding or handling (Ellis et al. 2012) and this may impact upon welfare or economic return. For example, the impact of stress upon reproduction, growth and immunocompetency may affect number or quality of the animals or may leave livestock more susceptible to disease.
The neuroendocrine stress response is primarily controlled by the hypothalamic-pituitary-interrenal (HPI) axis (Wendelaar-Bonga 1997) (hypothalamic-pituitary-adrenal, HPA, in mammals), which regulates hydromineral balance and energy metabolism, along with the hypothalamic-sympathetic-chromaffin axis (HSC), which, via catecholamines, has a role in oxygen transport. Once a stressor is perceived, the HPI/HPA commences with the hypothalamus releasing corticotrophin-releasing hormone (CRH), which increases serotonin, dopamine (Øverli et al. 2005) and arginine vasotocin (AVT) (Gilchriest et al. 2001) in the brain. These substances stimulate the release of adrenocorticotrophic hormone (ACTH) from the anterior pituitary (Mommsen et al. 1999) into the blood stream where ACTH stimulates the interrenal cells (adrenal gland in mammals) to release glucocorticoids into the bloodstream. Elevated levels of glucocorticoids, specifically cortisol in teleost fish and corticosterone in mammals and birds, act on the liver to facilitate the release of glucose, via gluconeogenesis, into the bloodstream. Glucocorticoids also regulate their own release by negative feedback (Wendelaar-Bonga 1997).
expression profiling on a large scale that is associated with a range of stressors, for example, cold stress in carp, Cyprinus carpio (Gracey et al. 2004) and handling stress in rainbow trout (Krasnov et al. 2005).
1.2.2 Aggressive behaviour
Animal interactions can result in mutually beneficial outcomes, which is termed cooperation, or in one individual receiving benefit at the cost of another, termed conflict. Where resources are limited, conflict arises to decide which individual obtains resources, such as food. Conflict over resources is manifest in avoidance, manipulation and physical coercion, the latter is also called aggression. Aggression differs from other forms of conflict due to deliberate infliction of injury via physical threat or attack, whilst other forms of conflict result in gaining resources and removal of a competitor without intent of injury. Aggression encompasses both physical display and the internal physiological and emotional states that accompany attack, which determine intent (reviewed in Huntingford & Turner (1987)) and is used by conspecifics to engage in physical conflict. Aggression can be adaptive by increasing fitness. For example, the protection of offspring leads to reproductive success, whereas obtaining a territory may mean increased survival (through access to food) or increased reproduction (through access to mates) (Maxson & Canastar 2005). However, aggression may also be maladaptive by increasing of injury or death, which impairs reproductive potential and survival. Moreover, individuals with a tendency for aggressive behaviour may also direct their aggression towards offspring, diminishing their reproductive success, or towards predators, increasing their risk of death. Populations show variation in aggressive behaviour, but both aggressive and non-aggressive behaviours persist in populations, meaning both behaviours are effective survival strategies.
(Schjolden et al. 2009) are seen to increase in response to an encounter. Moreover, there are differing responses between dominant and subordinate animals, where subordinates usually exhibit elevated glucocorticoid levels for longer (Sloman et al. 2001). Whilst the physiological control of aggression is quite well-known, it is also complex and depends upon both the previous experiences of the animal, motivation to engage in aggression, resource value and upon environmental conditions. Indeed, these factors affect the decision-making process of an animal during an aggressive interaction (Tinbergen 1951).
As an evolutionarily and economically important behaviour, there is much interest in understanding the genetic mechanisms underlying this complex phenotype. Indeed, phenotypic differences in behaviour have been attributed to differences in candidate genes. For example, different genotypes for MHC Ia locus in rainbow trout, Oncorhynchus mykiss, confer differences in aggressive behaviour, where aggressive and less aggressive are homozygous for different alleles and intermediate behavioural types are heterozygous (Azuma et al. 2005). Moreover, the relationship between genotype and gene transcripts has been studied for candidate genes. For example, reduced transcript expression of the candidate gene tryptophan hydroxylase 2, which is involved in the synthesis of serotonin, was related to a gene mutant for this gene in mice, Mus musculus (Kulikov et al. 2005). Indeed, gene expression of single candidate genes which are related to aggressive behaviour have been well-studied in many taxa, including Drosophila (Simon & Krantz 2007), domestic dogs, Canis lupus familiaris (Van Den Berg et al. 2008) and other mammals (Popova 2008). Particularly well-studied are the gene expression neurotransmitters, including serotonin (Mosienko et al. 2012), its transporters (Naumenko et al. 2009) and metabolites (Craig 1994; Hashizume et al. 2003), vasopressin/vasotocin and its receptors (Gilchriest et al. 2001; Liu et al. 2001; Albers et al. 2006; Caldwell et al. 2008).
subdominant and subordinate rainbow trout (Sneddon et al. 2011), which shows a complex genetic association with aggressive behaviour.
1.2.3 Bold-shy continuum
Boldness is a trait often studied in behavioural syndromes/temperament and is a trait related with aggressive behaviour (Wilson et al. 1993). Boldness was often used to describe any risk-taking behaviour, including reactions to novelty (Wilson et al. 1993; Sneddon 2003) and this is the definition used here, although more recently, boldness has been defined to encompass risk-taking behaviour only, and exploration to deal with novelty (Réale et al. 2007; Conrad et al. 2011). The fitness consequences of boldness are unclear, since some examples indicate that bold behaviour is advantageous. For example, female Trinidadian guppies, Poecilia reticulata, chose bold male guppies as mates irrespective of their colour (Godin & Dugatkin 1996). However, other examples indicate boldness confers a disadvantage. For example, bold female mosquitofish, Gambusia holbrooki, were smaller and had lower fecundity than shy mosquitofish (Wilson et al. 2010). These contrasting examples along with others that show trade-offs, such as Agamas, Agama planiceps, that feed more but experience higher injury from predators (Carter et al. 2010) are consistent with boldness being an optimal strategy or showing frequency-dependent fitness (Wilson et al. 1994; Bell 2009). Indeed the ecology of boldness may be species- or population-specific and it may show fitness advantages in particular contexts. Alternatively, boldness may be physiologically constrained and thus be exhibited due to behavioural syndromes, although evidence for this is weak (Decker & Griffen 2012; Garamszegi et al. 2012). Indeed, boldness shows consistency with stress coping styles, since bold rainbow trout, O. mykiss, take more risks and learn a conditioned response quicker (Sneddon 2003).
obtaining food may benefit an individual despite presence of predators (Wilson et al. 1994), particularly if the individual experiences reduced food availability (Thomson et al. 2012). Relatively few studies linking boldness with physiological parameters have been conducted although evidence suggests the physiology of boldness differs from the physiology of other behaviours, for example, in collared flycatchers, Ficedula albicollis, cortisol was not correlated between boldness and stress coping style (Garamszegi et al. 2012). Similarly, plasma cortisol, an indicator of stress responsiveness, was not linked to boldness (Thomson et al. 2011).
1.3 The rainbow trout model
Figure 1.1. Rainbow trout (Oncorhynchus mykiss) in a tank in the Liverpool aquarium.
Rainbow trout (Oncorhynchus mykiss; Figure 1.1) from the family Salmonidae are related to trout, salmon, particularly of the Salmo and Oncorhynchus genera, chars, freshwater
whitefishes and graylings. Oncorhynchus species are native to north America, China and
thus important to understand the underlying causes of stress responsiveness and related behaviours.
Rainbow trout, Oncorhynchus mykiss, are a popular farmed species and, as such, are an important aquaculture model for salmonids. Trout in aquaculture are well-studied for aggression, boldness and stress responsiveness for three key reasons. First, animals face stressors in the form of transport, netting and human handling (Zuberi et al. 2011). Second, stressors may be in the form of social stress due to crowding from high stocking densities. Third, animals may encounter different types of novel objects, environments or situations. Rainbow trout are highly tractable for studies in aggression due to territorial behaviour and readily engage in contests. Moreover, they show a profound divergence in bold behaviour and have been studied in relation to behavioural syndromes or stress coping styles. Importantly, lines have been selected for divergent responses to stress, which allow easy study of stress responses and related traits. By studying the genomic relationship with these related behaviours, it may be possible to identify genomic complexity associated with economically important behaviours for hatchery trout. Moreover, it may be possible to draw conclusions for natural populations, where these traits are evolutionarily important for survival.
The HR and LR lines show many behavioural and physiological differences and these have been equated to differences in stress coping style (Øverli et al. 2005; Øverli 2007). LR fish are more often dominant than HR (Pottinger & Carrick 2001), which links to plasma cortisol levels, since in rainbow trout hierarchies, the dominant fish is the least stressed, whereas the subdominant is the most stressed (Sloman & Armstrong 2002), as measured by plasma cortisol concentrations. Furthermore, LR fish resume feeding after stress-induced anorexia sooner than HR fish and show a lower amount of activity in the presence of an intruder (Øverli et al. 2002b) and retain a conditioned response longer than do HR fish (Moreira et al. 2004). There were unexpectedly no differences in boldness between lines (Thomson et al. 2011), but they differ in behaviour when challenged in novel environments as opposed to in home tanks (Schjolden et al. 2005). This indicates a level of plasticity in boldness, which may be associated with transcriptional gene effects
The cortisol stress response is a heritable trait in rainbow trout (Fevolden et al. 1999; Pottinger & Carrick 1999) and is well-studied in terms of gene expression: the expression of single genes or subsets of genes show clear evidence of transcriptional changes of key genes in response to many types of stress. For example, mineralocorticoid receptor in interrenal tissue is upregulated in response to simulated stress by ACTH exposure (Aluru & Vijayan 2008). Thomson et al. (2011) show differences in relative expression of a number of genes between HR and LR trout. Microarrays enable the assessment of transcriptional changes of many genes and this has been employed to investigate various stressors in trout. For example, the transcriptome response in the brain, kidney (Krasnov et al. 2005) and liver (Wiseman et al. 2007) to handling stress; the response of seven tissue types after low water stress (Momoda et al. 2007); the response of the heart to changing temperatures (Vornanen et al. 2005). In addition, multiple genes, or quantitative trait loci (QTLs), have been located to regions of the trout genome that are associated with the cortisol response to stress, both in the rainbow trout lines (Quillet et al. 2010) and in hatchery trout (Drew et al. 2007).
seen in trout exposed to differing levels of predation threat (Thomson et al. 2012). As such, the genetic components of boldness are unclear.
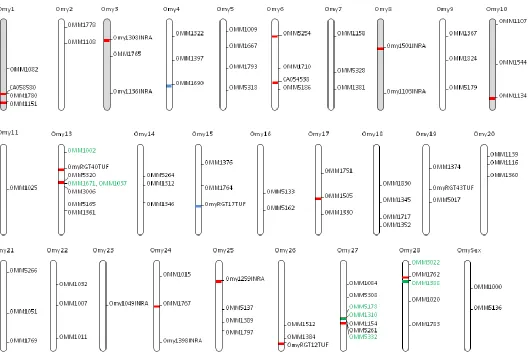
Though the rainbow trout genome has not yet been sequenced, due to difficulties arising from genome duplication, behavioural genetics of the rainbow trout is facilitated by the availability of a number of genomic tools. These include microsatellite linkage maps (Young et al. 1998; Sakamoto et al. 2000; Nichols et al. 2003; Guyomard et al. 2006; Rexroad et al. 2008). The most recent linkage map (Rexroad et al. 2008) comprises 1124 microsatellites and has comparative homology with zebrafish, Danio rerio, and a number of other teleost fish. A physical BAC map (Palti et al. 2009) allows fine scale mapping and identification of candidate gene positions, although the positions of markers are still being added. Moreover many of the contigs in this map require sequencing to allow further integration with the microsatellite maps. There are also a number of expressed sequence tags (ESTs) present in the SalmonDB database (Di Génova et al. 2011), which incorporates EST sequences from Salmo salar, Oncorhynchus mykiss, along with the whole genome sequences of Danio rerio, Gasterosteus aculeatus, Tetraodon nigroviridis, Oryzias latipes and Takifugu rubripes. Transcriptomes can give useful sequence information for non-model organisms, particularly those with large genomes and next generation sequencing technology allows this (Salem et al. 2010). Despite the status of rainbow trout as a non-model organism, important evolutionary and ecological questions can be answered using these tools. Molecular markers, for example can be used to determine differences between individuals or populations. Moreover, next generation sequencing can be used to identify differences in de novo gene expression among individuals. These tools can thus be used to determine genomic complexity associated with phenotypic traits, such as behaviour.
1.4 Aims
architecture of stress responsiveness and related behaviours. Genomic relationships with correlated behaviours will be characterised, the locations of genome regions and the numbers of genes associated with behavioural traits will be determined. Crucially, novel candidates for the study of individual and correlated behaviours will be identified. Moreover, candidates will be studied in relation to specific behaviours. Consequentially, it may be possible to comprehend the complex nature of the genomic factors underlying correlations between the evolutionarily and economically important traits: stress responsiveness and the related behaviours, aggression and boldness.
1.5 Chapter outlines
Chapter 2: Heterozygosity of three behaviours
It is unclear whether the relationship between genome-wide heterozygosity, which is often correlated with fitness traits, and the evolutionary and economically important behavioural traits stress responsiveness, aggression and boldness exists. Moreover, little work has been conducted to examine genetic links between correlated behaviour. By assessing genome-wide genetic variation, aggression, boldness and stress responsiveness, I can determine genomic influences on behaviours and show whether there are similarities in the patterns of heterozygosity among behaviours. Under the hypothesis that aggression is related to fitness, it would be expected that more aggressive individuals will be more heterozygous and as boldness and stress responsiveness relates to aggressiveness, it is also expected that LR and bolder individuals will be more diverse.
Chapter 3: Genome scan of selective breeding for stress responsiveness
The number and location of genome regions associated with stress responsiveness is unknown. I will assess genetic differentiation between lines of trout selectively bred for divergent responses to stress to identify neutral markers that diverge between the lines, which may be indicators of selection. Knowledge of the locations of the genetic markers provides an opportunity to identify (and therefore enumerate) candidate regions that are associated with the selective breeding program for stress. Since the stress response is under complex control, I expect genetic differences between the lines to emerge at widespread locations.
Chapter 4: De novo sequencing of aggressive behaviour
between behavioural types. Moreover, novel candidates may be identified using this approach. Since there are complex external cues associated with social behaviour, such as those specific to an opponent, I expect many genes to be differentially expressed between aggressive and less-aggressive trout.
Chapter 5: Changes in transcripts after aggressive interactions
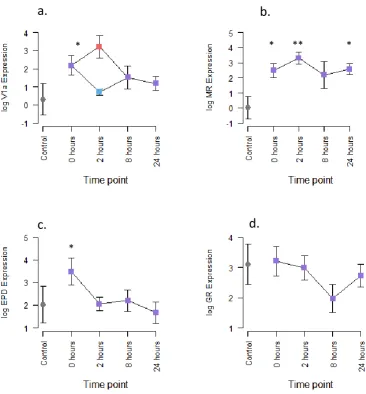
Little is known about the transcriptional changes that occur during recovery from social stress or aggressive interactions. By tracking changes in genes in the brain, it may be possible to understand how winners and losers differentially modulate their responses during recovery from social stress and to determine the role of candidate genes in aggressive interactions. I expect winners and losers to show differential expression in four candidate genes, due to known differences in physiology between dominant and subordinate trout. In addition, I expect that initial changes will be followed by a recovery to control levels.
Chapter 6: Transcript changes in response to an acute stressor
Chapter 2 Is genome-wide heterozygosity related to the evolutionarily important traits aggression, boldness and stress responsiveness?
2.1 Introduction
Behavioural traits form complex phenotypes whose expression represents the response to a variety of influences, including genotype, external environment, emotional state and previous experience (Boake et al. 2002; Bendesky & Bargmann 2011). A long-standing and major challenge in evolutionary biology is to understand the associations between genotype and phenotypes, with a recent emphasis on determining the role of genes upon apparently complex behaviours. Currently, many studies focus on the effect that polymorphisms in specific candidate genes have upon behaviour, such as variation in the dopamine receptor D4 (DRD4), which is associated with novelty seeking in great tits, Parus major (Fidler et al. 2007). Another example is differences in the major histocompatibility complex (MHC) class Ia among rainbow trout, Oncorhynchus mykiss, that exhibit correlated behaviour: trout that were homozygous for one genotype were bold and aggressive whereas trout with an alternate homozygous genotype were shy and passive and heterozygous trout had intermediate levels of boldness (Azuma et al. 2005). However, there are several problems with this approach. First, the expression of complex phenotypic traits is only rarely determined by the action of one or few specific genes, and many studies have highlighted a wider role of the effect of variation in the amount of genetic diversity (heterozygosity) among individuals in determining the expression of certain behaviours. Second, such genetic correlates of behaviour should examine their contribution to correlated behavioural traits. Certain behavioural traits confer fitness upon an individual. For example, aggression increases an animal’s competitive ability and thus allows it to obtain mates (Meagher et al. 2000). Moreover, heterozygosity is related to many fitness traits (Kempenaers 2007). By examining the variation in behavioural traits alongside the variation in heterozygosity, it may be possible to determine how genome-wide heterozygosity affects the expression of behaviour.
2.1.1 Heterozygosity-fitness-correlations
Wetzel et al. 2012), disease resistance (Acevedo-Whitehouse et al. 2005; Rijks et al. 2008) and growth rate (Pogson & Fevolden 1998; Bierne et al. 2000). In addition, many morphological traits that could have some impact upon fitness are correlated with heterozygosity, for example, antler size in Iberian red deer, Cervus elaphus hispanicus (Pérez-González et al. 2010). Crucially, the expression of a number of important behavioural traits, such as aggression (Charpentier et al. 2008) and territoriality (Lieutenant-Gosselin & Bernatchez 2006), is associated with heterozygosity. Whilst the traits studied in this chapter are not fitness traits per se, the term heterozygosity-fitness-correlation will be applied in a general sense in absence of a more appropriate term.
2.1.2 Behavioural traits
Aggressive behaviour is likely to impact upon fitness since it allows an individual to gain dominance and territoriality, and consequentially access to limited resources such as mates and food. Indeed, the evidence for fitness benefits associated with aggression is clear in many species: aggressive behaviour has been related to male mating success in the common loon, Gavia immer (Mager III et al. 2008), dominance has been related to reproductive success in meerkats, Suricata suricatta (Hodge et al. 2008), and male territoriality has been related to female reproductive success in the African lion, Panthera leo (Mosser & Packer 2009). Also, reproductive success is related to aggressiveness and dominance in salmonids, for example Chinook salmon, Oncorhynchus tshawytscha, and rainbow trout (Gallardo & Neira 2005; Tatara et al. 2008; Schroder et al. 2010). As a fitness-related trait, the expression of aggression has been quantified in relation to differences in heterozygosity, with significant associations reported in primates (Charpentier et al. 2005; Charpentier et al. 2008), birds (Seddon et al. 2004; Ryder et al. 2010) and salmonids (Tiira et al. 2003; Tiira et al. 2006). In landlocked salmon, Salmo salar, aggressiveness was associated with higher genetic diversity, where this link was thought to be due to inbreeding (Tiira et al. 2003). Similarly, in brown trout, Salmo trutta, dominance, a trait linked with aggression was associated with higher levels of heterozygosity, however here this association was apparently due to local effects (Tiira et al. 2006). However, both these studies use a small number of markers to estimate genome-wide heterozygosity and may therefore lack the statistical power to detect LD. Together, these studies demonstrate a clear link between the level of heterozygosity and the expression of aggressive behaviour in salmonid fishes, even if the underlying cause (i.e. local versus single locus effect) is unclear. By following a similar framework, the link between the fitness-related traits aggression and heterozygosity may be shown in rainbow trout.
addition aggression and boldness have been correlated with stress responsiveness in stress coping styles. Stress coping styles are characterised in many vertebrates including mammals and fish and are important topics in the fields of behavioural ecology and physiology (Koolhaas et al. 1999; Koolhaas et al. 2007). For example, Verbeek et al. (1996) showed that great tits, Parus major, selected for divergent stress coping style also exhibited divergence in boldness and in aggressiveness. Stress coping style has been demonstrated in rainbow trout, where different lines bred for high and low stress responsiveness exhibit differences in aggressive behaviour (Pottinger & Carrick 2001; Øverli et al. 2002b). The complex nature of the correlation between behavioural traits means that the genetic basis of behavioural syndromes is relatively understudied. Moreover, the behavioural trait boldness and the physiological trait cortisol release during stress are, individually, complex traits with potentially complex underlying genetic mechanisms, which warrant further investigation.
A key component of behavioural syndromes is risk-taking or exploration of novel objects or environments, termed boldness (Huntingford 1976; Fraser et al. 2001; Sneddon 2003; Eriksson et al. 2010). Fitness advantages of boldness are unclear and may be dependent upon context. Sometimes, boldness is advantageous, for example, female Trinidadian guppies, Poecilia reticulata, mated with bold male guppies after observing the risk-taking behaviour of potential mates and this was irrespective of male colour (Godin & Dugatkin 1996). However, other examples indicate boldness confers a disadvantage: bold female mosquitofish, Gambusia holbrooki, were smaller and had lower fecundity than shy mosquitofish (Wilson et al. 2010). Therefore, it is likely that, whilst boldness confers advantages in some contexts, in others, individuals that retain this trait have reduced fitness. This context-dependency is seen in Panamanian bishops, Brachyrhaphis episcopi, where fish are bolder in the presence of a predator but not in populations without predation (Brown et al. 2005).
link between heterozygosity and boldness may be elucidated. Furthermore, since aggression is correlated with both boldness and heterozygosity in salmonids, comparing the respective associations of heterozygosity with aggression and boldness may continue the understanding of how genetic links affect behavioural links in rainbow trout.
The cortisol response to stress is a well-studied trait with implications for fitness, having both evolutionary and economical importance. Chronic stress can cause deleterious effects on growth processes (Pickering et al. 1991), the reproductive system (Campbell et al. 1992) and immunocompetence (Pickering & Pottinger 1989) and this can impact directly upon the reproduction and survival of animals. Lines of rainbow trout were bred for high (HR) and low (LR) plasma cortisol levels in response to a confinement stressor (for details see Section 1.3) and this response was heritable. Moreover, these lines diverged in aggressive behaviour with LR being more aggressive than HR (Øverli et al. 2002; Pottinger & Carrick 2001). That it is possible to generate lines of trout based upon their cortisol responses to stress demonstrates a genetic basis to the stress response. Evidence of consistent differences in aggressive behaviour implies some constraint on coping style, which may be genetic. Moreover, Thomson et al. (2011) showed differential gene expression between HR and LR in response to an acute stressor, implicating a small number of candidate genes in the stress response. However, whether the stress response and the link with behaviour is due to a few candidate genes is not known, which would be evident as local effects in a HFC, or due to genome-wide levels of heterozygosity, which would be generated by inbreeding. Therefore, these inbred lines present an opportunity to study the genetic basis of stress coping styles.
Currently, how heterozygosity influences a suite of correlated behaviours, both individually and with the context of an overall behavioural syndrome is unclear. Aggressive behaviour is a well-studied fitness-related trait in terms of its association with heterozygosity, where more aggressive individuals show higher genetic diversity. However, the genetic architecture, for example the number of genes implicated in a trait, associated with stress responsiveness and boldness are less well-characterised. Moreover, the genetic basis underlying the correlation of behaviours is not well-understood.
less aggressive individuals due to previous work on many animals and in particular salmonids. Moreover, I hypothesise that because low stress responsiveness and boldness are often correlated with aggression in salmonids, I also expect that individuals showing these fitness-related traits to be heterozygous.
2.2 Methods
2.2.1 Rainbow trout husbandry
All experiments were conducted in a humane manner according to Home Office UK licensing and after local ethics approval. Rainbow trout, Oncorhynchus mykiss, were tested for two behaviours: aggression and boldness. To do this, two groups of fish were used. For aggression, I used a commercially obtained hatchery strain and for boldness I used lines of trout with divergent responses to stress. The fish tested for aggression comprised two groups of rainbow trout that were transported from a commercial supplier to the aquaria at Liverpool on 11/08/2010 (n=100, approximate weight=90 g) and 25/10/2010 (n=70, approximate weight=90 g). Rainbow trout interactions are influenced by previous experience of winning or losing and, in order to reduce effects of previous experience upon aggressive behaviour, the trout were held in two separate stock tanks (2x2x0.5 m; 2,000L). The holding tanks were supplied with aerated recirculating freshwater (semi-closed system) at 132C, with a 14:10 hr light:dark regime, similar to ambient. Trout were fed commercial pellets (Skretting, UK) at a rate of 1% body weight daily according to manufacturer’s recommendations. Fifteen pairs of fish, one from each tank, were caught at random using a hand net, anaesthetised in 33.3 µgml-1 benzocaine (Sigma, UK) in a 25 L bucket to minimise stress during weighing; fish were weighed to the nearest 0.01 g and transferred to experimental tanks (90x45x50 cm; 200 L) at 11±1°C, which were arranged in three semi-closed recirculating systems (n=15 tanks) with aerated freshwater and were screened from visual disturbance. Each tank contained two fish of equal weight (±10%), so as not to influence the outcome of the interaction as relatively larger fish tend to be dominant (van Leeuwen et al. 2011), one fish in each of two compartments, halved by an opaque divider. Fish were fed daily in each compartment at the same rate as in the stock tanks.
and placed into individual glass tanks (90×45×50 cm; 200 L), as above. Experiments were conducted on fish that had resumed feeding after this period.
2.2.2 Behavioural tests
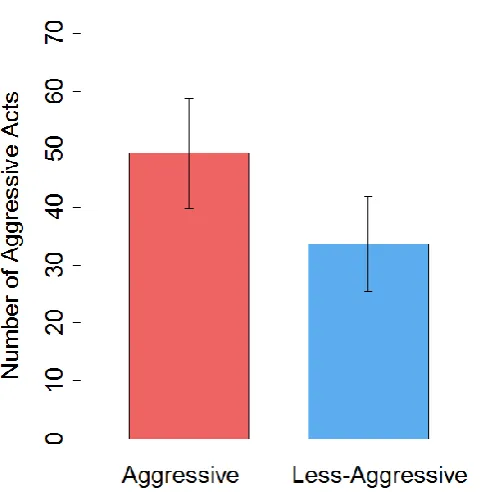
Once fish resumed feeding and after a period of at least 7 days (reduced feeding is a standard indicator of stress (Carr 2002)), the tests for aggressive behaviour began. All interactions took place between 12:00 and 14:00 to minimise any effects of diurnal variation in physiology. At least 15 min prior to each experiment low light level cameras that were linked to a remote monitoring system were installed at the front of the tanks to allow fish to minimise disturbance immediately preceding the behavioural trial. Each experiment began by removing the divider (using a pulley system to prevent fish being aware of the operator), after which the pairs were allowed to interact for a maximum of 15 min. An opaque tube (160x90x90 mm) was supplied as a refuge for each fish, should it choose to remain out of sight of its opponent, such that any interactions were voluntarily performed by the fish and the stress of the encounter was minimised. The videos of the interactions were assessed blind to determine the amount of aggression that each fish performed. The total number of aggressive acts were determined by measuring the following three types of aggressive behaviour: (1) displacement, where one fish moves slowly towards its opponent and the opponent retreats in response; (2) chase, where one fish moves rapidly towards its opponent resulting in either contact between the two fish or the opponent retreating; (3) circling, where both fish circle each other. An aggressiveness score for each fish was calculated by subtracting the total number of aggressive actions of its opponent from the total number of acts of the fish. A fish’s aggressiveness is dependent upon the degree of aggressiveness exhibited by its opponent (Haller et al. 1996; Neat et al. 1998; Dugatkin & Druen 2004) (Appendix 1, Section A1.1) and subtraction of one fish’s score from its opponent’s score accounts for this. Thus, fish with the highest score were deemed to be “aggressive” (n=15) and those with the lowest were “less aggressive” (n=15). Dividers were replaced and each trout humanely killed at the end of the interaction period using concussion and exsanguination. Fish were weighed and sexed, and muscle tissue was collected onto dry ice and frozen at -80C.
were measured as the latency to approach within 5 cm and 10 cm, frequency of entering within 5 cm and 10 cm and time spent within 5 cm and 10 cm zones of the novel object as well as latency, frequency and duration of time spent outside of these zones (passive). The trial was repeated one week later to ensure consistency of response using a different object to prevent habituation. Fish that behaved consistently i.e. bold or shy over both trials were used for genotyping. Surprisingly, both HR and LR lines had bold (HR: n=15, LR: n=13), intermediate (HR: n=20, LR: n=16) and shy (HR: n=9, LR: n=4) individuals (Thomson et al. 2011), therefore, both line and boldness were investigated. Following the second trial, fish were killed humanely by concussion and exsanguination and muscle tissue sampled and immediately frozen at -80°C.
2.2.3 Genotyping
I assessed the association between genome-wide heterozygosity with aggression (hatchery strain), boldness and stress responsiveness (stress lines). To do this, I genotyped the stress lines at 82 microsatellite markers, corresponding to approximately three loci from each of the published rainbow trout linkage groups (Guyomard et al. 2006; Rexroad et al. 2008). The number of loci was reduced to 24 to assess aggression in the hatchery strains for logistical reasons (all markers in Appendix 1, Table A1). For PCR, genomic DNA from 44 LR and 33 HR rainbow trout (Oncorhynchus mykiss), as well as from 15 aggressive and 15 less aggressive fish was extracted from muscle tissue using a high salt method (Aljanabi & Martinez 1997). Microsatellite alleles were amplified in a 10 μl PCR on a Dyad DNA Engine (MJ Research Inc.). A tailed primer method was used to label PCR products (see Schuelke 2000), whereby the PCR reaction contained forward primers that are synthesised to include a 5’ (or tail) M13 sequence (AGCGGATAACAATTTCACACAG). The reaction also contained the M13 sequence, which was labelled with either 6-FAM, NED, PET or VIC fluorophores (Applied Biosystems). Best results were achieved using two rounds of PCR. The PCRs consisted of 75 mM Tris-HCl (pH 8.8), 20 mM (NH4)2SO4, 0.01% (v/v) Tween
20, 0.2 mM each dNTP, 2.0 mM MgCl2, 5-50 ng template DNA, 10 μg BSA and 0.25 U Taq
2.2.4 Data analyses
Loci were tested for departure from Hardy-Weinberg using Genepop on the web v.4.0.10 (Raymond & Rousset 1995; Rousset 2008). Multilocus heterozygosity, generally one of the most robust measures of heterozygosity (Chapman et al. 2009; Szulkin et al. 2010), is a count of the number of heterozygous loci and was standardised by the total number of loci used for genotyping to generate a proportion of heterozygous loci (PHt). PHt was calculated using GENHET (Coulon 2010) separately for the hatchery strain and the stress lines. It is also possible to calculate other measures of heterozygosity, observed heterozygosity, expected heterozygosity, internal relatedness and homozygosity by locus, using GENHET. These measures were significantly correlated (all r2>(-)0.9, all P<0.0001; Table 2.1). Since the level of aggression is dependent on the opponent, variation in levels of heterozygosity of aggressive individuals and less aggressive individuals was compared between two groups in concordance with previous methods used to assess heterozygosity amongst aggression types in salmonids (Tiira et al. 2006). In addition, sex was included as a covariate. Since many measures were used to assess boldness, a principal component analysis, based on a correlation matrix, of the second boldness trial was conducted to identify which measures of boldness best describe variation in the data. A HFC was assessed by correlation between PHt and PC1, which was used to characterise boldness (Thomson et al. 2011) and with PC2. As with aggression, the difference in heterozygosity was assessed between HR and LR rainbow trout. Since there were two stocks of rainbow trout used for the aggression trial, I tested whether there was a difference in heterozygosity between the two stocks and whether there was a bias in number of winners originating from each tank. In addition, since it was not possible to determine the sex of the fish prior to the experiment, I tested for an effect of sex upon winning. Finally, since it was not always possible to obtain fish of equal weight, I assessed whether there was an effect of the difference in weight upon the difference in aggressive acts.
Table 2.1. Correlation coefficients for the correlations between the proportion of heterozygous loci (PHt) and four other measures of heterozygosity: observed heterozygosity (Ho), expected heterozygosity (He), internal relatedness (IR) and homozygosity by loci (HL).
Measure of
heterozygosity R2 P-value
Ho 0.996 ***
He 0.999 ***
IR -0.928 ***
To assess the underlying mechanisms of a HFC, it is necessary to test for local effects (LD) or general effects (ID). ID can be quantified by heterozygosity-heterozygosity correlations (HHCs), which assess whether heterozygosity at loci is correlated within individuals and this is central to inbreeding effects (Balloux et al. 2004). HHCs work by arbitrarily dividing the panel of marker loci into two sets and then assessing the correlation in multilocus heterozygosity between the two sets. This is repeated multiple times where the assignment of loci to the two groups is random. Rhh (Alho et al. 2010) was used to calculate the mean HHC using PHt from the outbred trout used to measure aggression and separately for the inbred lines. The validity of HHCs has been questioned recently because of a lack of independence of the resulting correlation coefficients (Szulkin et al. 2010). Whilst HHCs provide a sufficient estimate of inbreeding, a more appropriate parameter to capture ID is by the parameter g2. This is defined as the excess of double heterozygotes at two loci compared
with expectation under random association (with g2=0 indicating a lack of ID) (David et al.
2007). By testing for ID, whether the genotyped markers represent the underlying inbreeding coefficient in the population used can be indicated. I measured g2 using RMES
software (David et al. 2007) for both the hatchery strain used to measure aggression and for the inbred lines used to measure boldness and which characterise stress responsiveness. An additional specific test, which assesses the effects of single loci upon the phenotype was carried out using GEPHAST (Amos & Acevedo-Whitehouse 2009). In this test loci are sorted according to a maximum phenotype-genotype association. This is repeated randomly to detect a strong association of a single locus with phenotype; this procedure was done using 1,000 randomisations and corrected for multiple testing using a sequential Bonferroni test (Rice 1989) to maintain a type-I error rate of 0.05. However, the trout used to assess the association between boldness and stress responsiveness and heterozygosity were not tested for single locus effects on phenotype, due to finding no initial phenotypic relationship with heterozygosity.
2.3 Results 2.3.1 Behaviour
Development Core Team 2009) with aggressiveness and sex as fixed effects and the pairing of individuals as a random effect. This showed there to be no significant difference in aggression between males and females (F12=0.687, P=0.505; Appendix 1, Figure A1).
Additionally, differences in weight were minimised to 8.9±6.3% difference, as body size can affect the outcome of interactions. These minor differences in weight did not affect the number of aggressive acts, thus the outcome of the interaction (paired t-test: t=-0.67, df=31, p=0.509; Appendix 1, Figure A2).
[image:41.595.188.435.257.503.2]Figure 2.2 Principal component analysis of nine measures of boldness (latency to enter within 5 cm, 10 cm and passive latency, frequency of entering within 5 cm, 10 cm and passive frequency, duration of time spent within 5 cm, 10 cm and passive duration spent near a novel object) shows the loadings of PC1 and PC2 of these nine measures.
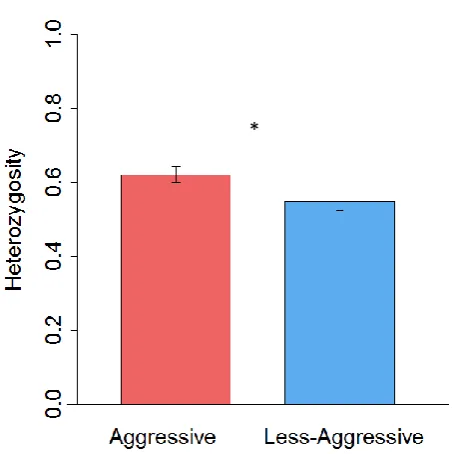
[image:42.595.151.396.411.659.2]Figure 2.4. The difference in heterozygosity, measured as the proportion of heterozygous loci of the total number of loci, between aggressive (red; n=15) and less aggressive (blue; n=15) rainbow trout. Error bars show the standard error of the mean. * indicates P<0.05.
Figure 2.5. The relationship between a. principal component 1, which describes 40% of variance of boldness and is described by latency to approach within 5 and 10 cm of a novel object performed by bold and shy rainbow trout (n=77), and b. principal component 2, which describes 25% of variance of boldness and is described by the duration of time spent within 5 and 10 cm of a novel object and heterozygosity, measured as the proportion of heterozygous loci of the total number of loci.
Table 2.2. Principal component loadings (derived using a correlation matrix) for nine measures of boldness in lines of rainbow trout selected for divergent cortisol responses to stress.
Boldness Measure PC1 PC2 PC3 PC4 PC5 PC6 PC7 PC8 PC9
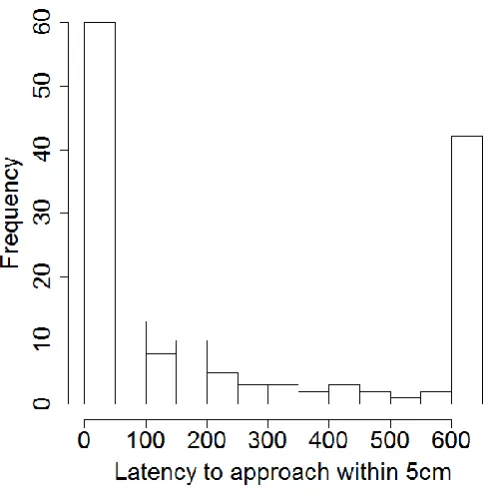
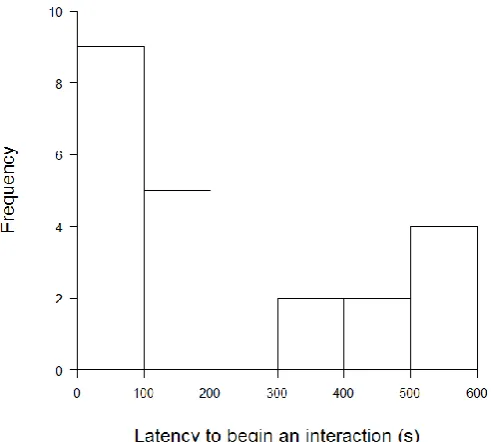
The selected HR and LR lines have consistently displayed a divergent cortisol stress response through four generations (F1-F3: Øverli et al. 2005; F4: Thomson et al. 2011). Boldness was tested in these lines: the results for the boldness assessment are described in full in Thomson et al. (2011) but are briefly recapitulated here. Principal component analysis (Table 2.2) of the final bold-shy assessment demonstrated that PC1 described 40.5% of the variation and PC2 described a further 25.5%. The major contributor to PC1 was latency to approach within 5cm and 10 cm, whereas PC2 described duration of time spent within 5 cm and 10 cm of the novel object (Figure 2.2). The distribution of time to approach within 5 cm of the novel object was bimodal (Figure 2.3), where individuals tended towards either the bold (quick to approach) or shy (slow to approach) extreme. Of the 77 individuals examined, 41 were consistently bold or shy over two trials, where 28 were bold and 13 were shy. The lines showed similar numbers of bold (HR: n=15, LR: n=13), intermediate (HR: n=20, LR: n=16) and shy (HR: n=9, LR: n=4) individuals, but differed in proportion, where LR had a slightly higher proportion of bold fish (Appendix 1, Figure A3). Additionally, the trout from the two lines showed no difference in weight (two sample t-test: t=-0.735, df=73.9, P=0.465).
2.3.2 Heterozygosity-behaviour-correlations
Table 2.3. The differences in five measures of heterozygosity between aggressive (n=15) and less aggressive (n=15) rainbow trout: proportion of heterozygous loci (PHt) and observed heterozygosity (Ho), expected heterozygosity (He), internal relatedness (IR) and homozygosity by loci (HL)
Measure of heterozygosity
Mean difference
Paired
t-value
Degrees of Freedom
P-value
PHt 0.0672 2.53 14 0.0241
Ho 0.113 2.31 14 0.0366
He 0.113 2.47 14 0.0268
IR -0.0720 -1.49 14 0.159
HL -0.0665 -1.98 14 0.0682
Table 2.4. The correlation coefficients for the relationship between five measures of heterozygosity and rainbow trout tested for PC1 (boldness towards a novel object; n=77): proportion of heterozygous loci (PHt) and observed heterozygosity (Ho), expected heterozygosity (He), internal relatedness (IR)
and homozygosity by loci (HL)
Measure of heterozygosity R
2
P-value
PHt -0.0506 0.6623
Ho -0.0565 0.6254
He -0.0568 0.6237
IR 0.0588 0.6114
HL 0.0398 0.7314
Table 2.5 The correlation coefficients for the relationship between five measures of heterozygosity and rainbow trout tested for PC2 (n=77): proportion of heterozygous loci (PHt) and observed heterozygosity (Ho), expected heterozygosity (He), internal relatedness (IR) and homozygosity by loci
(HL)
Measure of Heterozygosity R
2
P-value
PHt 0.28 0.013
Ho 0.27 0.016
He 0.28 0.013
IR -0.28 0.014
Table 2.6. The differences in five measures of heterozygosity between rainbow trout with a high (HR;
n=44) and low (LR; n=33) cortisol response to confinement stressor: proportion of heterozygous loci (PHt) and observed heterozygosity (Ho), expected heterozygosity (He), internal relatedness (IR) and
homozygosity by loci (HL)
Measure of heterozygosity
Line Mean
Value
t-value Degrees of Freedom
P -value
PHt HR 0.378 -1.85 73.3 0.069
LR 0.403
Ho
HR 0.972
-1.86 72.7 0.067
LR 1.03
He
HR 0.802
-1.81 73.1 0.074
LR 0.854
IR HR 0.170 -0.52 74.0 0.603
LR 0.184
HL HR 0.540 0.58 74.3 0.564
LR 0.532
Table 2.7 Output of 2-way ANOVA where the difference in heterozygosity was tested between winning and sex and the interaction between winning and sex of rainbow trout.
DF SS MS F value P-value
Winning 1 0.04104 0.04104 5.136 0.032
Sex 1 0.0026 0.0026 0.325 0.573
Winning:sex 1 0.01342 0.01342 1.679 0.206
Residuals 26 0.20773 0.00799
Consistent with expectations due to studies in other salmonids, aggressive rainbow trout had significantly higher levels of heterozygosity than less aggressive fish (PHt aggressive and less aggressive=0.623±0.025 and 0.556±0.024 respectively) (Figure 2.4; paired t test: t14=2.53, P=0.0126; data for PHt, see Table 2.3 for other measures of heterozygosity).
(two-sample t test: t=-1.85, df=73, P=0.069; data for PHt, see Table 2.6 for other measures of heterozygosity), although LR showed a nonsignificant tendency to have higher heterozygosity (Figure 2.6).
2.3.3 Causes of HFCs
The hatchery strain used to measure aggressive behaviour showed no evidence for significant ID, with the heterozygosity-heterozygosity correlations (HHCs) indicating a low inbreeding signal (r=-0.056, 95% confidence interval: -0.304–0.239) and g2 was low and
non-significant (g2=0.00457, P=0.283). Furthermore, no evidence for single locus effects on
the aggressive phenotype was found, whereby no locus affected the aggression- heterozygosity association more than any other (Appendix 1, Table A6). In contrast, the stress lines showed a presence of significant ID using both HHC (r=0.232, 95% confidence interval: -0.0517–0.471) and g2 (g2=0.181, P<0.0001); thus the pattern of heterozygosity at
one or few of these loci in these lines is representative of the general genome-wide variation in diversity that occurs due to inbreeding.
Figure 2.6. Heterozygosity of high responding (HR; green; n=44) and low responding (LR; orange,