REVIEW AND RELATIONSHIP TO ULTRASONIC SCATTERING
INTRODUCTION
Jai-Man Baik and R. Bruce Thompson Ames Laboratory, USDOE
Iowa State University Ames, Iowa 50011
When a tensile load is applied to an elastic solid with an imper-fect interface containing cracks or voids, the farfield displacement that would occur in the absence of the interface will be increased by localized deformations [1]. This extra extension can be modeled as the response of two half-spaces connected by a distributed spring. The spring stiffness per unit area, K, is a function of the topography of the partially contacting surfaces.
If ultrasonic energy with wavelength large with respect to the contact separation illuminates the interface, a set of modified bound-ary conditions involving the interface stiffness K has been found to correctly predict the frequency dependence of reflection and transmis-sion [2-4]. The distributed spring or equivalent models have proved to be useful tools in ultrasonic measurements of partially contacting interfaces in studies of friction [5], fatigue crack closure [2,3,6-10], adhesive bonding [11-13]. and shape memory couplers [14].
This paper reviews these results and extends them to the case in which inclusions are present at the interface. The modified boundary conditions are first derived and their utility is verified by compari-son to exact solutions. The relationship between K and the interfacial topography is then discussed for several special cases of interest.
QUASI-STATIC APPROXIMATION FOR ELASTIC WAVE SCATTERING FROM INTERFACES Figure 1 illustrates the geometry of interest. An interface between two half-spaces is assumed to exist in the vicinity of the x-O plane. Part (a) illustrates the problem of static deformation, which has been solved for many specific interfacial topographies [1]. When a
traction, a is applied, the relative displacements of two points far from, and on opposite sides of, the interface can be written as the sum of the displacement, ~P' which would have existed had the interface
been "perfect" (no material discontinuity) plus the extra displacement,
~I' due to local deformation in the vicinity of the interface. If
134
1 1 1
X IT
-t.
T
(0)
x
(b)
J.-M. BAlK AND R. B. THOMPSON
x=o-"f·---2K... ---2K ~-i-i-i-i~~~~~
x=o.
x
(e)
Fig. 1. Quasi-static model for imperfect interface a) Definition of extra displacement, AI
b) Geometry of ultrasonic reflection and transmission experiment
c) Quasi-static model for interface
this interface contains cracks or pores, AI>O. For inclusions, AI can be positive or negative depending on the inclusiona shape and their elastic moduli with respect to the half-spaces. An interfacial stiff-ness, K, may be defined as
(1)
This can be thought of as the stiffness of the distributed spring which, if used to join two half spaces of the original material, would
reproduce the static displacement. K can be evaluated from solutions for Ai' which are reported in the literature for a variety of inter-facia conditions [1].
The scattering of ultrasound from the same interface is illus-trated in Fig. lb. Here a time harmonic illuminating plane wave is assumed to be converted into a transmitted and reflected wave, whose energies must sum to that of the incident wave as long as the charac-teristic dimensions of the interfacial geometry are much less than the wavelength so that scattering into waves propagating at other angles can be ignored. Intuitively, it might be imagined that at these long wavelengths, the scattering properties should be related to the response to a static load. This relationship may be quantified as follows.
[image:2.482.66.421.57.289.2](2)
where t is the thickness of a region containing all density charges,
Po is the density of the original material, and p\X) is the actual density, averaged in the y-z plane. For an interface consisting of an array of cracks, mao. For volumetric imperfections such as pores or inclusions, m can be either positive or negative.
For a perfect interface, the mechanical boundary conditions are continuity of stress and displacement. For the model shown in Fig. 1c, these must be modified to take the form
[a(O+)
+
a(O-)]
/2
~ K[u(O+) - u(O-)]
-mw
2 [u(O+) + U(O-)] /2
=
a(O+)
-
a(O-)
(3)
(4)
where u is the displacement, a is the stress, and w is the angular frequency of a time harmonic variation of the form ejwt which will be assumed throughout the remainder of this section. Note that the results for a perfect interface are recovered when K - ~ and m
=
o.Here, consistent with the quasi-static approximation, it has been assumed that w«(4K/m)1/2, the resonance frequency of the spring mass combination. In this limit, the mass can be placed anywhere on the spring. For example, the same equations would result from placing a mass of value m/2 at each end of the spring. This approach can readily be generalized to shear wave or non-normal incidence by a tensor
definition of K [3]. The details will be omitted here for conceptual simplicity.
Implicit in the above approach is the assumption that the stresses associated with the ultrasonic wave are sufficiently small that the degree of contact at the interface does not change during the stress cycle. Relaxation of this assumption leads to nonlinear effects [15].
The modified boundary conditions presented in Eqs. (3) and (4) can be used to determine the reflection R and transmission T coefficients of ultrasonic waves at the interface. The results are
R • jW(Z/2K - m/2Z)
(1 - mw2/4K)
+
jw (Z/2K+
m/2Z) (5)T
=
(1+
WW2 / 4K)(1 - mw2/4K)
+
jw (Z/2K+
m/2Z)' (6)Consistent with the above approximations, the term mw2/4K must always be small with respect to unity in the region of validity of the
modified boundary conditions. This term has been formally included in Eqs. (7) and (8) to ensure that the energy conservation criterion
IRI2
+
ITI2=
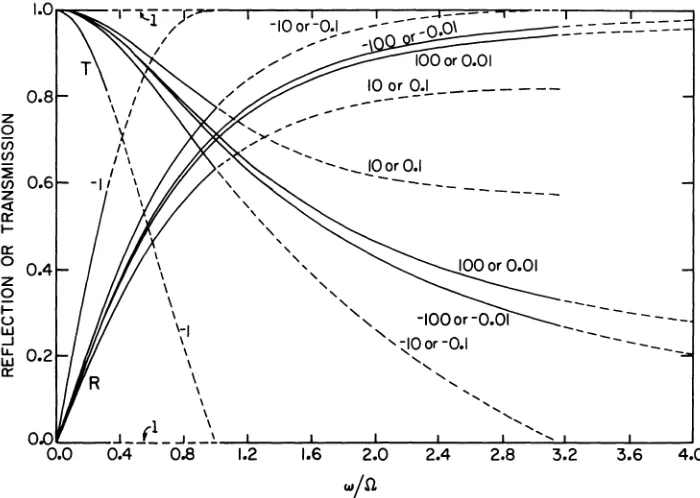
1 is satisfied identically.The cl1aracter of these solutions is illustrated by the normalized plots in Fig. 2. Here ITI and IRI are plotted versus win, where n =
136 z o in If) 0.8 ~
If) 0.6
z
<t a::
~
a::
o
0.4 z o ~ u W ...J LL. W a:: 0.0 0.0J.-M. BAlK AND R. B. THOMPSON
\ \ \
,
\ \'i
l \ \ \ ,,
,
,,
--,
,
,
4---
---
-
---"'"' -100 or -0.01
"
'~Oor-O.I"
,
,
\ "
\ ... ,
\
"
-
---
---
----(1 \ '"
~ ____ ~ __ l __ ~----~--~~----~----~--~~----~----~
0.4 0.8 1.2 1.6 2.0 2.4 2.8 3.2 3.6 4.0
wjn
Fig. 2. Reflection and transmission coefficients versus w for quasi-static model:
n
is the minimum of 12K/zl or 12Z/ml. Each curve is labeled by the value of the parameters Z2/mK • For mw2/4K<
0.1, the solution is represented by a solid line. For 0.1<
mw2/4K< 1.0, the solution is dotted to indicate the
possibility of error due to neglect of resonance effects, as discussed in the text.region, the effects of the aforementioned resonance are small. In the dotted regions significant error terms can occur. These dashed curves are only included to indicate trends rather than quantitative results.
Several interesting implications of Eqs. (5) and (6) are illus-trated. Except for the phase, the effects of a compliance defect (K#m) or a mass defect (m#o) at the interface are equivalent. The reflection increases monotonically and the transmission decreases monotonically. The form of the response is fully determined by the ratio
n
1/n
2 wheren
1 - 2K/Z andn
2=
2Z/m. When plotted versusn -
min(n , n
2), the curves forn
1/n
2=
x andn
1/n
2=
l/x become identical. Aowever, the responses forn
1/n
2 = x and 01/02 - -x are not the same. Negative ratios occur because K and m can formally assume negative values. Although there is no longer a physically realizable mass-spring analog, the equations are still applicable. When Z/2K=
m/2Z, the modelpredicts that the interface is invisible.
[image:4.482.63.413.55.304.2]Although the above analysis has been presented for the case of identical media on either side of the interface, it can be easily generalized to the case of dissimilar media. Equations (3) and (4) can again be used to relate solutions of the wave equation on either side of the interface. The resulting reflection and transmission coeffi-cients are
111U12
( 1 - 41<: )
+
jill [2Zo
mw
2(Z
+
Z
(1
+
4 )
0 1 1 < :
T -
---~~----~~---111U12 ZoZl m
(1 -
4 )
I<:+
jill [ (Z 0+
Z) 11<:+
(Z 0+
Z ) 1where Zo and Zl are the acoustic impedances on the two sides of the interface.
COMPARISON OF QUASI-STATIC TO EXACT SOLUTIONS
(7)
(8)
The heuristically derived model has been compared to two cases for which exact solutions are known. The first is an interface consisting of a layer containing material with different density and elastic constants, as will be discussed below. The second is a planar inter-face containing a periodic array of strip cracks, for which good agreement between the exact theory and the above low frequency model has been reported by Angel and Achenbach [4].
In the first case, the reflection and transmission coefficients for a layer of thickness t are given by
(9)
(10)
where the subscripts "0" and "1" refer to the original and interface materials, which have densities p, ultrasonic velocities v, wavevectors k, and acoustic impedances Z
=
pv.This exact solution should be compared to the quasi-static result, obtained by substituting into Eqs. (5) and (6) the values
(11)
138 J.-M. BAlK AND R. B. THOMPSON
where the C represent the elastic stiffness tensor component Cll. After algebraic manipulations [16]. the result is
2
2 2 Zo -ZI jk .t ( 2Z Z )
R
=
[1+
jk .t - (k 1) /2] ______ ~I~ __ ~0~I~ ___________ (13)o 2 2
2 mw2 Zo
+
ZI1-(kI1) /2
+
~+
j(kI1) ( 2ZoZI ) o1
+
f:2
Comparison to Eqs. (9) and (10) reveals that the exact result is
recovered in the limits kI1«I. ko1«I. and w 1m74K«I. Thus. for this particular case. the quas -static model has been shown to be equivalent to the exact solution in the long wavelength limit.
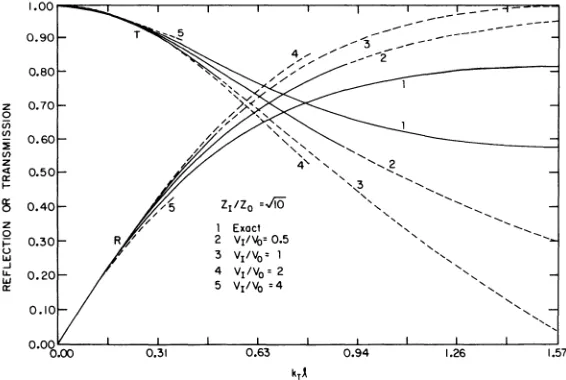
Figure 3 presents a numerical comparison of the predictions of the quasi-static model and the exact solution for the ratios of layer to host impedance of ZI/Zo ~ 10 and 101/2 • Although Z /Zo fully deter-mines the reflection and transmission coefficients In the exact theory. vr/vo must also be specified to define the quasi-static solution. as can be seen from the substitution of C - Zv and p - Z/v in Eqs. (11) and (12). This dependence on v as well as Z occurs because the layer thickness must be much less than the wavelength in either medium in
1.00
0.90
0.80
z 0.70
0
iii
!!! 0.60
~
en
z
<t 0.50
a:
I-25 0.40
z
0
~ 0.30
u
'"
...J
IL 0.20
'"
a:0.10
0.0'5.00 0.31
Zl/Za .JiO
1 Exacl 2 VI/~' 0.5
3 VI/Vo' 1 4 VllVa' 2 5 VI/Vo·4
0.63 0.94
---
--1.26
[image:6.482.78.422.61.225.2] [image:6.482.99.382.383.573.2]order for the quasi-static solution to give accurate results. For each value of ZI/Zo' quasi-static solutions are plotted for vI/vo - 0.5, I, 2, 4, chosen to represent the range which might commonly be encoun-tered. The exact theory is shown for O( &r1( w/4. Each approximate solution has a solid and a dashed portion. The solid portion ends when (kol)2 < 0.1(w/4)2 or (kl l)2 < 0.1(w/4)2 or Imw2/4KI< 0.1. Violation of any of these conditions would place the quasi-static assumptions in question. The dotted line extends until one of the three conditions is violated with 0.1 replaced by 1.0. As in Fig. 2, the extrapolation of the quasi-static theory indicated by the dashed segments indicates trends but is not quantitatively accurate.
The errors depend on both ZI/Zo and vI/vo' Errors generally increase as vI/vo increases for fixed kll because kol also increases. Consequently the assumption that the layer is thin with respect to the wavelength in the original medium is violated. This is also the reason that the higher vI/vo curves are truncated at lower kl l.- Within the expected region of accuracy indicated by the solid portion of the curves, the quasi-static solution provides a good approximation to the exact result.
INTERFACIAL STIFFNESSES FOR SEVERAL SPECIAL CASES
The interfacial stiffness, K, can be obtained from the extra displacement 61 as specified by Eq. (1). Solutions for 61 are
available for a wide variety of crack geometries [1], and these have been reviewed in the present context by the authors [16]. Selected results are presented below.
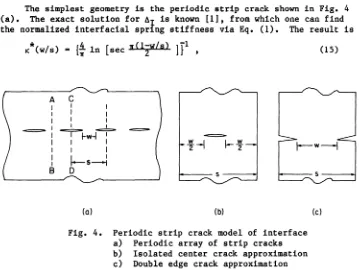
The simplest geometry is the periodic strip crack shown in Fig. 4 (a). The exact solution for 6
1
is known [1], from which one can find the normalized interfacial spr ng stiffness via Eq. (1). The result isK*(W/S) - {; In [sec v(lZW/s )
III ,
(15)A C
I I I
I I I
I I I
I I I
I
-=;==-I-w-I
~ I I II I I
\--w--l
I
I-s-l
B 0
(a) (b)
Fig. 4. Periodic strip crack model of interface a) Periodic array of strip cracks b) Isolated center crack approximation c) Double edge crack approximation
[image:7.482.61.420.369.639.2]140 ELASTIC COMPLIANCE OF INTERFACES
10·~----~---r---~---'----v--'
CI) 10' CI)
ILl
Z
LL. LL.
~
CI) t!)
z
if
CI)
o
ILl
N 10·
:i
«
=a:
~ z
- - - CENTER CRACK --- EDGE CRACK
- - INFINITE ARRAY CRACK
,
/
,
10-' 0~----~----~---0~.6---~----~1.0
wjs
Fig. 5. K* versus wls for periodic array of strip cracks. Solid line - exact result, dashed lines - center and edge crack approximations.
where K*
=
sK/E', E' - E/(1-v2) for the desired plane strain condition near the crack tip, E is Young's modulus,v
is Poisson's ratio, and w and s are the contact widths and separations.It is useful to consider two approximations to the periodic array of slits. These are the isolated center crack and the double edge crack in a strip of finite width, as shown in Figs. 4b and 4c. These may be thought of as approximate unit cells of the periodic structure with the only difference being the boundary conditions on the vertical faces. Figure 5 shows a comparison of K* based on these approximations (broken lines) to that predicted by Eq. (15) (solid lines). One
[image:8.482.126.349.73.388.2]K*
+ 4 ln (2s/nw) when w/s + 0 (16)and
2
K*
+ ----=~-....,...2 when w/s + 1n [1-(w/s)]
(17)
In the intermediate range of w/s, the deviation between the greater of the
K*
predicted from the approximate models and the exact solution is not more than 10%. This result suggests that the isolated crack models can be used as an approximation for some specific cases whose exact solutions are difficult to obtain, such as a 3-D array of cracks which will be discussed later.By the same approach, the K values for Mode II (in-plane shear)
are exactly the same as the previous Mode I case. For Mode III (out-of-plane shear) loading, however, the
K*
values should be the same for all three models and emerge to the exact one from the crack array model, since the boundary conditions are simultaneously equal in thistype of loading. It should be noted, however, that in determining the K value Et must be replaced by l~v' which is equal to twice the shear modulus.
For interfaces containing contacts, cracks, or inclusions with finite lateral dimensions, the general solutions for an array of discontinuities is more difficult to obtain. However, a number of special cases are known [16] which are valid in limits in which the discontinuities are non-interacting. Fortuneate1y, these cases corres-pond to a number of problems of practical interest.
Consider first the case of sparse contacts. By analogy to the strip case, the tensile response of a small circular contact (large circumferential crack) in a cylindrical rod should provide a good approximation. The result is
K
=
EtNw/2 (18)where w is now the diameter of the contact, N is the number of contacts per unit area, and Et is defined as before. The same result can be deduced from the compressive response of a sharp edged or spherical punch pressed into an elastic half-space [16]. The result is decreased by n/4 for a uniform pressure punch. The uniform pressure punch
problem can be easily extended to the case of an elliptical contact, with the result
K .. n2EtNb/8 1n(4b/a), (19)
where a and b are the minor and major semi-axes of the contact. Equa-tion (19) is an approximaEqua-tion of the exact result for uniform pressure contact. For a circular contact, it provides an overestimate of 10%. In comparison to the sharp edged or spherical punch, or equivalently Eq. (18), it provides an underestimate of 11%. At greater el1iptic-ities, the error decreases, becoming indistinguishable on the scale of typical graphs when b
>
5a.142 J.-M. BAlK AND R. B. THOMPSON
IC
-T T -1
ell e33
[(1-\1) -
+
2\1 - - ] (20)all all
where a1 and a2 - a 3 are the semi-axes of the spheroidal inclusions and
eij is an equivalent inclusion strain which depends of the ellipticity and moduli of the inclusion. Figure 6 presents a plot of ~/NVIIC versus
the normalized shear modulus ~*/~ for various ellipticities. al/a3•
Here ~* is the inclusion shear modulus. ~ is the host shear modulus and
4 3
VI is the volume of a sphere circumscribing the spheroid (VI -
3
wa3 ).A
Poisson's ratio of1/3
is assumed in the calculation for both host and inclusion.The equivalent inclusion strains. eiI. in general must be obtained from the solution of a set of simultaneous linear equations. For the case in which the inclusions reduce to cracks. the problem greatly simplifies and Eq. (20) reduces to the form
IC .. 3E' /2ND3 (21)
It is important to note that the interfacial stiffness for an array of non-interacting contacts is proportional to N. the number density of contacts. while that of an array of inclusions (including cracks as a zero-modulus. zero-ellipticity limit) varies inversely as N. This implies that different procedures must be used to treat random distributions of these two classes of inhomogeneities.
LIMIT FOR CRACK (=%".1
0.10 0.20 0.30 0.40
oro
0.60 0.70 0.80 0.90 1.00JL*/JL
~ 4 3
*
[image:10.482.90.395.400.640.2]For non-interacting contacts, one should average the interfacial stiffness, weighted by the distribution of sizes,
..
Kcontact
=
I
dw (KIN) f(w)o (22)
where f(w) is the density of contacts per unit interface area per unit contact diameter and (KIN) is a stiffness per contact.
For non-interacting inclusions or cracks, it is not appropriate to use Eq. (22) because (KIN) is dependent on N. Therefore the stiffness per contact is not a meaningful concept. However, the compliance per contacts (KN)-l, is independent of N. This difference may be heuris-tically explained by the following argument. For a set of isolated contacts, imagine applying sufficient load to achieve a fixed addi-tional interfacial extension, AI. Doubling the number of contacts will clearly double the required force. On the other hand, consider a set of isolated cracks subject to a fixed load. It appears equally clear that doubling the number of cracks will double the extra exten-sion AI. In the former case, stiffnesses add. In the latter case, compliances add. The interfacial stiffness for a random distribution of inclusions cracks must therefore be computed according to the expression
-1
f(p)] (23)
where p symbolically represents the parameters of the inclusion and f is again the density distribution of those parameters per unit inter-face area.
SUMMARY
A quasi-static model for the ultrasonic transmission and reflec-tion at imperfect interfaces has been presented. The interface is represented by a distributed spring, determined by the change in static compliance of the medium with respect to one with a perfect interface, and a distributed mass, representing excess mass at the interface. Comparison of the model predictions to exact solutions illustrates the models accuracy at low frequencies. The spring stiffnesses can be derived from existing solutions for the elastic displacement of mate-rials containing cracks and inclusions under static load, as is illus-trated for several simple cases. ~pplications of the model to study the characteristics of partially contacting surfaces in several problem areas of current interest are identified.
ACKNOWLEDGEMENT
144 J.-M. BAlK AND R. B. THOMPSON
REFERENCES
1. Tada, H., Paris, P., and Irwin, G., The Stress Analysis of Cracks Handbook, (Del Research Corporation, St. Louis, 1973).
2. Thompson, R. B., Skilling, B. J., Zachary, L. W., Schmerr, L. W., and Buck, 0., Review of Progress in Quantitative Nondestructive Evaluation, Vol. 2, D. O. Thompson and D. E. Chimenti, Eds. (Plenum Press, NY, 1983) pp. 325-343.
3. Thompson, R. B., and Fiedler, C.
J.,
Review of Progress inQuantitative Nondestructive Evaluation, Vol. 3, D.
o.
Thompson and D. E. Chimenti, Eds. (Plenum Press, NY, 1984) pp. 207-215.4. Angel, Y. C., and Achenbach, J. D., "Reflection and Transmission of Elastic Waves by a Periodic Array of Cracks," submitted for publication.
5. Kendall, K., and Tabor, D., Proc. Roy. Soc. Lond. A., 323, 1971, pp. 321-340.
6. Haines, N. F., Berkeley Nuclear Laboratories RD/B/N 4744, 1980. 7. Wooldridge, A. B., Revue du Cethedec, 17e annee, 4e trimestre,
1980-NS80-2, 1980, pp. 233-244.
8. Thompson, R. B., Fiedler, C. J., and Buck, 0., "Inference of Fatigue Crack Closure Stresses from Ultrasonic Transmission Measurements," in Nondestructive Methods for Material Property Determination, C. Ruud, Ed. (Plenum Press, NY, in press). 9. Buck, 0., Thompson, R. B., and Rehbein, D. K., "Interaction of
Ultrasonic Waves with Simulated and Real Fatigue Cracks," Review of Progess in Quantitative Nondestructive Evaluation, Vol. 4, D. O. Thompson and D. E. Chimenti, Eds. (Plenum Press, NY, in press).
10. Buck, 0., and Thompson, R. B., "Ultrasound Interaction with Partially Closed Fatigue Cracks," to be published in Proceedings of Fatigue 84, Second International Conference on Fatigue and Fatigue Thresholds, Sept. 3-7, 1984, Birmingham, U.K.
11. Tattersall, H. G., J. Phys. D, Applied Physics 6, 1973, pp.
819-832.
-12. Alers, G. A., and Graham, L. J., 1975 Ultrasonics Symposium Proceedings (IEEE, NY, 1975) pp. 579-582.
13. Alers, G. A., and Thompson, R. B., 1976 Ultrasonics Symposium Proceedings (IEEE, NY, 1976) pp. 138-192.
14. Rehbein, D. K., Smith, J. F., and Thompson, D.O., Nondestructive Evaluation: Application to Materials Processing, O. Buck and S. M. Wolf, Eds. (ASM, Philadelphia, 1984) pp. 155-160.
15. Achenbach, J. D., and Norris, A. N., J. Nondestr. Eval. 3, 1982,
pp. 229-239.
-16. J.-M. Baik and R. Bruce Thompson, "Ultrasonic Scattering from Imperfect Interfaces: A Quasi-Static Model," submitted for publication.