This is a repository copy of
Mass-loaded spherical accretion flows
.
White Rose Research Online URL for this paper:
http://eprints.whiterose.ac.uk/1248/
Article:
Pittard, J.M., Hartquist, T.W., Ashmore, I. et al. (3 more authors) (2004) Mass-loaded
spherical accretion flows. Astronomy and Astrophysics, 414 (2). pp. 399-408. ISSN
0004-6361
https://doi.org/10.1051/0004-6361:20034134
[email protected] https://eprints.whiterose.ac.uk/ Reuse
See Attached
Takedown
If you consider content in White Rose Research Online to be in breach of UK law, please notify us by
A&A 414, 399–408 (2004)
DOI: 10.1051/0004-6361:20034134 c
ESO 2004
Astronomy
&
Astrophysics
Mass-loaded spherical accretion flows
J. M. Pittard
1, T. W. Hartquist
1, I. Ashmore
1, A. Byfield
1, J. E. Dyson
1, and S. A. E. G. Falle
21 School of Physics and Astronomy, The University of Leeds, Woodhouse Lane, Leeds, LS2 9JT, UK 2 Department of Applied Mathematics, The University of Leeds, Woodhouse Lane, Leeds, LS2 9JT, UK
Received 29 July 2003/Accepted 17 October 2003
Abstract. We have calculated the evolution of spherical accretion flows undergoing mass-loading from embedded clouds through either conduction or hydrodynamical ablation. We have observed the effect of varying the ratios of the mass-loading timescale and the cooling timescale to the ballistic crossing timescale through the mass-loading region. We have also varied the ratio of the potential energy of a particle injected into the flow near the outer region of mass-loading to the temperature at which a minimum occurs in the cooling curve. The two types of mass-loading produce qualitatively different types of behaviour in the accretion flow, since mass-loading through conduction requires the ambient gas to be hot, whereas mass ablation from clumps occurs throughout the flow. Higher ratios of injected to accreted mass typically occur with hydrodynamical ablation, in agreement with previous work on wind-blown bubbles and supernova remnants. We find that mass-loading damps the radiative overstability of such flows, in agreement with our earlier work. If the mass-loading is high enough it can stabilize the accretion shock at a constant radius, yielding an almost isothermal subsonic post-shock flow. Such solutions may be relevant to cooling flows onto massive galaxies. Mass-loading can also lead to the formation of isolated shells of high temperature material, separated by gas at cooler temperatures.
Key words.accretion, accretion disks – shock waves – instabilities – ISM: kinematics and dynamics – galaxies: cooling flows
1. Introduction
Accretion on interstellar and even intergalactic scales is of relevance in a variety of astrophysical sources including ac-tive galactic nuclei surrounded by stellar clusters (e.g., David et al. 1987) and cooling flows onto massive galaxies at the centers of clusters of galaxies (e.g., Fabian 1994). David et al. (1987) initiated a program to investigate spherically sym-metric mass-loaded hydrodynamic accretion and outflow in ac-tive galactic nuclei. Toniazzo et al. (2001) considered rotating, magnetized mass-loaded accreting flows towards a massive ob-ject embedded in a cluster. The work of Toniazzo et al. (2001) was restricted to isothermal flows. Though that of David et al. (1987) included a detailed treatment of the radiative heat-ing and coolheat-ing of gas, plenty of scope for a broader explo-ration of the classes of flow solutions that arise in radiative, mass-loaded accretion problems remains.
In this paper we consider a broad range of parameter space in order to identify the different generic types of radiative, mass-loaded accretion flows. In order to keep the number of free parameters to a manageable number (3), in this paper we restrict attention to nonrotating spherical hydrodynami-cal accretion onto point sources. In subsequent work, we will
Send offprint requests to: J. M. Pittard, e-mail:[email protected]
investigate how the use of more complicated (or realistic) grav-itational potentials alters the nature of the solution types.
In Sect. 2, we present the equations that were solved and define the dimensionless parameters that specify the models. Numerical results for conductively mass-loaded and ablatively mass-loaded flows appear in Sect. 3. Some solutions show mul-tiple shock structures resulting in well-defined shells of sub-sonically moving gas separated by regions of supersonic infall. In some flows substantial regions of roughly isothermal gas exist. Section 4 concludes the paper and contains some spec-ulations on the possible relevance of the solutions with large nearly isothermal regions for cooling flows accreting onto mas-sive galaxies at the centers of clusters of galaxies.
2. The numerical model
spatial representation of the fluid variables allows this code to resolve flow patterns on significantly cruder grids than would be required by other types of numerical methods. The fluid equations are formulated as a Lagrangian (fluid frame) calcu-lation followed by a remap of the conserved quantities onto the original grid.
Radiative cooling is handled by the method of operator splitting and an unconditionally stable implicit scheme (see Strickland & Blondin 1995). At unresolved interfaces between hot gas and denser cold gas, the rate of energy loss of a given cell due to radiative cooling is restricted to the minimum from the neighbouring cells. This procedure “resolves” the rapid cooling layer at the rear of radiative shocks.
The outer grid boundary is specified as constant inflow, while reflecting conditions were employed at the inner bound-ary. To obtain high resolution at the inner boundary with maxi-mum efficiency, the size of each grid cell increases by 3% from the inner boundary outwards. The grid resolution was adjusted such that about 150 cells were typically present between the inner boundary and the radius of the accretion shock. With this constraint, the width of the cell adjacent to the inner bound-ary usually varied between 10−5and 10−3. Resolution studies
show that in most regions of parameter space the radius of the outermost accretion shock, and the stability properties of the flow, are unchanged when calculations are performed at higher resolution using either constant or expanding cell sizes. In cal-culations with multiple accretion shocks and shells (see, e.g., Fig. 8), the position of some of the inner shells can be slightly sensitive to the resolution. However, in this work our main goal is to determine the general stability and flow features as a func-tion of parameter space. For this study our adopted grid layout is ideal, given that the outer accretion shock can have a large radius when cooling is weak.
Computation of the flow near the inner grid boundary was accomplished through the specification of ghost cells that con-tain identical hydrodynamic variables to those in the nearest grid cell, but with reversed velocities (i.e. reflecting). Ghost cells at the outer grid boundary were assumed instead to have velocities matching the free-fall speed from infinity, and densi-ties and pressures specified by the mass-flux and ambient tem-perature constraints.
The inner boundary was positioned at r=0.3h in all of our runs, where the scale height h (see Sect. 2.1) of the embedded clouds responsible for mass-loading was set to h=1.0. For any spherically symmetric simulation, a lower boundary displaced from r =0 is demanded by the numerics. Tests with the inner boundary positioned closer to the symmetry point reveal that as in the resolution tests, the stability properties and general flow structure are generally fairly insensitive to this change. In some cases a reduction in rmin requires a corresponding
in-crease in T′
m for similar stability properties to be obtained,
though in other cases it does not. In the case of models with multiple accretion shells, only the position of the inner shell and the thickness of the cooling zone adjacent to the boundary were seen to change with a reduction in rmin.
The dynamics are described by the standard hydrodynami-cal equations for spherihydrodynami-cally symmetric flow,
∂ρ ∂t +
1
r2
∂(r2ρu)
∂r =q, (1)
∂(ρu)
∂t +
1
r2
∂(r2ρu2)
∂r =−
∂P
∂r +ρg, (2)
∂ ∂t
"1
2ρu
2+ P
(γ−1)
# + 1 r2 ∂ ∂r "
r2ρu 1
2u
2+ γ
(γ−1)
P
ρ
!#
= k
µmH
qT0
(γ−1)−Λ +ρgu, (3) together with an equation of state,
P= ρkT
µmH·
(4)
q is the mass-loading rate per unit volume, and the other
vari-ables have their usual meanings. For our exploration of param-eter space, we choose a generic cooling function defined by
Λ =b T−1/2+T
1/2
Tm !
ρ2, (5)
for temperatures above the ambient temperature T0, which was
set to 0.01 Tm. We do not allow gas to cool below T0. The
minimum of the cooling term occurs at T = Tm. More
realis-tic cooling functions will be considered in future work where specific objects will be modelled.
We also assumed g = −GM/r2, and fixed GM = 1,
k/(µmH) =1, andγ = 5/3 in all of our calculations. The
di-mensionless initial infall speed at the lower boundary was thus
u = √2/0.3 =2.58. The mass flux of the inflow at the outer boundary was specified as ˙M =1. With these assumptions, a cooling timescale can be defined by
tc=
T/(γ−1)
bρ(T−1/2+T1/2/T m)·
(6)
2.1. The mass injection rate
We have considered two distinct forms of mass-loading. For conductively-driven mass-loading we set
q=qce−r/h (T >Tm),
q=qc T
Tm
5/2
e−r/h (10−2Tm<T <Tm),
q=0 (T =10−2Tm), (7)
following Cowie & McKee (1977). At low temperatures, mass loading is so weak that the precise cutofftemperature is unim-portant. In contrast, the saturation temperature depends on many factors, including the density of the ambient medium, the size of the clouds, and the magnetic field stength, while the temperature dependence of saturated mass-loading depends on the Mach number of the saturated zone, though is near unity. For simplicity, we have assumed that the temperature for the onset of saturation is equal to Tm. Additional reasoning for our
[image:3.595.316.567.118.258.2]J. M. Pittard et al.: Mass-loaded spherical accretion flows 401
For mass injection by hydrodynamic ablation, we set
q=qaMa4/3e−
r/h,
(8)
where Mais equal to the Mach number for subsonic flow and
is constant and equal to unity for supersonic flow (Hartquist et al. 1986). For subsonic flow, hydrodynamic mixing occurs as a result of the well-known Bernoulli effect, and leads to a vol-ume mass injection rate proportional to Ma4/3. For supersonic
flow, mixing occurs largely as a result of a low pressure region over the reverse of the clump, “shadowed” from the flow. In this case the mass injection rate is Mach number dependent.
2.2. Non-dimensional parameter space
In our calculations the unit of length is h, the unit of time is h3/2/(GM)1/2, the unit of mass is ˙M h3/2/(GM)1/2, and the
unit of temperature is GM/h. We can non-dimensionalize qa,
qc, and Tmto:
q′a≡ h
3
˙
Mqa, (9)
q′ c≡ h3 ˙ M GM h
−5/2 1
Tm !−5/2
qc, (10)
Tm′ ≡ h
GMTm. (11)
We define
t′c≡ 1
(γ−1)(1+1/T′
m)b
· (12)
Thus,
b= 1 (γ−1)(1+1/T′
m)tc′·
(13)
Our free parameters are T′
m, tc′, and qaor qc. A total of 54 runs
were initially computed to explore our 3-dimensional parame-ter space. For the conductively-driven mass-loading, the accre-tion flow was investigated for the 27 possibilities allowed for by the following values:
Tm′ = 0.1,1,10
t′c = 0.1,1,10
q′c = 0.1Tm5/2,Tm5/2,10Tm5/2.
With mass injection by hydrodynamic ablation, the accretion flow was investigated with the following combinations of val-ues:
Tm′ = 0.1,1,10
t′c = 0.1,1,10
q′a = 0.1,1,10.
After reviewing the evolution of runs on these parameter-space grids, further regions of parameter space were investigated as appropriate.
Since we set GM = 1, the infall speed on the hydrody-namic grid is constant at a given radius for all of these runs.
Thus by adjusting T′
m, we can effectively simulate different
cluster masses through varying the horizontal displacement of the cooling curve. High values of Tm′ simulate low mass
clus-ters, and vice versa. t′cvaries the ratio of the cooling timescale
to the dynamical timescale. Low values of t′care associated with
weak cooling. Finally, q′
aand q′cset the degree of mass-loading.
In the following section we refer to accreted mass as that which has fallen or is falling into the gravitational potential. In the absence of mass-loading this would correspond to all of the mass in the potential. We similarly refer to injected mass as that which is mass-loaded into this flow. Our initial conditions have purely accreted mass on the grid, with mass injection being switched on at t=0.
3. Results
3.1. Conductively-driven mass-loading
For the conductively mass-loaded runs, the outer boundary was positioned at the point where the Mach number of the accreting flow was about 3. This ensured that the flow remained isother-mal during gravitational compression, and that the Mach num-ber profile of the pre-shock flow was also constant with time. For large values of T′
mand t′c(e.g., Tm′ =10, t′c≥1), the
post-shock gas is inefficient at cooling and remains highly pressur-ized, and these conditions thus result in the accretion shock expanding to large radii.
We found that for most of the calculated runs, the accretion shocks were subject to the well-known radiative overstability. An example of this is shown in Fig. 1. The amplitude of this in-stability is highly dependent on the amount of radiative cooling and mass-loading in each particular run. For Tm′ =0.1, t′c=10,
and q′c=0.1 the radius of the accretion shock expands to≈35,
while for T′
m = 1, t′c = 0.1, and q′c = 1 it oscillates around
r≈0.34. We also found that while increasing the mass-loading generally leads to a smaller accretion shock radius, this is not always the case.
Due to the large number of runs, we will concentrate on those that display interesting behaviour, such as those where the radiative overstability is damped, or even completely ab-sent. Such behaviour tends to occur when the cooling timescale is long compared to the mass-loading timescale, in agreement with simulations for planar flows (Pittard et al. 2003), and here and for cases described in Sect. 3.2 we have expanded our ini-tial parameter study in the appropriate directions.
Figures 2 and 3 show results for a run in which the oversta-bility is strongly damped, but not quite absent. If the ratio of the cooling timescale to the mass-loading timescale is increased by a further factor of 10, the overstability is completely damped, as shown in Fig. 4.
With Tm=0.1, tc′=10, q′c=100, the overstability is again
0 5 10 15 20 25 0.4
0.6 0.8 1.0 1.2
radius
time
0 5 10 15 20 25
0.00 0.05 0.10 0.15 0.20 0.25 0.30 0.35
Minj
/M
acc
[image:5.595.103.260.81.328.2]time
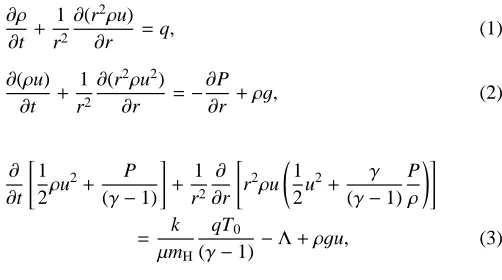
Fig. 1. The radiative overstability of a spherical accretion shock with
cooling and conductively-driven mass-loading. The dimensionless pa-rameters for this calculation were: T′
m = 1, t′c = 1, q′c = 1, which correspond to the temperature at minimum cooling, the cooling time, and the mass-loading coefficient respectively – see Sect. 2. The top panel shows the time evolution of the shock radius, while the bottom panel shows the ratio of the injected mass to the accreted (i.e. non-injected) mass (in all our figures this ratio is integrated over radii from the inner boundary to the outermost shock, i.e. the accretion shock). Once the system is steadily oscillating, the injected mass is about 1/5 of the accreted mass. The initial bounce in such runs is always higher than subsequent bounces (see, e.g., Imamura et al. 1984). There is no sign of higher order modes.
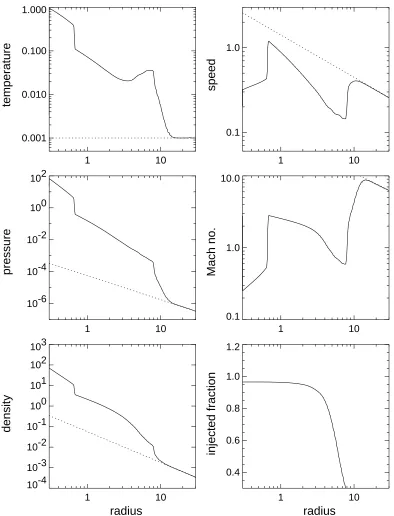
The results shown in Fig. 7 are for the model with Tm′ =0.1,
t′c = 1, and q′c = 3162. They bear some similarity to those
shown in Fig. 6, except that here the post-shock flow rapidly cools to the ambient temperature before travelling very far downstream from the accretion shock. The cold gas is reac-celerated by the gravitational force of the central mass, and the density enhancement, created by the mass-loading that takes place in the shell of hot gas, is reduced. Both the density and the flow speed approach their free-fall values by the time the in-ner shock is encountered. The mass-loading shell at r≈4−4.7 maintains a steady position, despite the lack of pressure sup-port from interior gas. The rapid injection of slowly moving gas keeps the average infall speed low. The shell remains fixed in position, but there is continual subsonic flow through it.
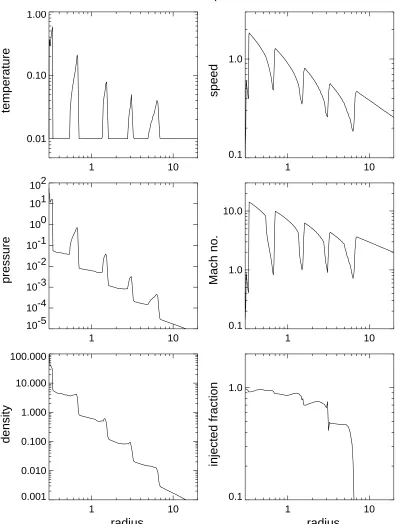
Profiles in Fig. 8 show analogous structures, though for this model there are 4 “unsupported” shells. The primary diff er-ence in the parameters for this model and the others is that a high value of q′
chas been adopted. The radii bounding spherical
shells of hot gas in this calculation are 0.30−0.33, 0.54−0.70, 1.39−1.57, 2.83−3.2, and 5.0−6.7. It seems likely that a slight adjustment in the run parameters could generate 5, 10, or even 20 shells of hot gas.
0 5 10 15 20 25 30 35 0.30
0.40 0.50 0.60 0.70
radius
time
0 5 10 15 20 25 30 35 0.0
0.2 0.4 0.6 0.8 1.0
Minj
/M
acc
[image:5.595.364.518.85.331.2]time
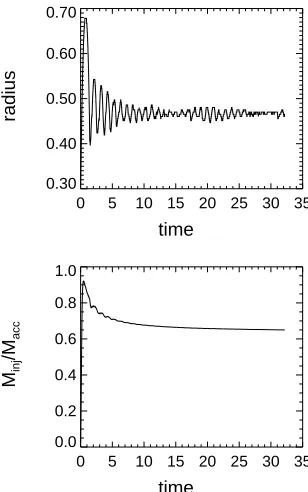
Fig. 2. As Fig. 1 but with T′
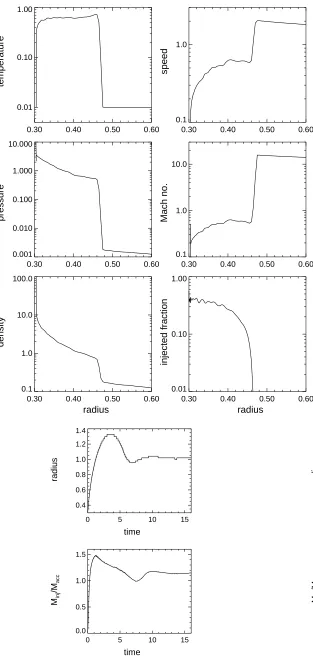
m=1, t′c=1, and q′c=10. Here the cooling timescale exceeds the mass-loading timescale and the radiative over-stability is largely damped. At late times the injected mass is about 2/3 of the accreted mass (i.e. the injected mass is not quite the dominant component).
3.2. Mass-loading through hydrodynamic ablation
Unlike models described in the previous section, in which mass-loading from embedded clumps occurs through heat con-duction, in models for which ablation is important, mass-loading is not limited to hot regions of the flow. Therefore, it is not surprising to find that the results are characterized by much higher ratios of injected to accreted mass. Since this leads to higher flow densities, and stronger cooling, in many of the runs the radii of the accretion shocks are small. We will focus mostly on the runs that display interesting and unusual features.
For flows mass-loaded by ablation we find that if the timescale for cooling is long, the post-shock flow remains highly pressurized and drives the accretion shock out of the gravitational potential. If the cooling timescale is moderate and the mass-loading rate is low, the well-known radiative oversta-bility occurs. If mass-loading is somewhat more important, the overstability tends to be damped, and the radius of the accre-tion shock can be stabilized, to a lesser or greater degree. So in many regards mass-loading by ablation gives results similar to those for mass-loading by conduction, including cases where stable, “unsupported”, mass-loading shells occur (cf. Figs. 7 and 8). However, we were unable to find cases where multiple mass-loading shells occur.
J. M. Pittard et al.: Mass-loaded spherical accretion flows 403
0.30 0.40 0.50 0.60
0.01 0.10 1.00
temperature
0.30 0.40 0.50 0.60
0.1 1.0
speed
0.30 0.40 0.50 0.60
0.001 0.010 0.100 1.000 10.000
pressure
0.30 0.40 0.50 0.60
0.1 1.0 10.0
Mach no.
0.30 0.40 0.50 0.60
0.1 1.0 10.0 100.0
density
radius
0.30 0.40 0.50 0.60
0.01 0.10 1.00
injected fraction
[image:6.595.31.344.80.740.2]radius
Fig. 3. Radial profiles at t=24 for the run shown in Fig. 2. The bottom right panel shows the frac-tion of injected mass to the total mass, as a func-tion of radius. If the density of injected material is equal to the density of accreted material this pa-rameter would have a value of 0.5, whereas if the density of injected material significantly exceeds the density of accreted material this parameter ap-proaches unity. The flow is from right to left in these figures.
0 5 10 15
0.4 0.6 0.8 1.0 1.2 1.4
radius
time
0 5 10 15
0.0 0.5 1.0 1.5
Minj
/M
acc
time
Fig. 4. As Fig. 1 but for T′
m = 1, t′c = 10, and q′c = 10. Here the radiative overstability is completely damped, and at late times there is 15% more injected mass than accreted mass behind the shock front.
0 20 40 60 80 100 1
2 3 4
radius
time
0 20 40 60 80 100 0.0
0.5 1.0 1.5 2.0
Minj
/M
acc
time
Fig. 5. As Fig. 1 but for T′
[image:6.595.341.482.508.731.2]1 2 3 4 0.01
0.10 1.00
temperature
1 2 3 4
0.1 1.0
speed
1 2 3 4
10-6 10-4 10-2 100 102
pressure
1 2 3 4
0.1 1.0 10.0
Mach no.
1 2 3 4
0.001 0.010 0.100 1.000 10.000 100.000
d
ens
ity
radius
1 2 3 4
0.01 0.10 1.00
injected fraction
[image:7.595.115.512.77.599.2]radius
Fig. 6. Radial profiles at t=100 for the run shown in Fig. 5. Note that the inflow becomes supersonic shortly after passing through the accretion shock, before encountering another shock much closer to the inner boundary. The density of injected material exceeds the density of accreted material for r∼<2.
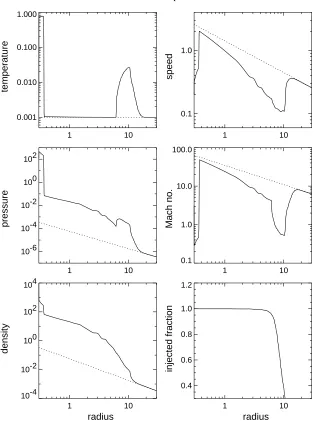
of the mass-loading. In Fig. 9 where cooling is very weak, the temperature of the flow is controlled by the combined effects of mass-loading and compressional heating. The initial onset of mass-loading causes friction, which heats the cold ambient flow (r ≈ 14 to r ≈ 8). However, continued mass-loading reduces the average thermal energy per particle, leading to a slight drop in temperature (r ≈ 8 to r ≈ 4). Compressional heating then raises the temperature of the gas (from r ≈ 4 to
r ≈ 0.7), prior to an inner shock and further compressional heating.
J. M. Pittard et al.: Mass-loaded spherical accretion flows 405
1 10
0.01 0.10 1.00
temperature
1 10
0.1 1.0
speed
1 10
10-6
10-5
10-4
10-3
10-2
10-1
100
101
pressure
1 10
0.1 1.0 10.0 100.0
Mach no.
1 10
0.001 0.010 0.100 1.000 10.000 100.000
density
radius
1 10
0.1 1.0
injected fraction
[image:8.595.85.483.75.598.2]radius
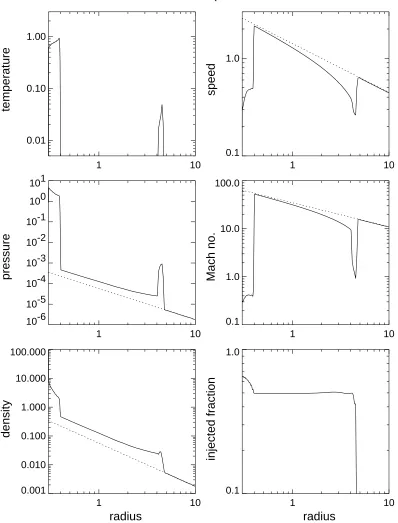
Fig. 7. Radial profiles at t=55 for T′
m=0.1, t′c=1, and q′c=3162. The accretion shock at r≈4.7 has a perfectly stable position at late times. As in the Fig. 6 case the inflow again becomes supersonic between the accretion shock and the inner boundary, and passes through another shock at small radii. The dotted lines show the initial conditions.
4. Discussion
The most striking structures appearing in the results presented in the previous section are the well-separated regions of sub-sonic material behind multiple shocks in conductively mass-loaded flows for which the mass-loading parameter is large. The existence of extended isothermal regions in some of the models is nearly as notable.
The production of large isothermal regions in which most of the volume is filled by hot, radiating gas may be of relevance to recent observations of cooling flows onto the central massive
1 10 0.01
0.10 1.00
temperature
1 10
0.1 1.0
speed
1 10
10-5 10-4 10-3 10-2 10-1 100 101 102
pressure
1 10
0.1 1.0 10.0
Mach no.
1 10
0.001 0.010 0.100 1.000 10.000 100.000
density
radius
1 10
0.1 1.0
injected fraction
[image:9.595.115.512.75.599.2]radius
Fig. 8. Radial profiles at t=200 for the model with T′
m=1, t′c=10, and q′c=3162. After passing through each shock the flow reaccelerates towards the central mass. The heavy mass-loading that it experiences leads to its rapid cooling to the ambient temperature. These combine to cause the flow to become highly supersonic before it encounters the next mass-loading shell. The density enhancement of the flow increases through each of these encounters, such that near the inner boundary the flow is almost completely dominated by injected mass.
Figure 3 shows radial profiles of the density and temper-ature at t = 24 for the model specified by Tm′ = 1, t′c = 1,
and q′c = 10. A large region of nearly isothermal hot gas is
sharply bounded by much cooler gas. Figure 11 shows the dif-ferential luminosity distribution for the model; it shows con-siderable similarity to that of observed cooling flows (Peterson et al. 2003).
J. M. Pittard et al.: Mass-loaded spherical accretion flows 407
1 10
0.001 0.010 0.100 1.000
temperature
1 10
0.1 1.0
speed
1 10
10-6
10-4
10-2
100
102
pressure
1 10
0.1 1.0 10.0
Mach no.
1 10
10-4
10-3
10-2
10-1
100
101
102
103
density
radius
1 10
0.4 0.6 0.8 1.0 1.2
injected fraction
[image:10.595.87.481.82.598.2]radius
Fig. 9. Radial profiles at t =47 for T′
m =0.1, t′c =100, and q′a = 1.0. The mass loading in this calculation occurs through hydrodynamic ablation. The dotted lines illustrate the initial conditions.
responsible for cooling flows having the thermal structures that they do. Though we have focussed in this section on a model for which the mass-loading is driven by conduction, ablative mass-loading can in some cases lead to similar thermal struc-tures. As the mass-loading rate depends on cloud size and num-ber of clouds as well as the properties of the hot medium, high mass-loading rates may be possible even if the coefficient of conductivity is too small for the conductive heat transfer across the entire nearly isothermal region to occur on a timescale as short as the flow time through the region (e.g., Ettori & Fabian 2000).
In future work, we will construct more detailed and more realistic models of cooling flows.
1 10 0.001
0.010 0.100 1.000
temperature
1 10
0.1 1.0
speed
1 10
10-6 10-4 10-2 100 102
pressure
1 10
0.1 1.0 10.0 100.0
Mach no.
1 10
10-4 10-2 100 102 104
density
radius
1 10
0.4 0.6 0.8 1.0 1.2
injected fraction
[image:11.595.156.472.75.497.2]radius
Fig. 10. Radial profiles at t=16 for T′
m=0.1, t′c=100, and q′a=10. Mass loading occurs through hydrodynamic ablation. The dotted lines show the initial conditions.
0.1 1.0
1 10
dL/dT
T
Fig. 11. The differential luminosity distribution at t=24 for the model with T′
m=1, t′c=1, and q′c=10 (see also Figs. 2 and 3). The isobaric multiphase cooling flow model predicts that this function should be in-dependent of temperature, though recent observations have revealed a dearth of low-temperature emission. We have smoothed our data with a boxcar of width 3 bins.
References
Blondin, J. M., Kallman, T. R., Fryxell, B. A., & Taam, R. E., 1990, ApJ, 356, 591
Colella, P., & Woodward, P. R. 1984, J. Comput. Phys., 54, 174 Cowie, L. L., & McKee, C. F. 1977, ApJ, 211, 135
David, L. P., Durisen, R. H., & Cohn, H. N. 1987, ApJ, 313, 556 Ettori, S., & Fabian, A. C. 2000, MNRAS, 317, L57
Fabian, A. C. 1994, ARA&A, 32, 277
Hartquist, T. W., Dyson, J. E., Pettini, M., & Smith, L. J. 1986, MNRAS, 221, 715
Imamura, J. N., Wolff, M. T., & Durisen, R. H. 1984, ApJ, 276, 667 Peterson, J. R., Kahn, S. M., Paerels, F. B. S., et al. 2003, ApJ, 590,
207
Pittard, J. M., Arthur, S. J., Dyson, J. E., et al. 2003, A&A, 401, 1027 Pittard, J. M., Hartquist, T. W., & Ashmore, I. 2003, A&A, 408, 813 Strickland, R., & Blondin, J. M. 1995, ApJ, 449, 727
[image:11.595.66.299.538.703.2]