This is a repository copy of Microsimulation of Organised Car Sharing – Model Predications and Policy Implications..
White Rose Research Online URL for this paper: http://eprints.whiterose.ac.uk/2410/
Monograph:
Bonsall, P.W. and Kirby, H.R. (1979) Microsimulation of Organised Car Sharing – Model Predications and Policy Implications. Working Paper. Institute of Transport Studies, University of Leeds , Leeds, UK.
Working Paper 114
[email protected] https://eprints.whiterose.ac.uk/
Reuse
See Attached
Takedown
If you consider content in White Rose Research Online to be in breach of UK law, please notify us by
White Rose Research Online
http://eprints.whiterose.ac.uk/Institute of Transport Studies University of Leeds
This is an ITS Working Paper produced and published by the University of Leeds. ITS Working Papers are intended to provide information and encourage discussion on a topic in advance of formal publication. They represent only the views of the authors, and do not necessarily reflect the views or approval of the sponsors.
White Rose Repository URL for this paper: http://eprints.whiterose.ac.uk/2410/
Published paper
Bonsall, P.W. and Kirby, H.R. (1979) Microsimulation of Organised Car Sharing – Model Predications and Policy Implications. Institute of Transport Studies,
University of Leeds, Working Paper 114
Working Paper 114
July 1979
MICROSIMULATION OF ORGANISED CAR SHARING-
MODEL PREDICTIONS AND
POLICY IMPUCATIONS
by
Peter Bonsall & Roger Kirby
Working Papers are intended t o provide information and encourage discussion on a topic i n advance of formal publication. The work reported here was sponsored by
the Transport and Road Research Laboratory, but reports i n t h i s series represent only
Abstract
1. Introduotion
1 .I Aims of the study 1.2 Other studies
1.3
Sunanary of the model 2. Model Tests and Predictions2.1 Introduction
-
scope and purpose of the tests 2.2 The conduct of the tests2.3 Output indicators
3.
Description, Results and Interpretation of the Pivotal Model Run3.1
Introduction3.2 !Che target population 3.3 The applicants
3.4 The Match lists
3.5 The decisions to form arrangements
4.
!The Sensitivity Bnalyses4.1
Introduction 4.2 Results5.
Tests of the Organisational Structure of Car Shazing Schemes5.1
Introduction 5.2 Results6 . Tests of the Location and Intensity of Schemes
6.1
Introduction6.2 Descriptions of the target populations 6.3 Results of the tests of scheme location 6.4 Results of the tests of scheme intensity
7.
The Scenario Tests7.1
Introduction 7.2 Results8. Discussion and Conclusions
8 .I Main findings
8.2 Policy implications 8.3 Further research
-
ReferencesABSTRACT
BONSALL, P.W. (1979) Itiorosimulation of organised oar sharing
-
model predictions and policy implications. Leeds: Universityof Leeds, Inst. Transp. Stud., WP 114 (unpublished).
!Chis paper presents the results of a range of tests of organised car sharing schemes. The performance of the schemes is predictedusinga sophisticated microsimulation model. A
brief resume of the model is followed by a description of the tests and an analysis of their results. Conclusions are dram on the place of organised oar sharing within broader transport policies, the performance of the model when compared to the available empirical data and directions for public research.
!he tests here presented include: a series of sensitivity analyses; tests of organisational strategies for car sharing schemes; tests of schemes in a variety of locations and at a
variety of soales and finally a batch of tests which investigate the effect of major changes in the operating environment of car
MICROSIMULATION OF ORGANISED CAR SHARING
-
MODELMODEL PREDICTIONS AND POLICY IMPLICATIONS
1. INTRODUCTION
1.1 Aims of the study
The primary objective of this study, which wss funded by TRRL
on a contractual basis, was to provide a state of the art estimate
of the likely performance of organised car sharing schemes in Britain
The performance of schemes being expressed both operationally and
in terms of their effect on the transport system as a whole -
particularly their effect on public transport patronage and private
vehicle mileage.
It was hoped that some insight would be gained into the
likely scale of these effects and how they might vary with changes
in the nature of the schemes
-
changes in the location and sizeof the schemes and changes in their operating environment
-
theprice of petrol and the provision of incentives to car poolers for
example.
1.2 Other studies
Several studies have addressed themselves to the potential
market for organised work journey car sharing (Tomlinson and Kellett
1977,
Vincent and Wood1979,
Cambridge Systematics Inc1976,
Atherton et a1
1976)
but they have been concerned mainly with thepotential and theoretical impact of car sharing given present
journey-to-work patterns and characteristics. They have been able
to contribute little to the estimation of likely impact because
they could not estimate how many of the potential matches could or
would be realised. Another line of research has been concerned
- 2 -
response at the micro level (Marg&lilin-et al 1976, Dobson and Tischer
1976, Levin et a1 1978, Tomlinson and Kellett 1978, Hawker Siddeley
Dynamics
1977).
This attitudinal work has provided valuable insightsinto the likely behviour of individuals but it is, in itself, not
readily adapted for predictive purposes because it is concerned with
individuals rather than populations.
It was the aim of this project to bridge the gap between
theoretical modelling and attitudinal investigation by developing
a model which, while being based on the attitudes and consequential
decisions of individuals, could take into account the availability
and characteristics of potential partners and could thus predict
the impact of a carsharing scheme at both the micro and the macro
level. The form of model best suited to this task is microsimulation.
The resulting model seeks to represent the interactions between
individual decision makers and the manner in which an organised
car sharing scheme would operate.
1.3 Summary of the model
1.3.1 The model and its calibration are fully described elsewhere
(~onsall 1979b) but, for convenience, a summary is reproduced here.
The model is based on microsimulation, a technique of
computerised modelling within which the decision making process is
replicated for individual decision makers within the system. These
decision makers effectively become 'actors' within the modelled system.
The model is driven by Monte Carlo type sampling.
The simulation suite has three stages, each representing a
distinct process in the establishment of an organised car sharing
scheme. These three stages are represent.ed in figure 1.1. The
first stage is concerned with the scope and intensity of the scheme
being simulated and the decisions by members of the public to apply
to join it. The second stage deals with the mechanics of matching up
potential partners one with another. The third stage deals with the
Figure 1 .l. O U T L m STRUCTURE .OF SIMULATION SUITE
STAGE 11
Location, Nature and
Publicity for a given car sliming scheme.
STAGE I11
Unique Description of all tripmakers in
.
the oystemApplicants
without any
potential
I
I
ITJUMDUALS
'
DECISIONSON HOW TO REACT TO
PwI'ENTIAt
i'm1Z1'm
--
not satisfied with any
potantiel partners
decision to abandon STAGE I
transport system
?---
f
- -
I
INDMDUALS
'
T1EClSIOTJS givenTO JODt A CAR SHARTNG SCrnIE
i
An appendix t o t h e main model t r a n s l a t e s t h e performance of t h e scheme
i n t o i t s e f f e c t on c e r t a i n c r i t i c a l components of t h e t r a n s p o r t system.
1.3.2 Microsimulation models r e q u i r e , a s a fundamental i n p u t , a
d e s c r i p t i o n of each of t h e a c t o r s i n t h e system of i n t e r e s t . I n t h e
present case t h i s means a d e s c r i p t i o n of a l l 180,000 peak period t r i p
makers i n our study a r e a . Each of t h e s e i n d i v i d u a l s i s uniquely
i d e n t i f i a b l e by h i s i d e n t i t y number and t h e following c h a r a c t e r i s t i c s :
- i d e n t i t y of household t o which he belongs - l o c a t i o n of r e s i d e n c e ( 6 f i g u r e g r i d r e f )
-
l o c a t i o n of workplace ( 6 f i g u r e g r i d r e f ) - sex- age ( 3 age bands)
- employment category ( 3 t y p e s )
-
whether head of household - d r i v i n g l i c e n c e t e n u r e-
normal mode of t r a v e l t o work (7 modes, evening mode i s not constrained t o equal morning mode.'. 49 modalcombinations )
- whether c a r needed f o r business use - work hours
-
household telephone ownership-
number of household members with a d r i v i n g l i c e n c e-
number of household members without a d r i v i n g l i c e n c e - a random number seed f o r Monte Carlo sampling.The d e s c r i p t i o n s of t h e s e i n d i v i d u a l s were synthesised on t h e b a s i s
of combined p r o b a b i l i t i e s from a household survey (WYTCONSULT 1976)
and c o n t r o l t o t a l s from published census m a t e r i a l (OPCS a , b ) . The method of s y n t h e s i s i s described elsewhere (Bonsall and Champernowne,
1979).
1.3.3 The f i r s t s t a g e of t h e simulation s u i t e i t s e l f allows t h e model u s e r t o d e f i n e t h e s c a l e and l o c a t i o n of t h e c a r s h a r i n g scheme
t o be t e s t e d . This i s achieved by defining a ' t a r g e t population'
i n terms of t h e i r ~ s i d e n t i a l l o c a t i o n , work l o c a t i o n o r some
combination of t h e two. The u s e r i s a l s o a b l e t o s p e c i f y a ' t h r e s h o l d
of i n t e r e s t ' which may be taken t o r e p r e s e n t t h e i n t e n s i t y of an
a d v e r t i s i n g campaign conducted among t h e t a r g e t population.
1.3.4 A calibrated choice model then replicates the decisions by each individual member of the target population whether or not to
apply to join the postulated car sharing scheme. These choices are
represented by the evaluation of binary logit models for each member
of the target population. These models are regression transformations
of the form:
where Pn is the probability of that individual making a type
n application to join the scheme (the various types
of application being for pooling, driving or riding
during the mornings and /or evenings )
.
a. are the characteristics of the individual (see section 1.3.2)
1
x. are calibrated coefficients in
The calibration of the coefficients x. was on the basis of In
a field survey of expressed desire to join an organised car sharing
scheme. Details of the calibration procedure and the field surveys
are to be found elsewhere (Bonsall 1979a,b).
The value of Pn derived for each individual in the target
population is then compared with a random number drawn from a
rectangular distribution between o and 1. The ratio of Pn to this
number is taken to represent the individual's level of interest in
joining an organised car sharing scheme. This interest is then compared
with the 'threshold of interest' referred to in section 1.3.3 and if
the individual's interest surpasses the threshold then a type n
application from him is deemed made.
When all members of the target population have been considered
in this way, those deemed to have made applications are passed
on to the next stage of the simulation.
1.3.5 The next s t a g e of t h e simulation r e p r e s e n t s t h e processing by
t h e scheme o r g a n i s e r s of a l l a p p l i c a t i o n s received from t h e t a r g e t
population. This processing involves t h e p r e p a r a t i o n , f o r each
a p p l i c a n t , of a l i s t of those of h i s fellow a p p l i c a n t s whose home
l o c a t i o n , work l o c a t i o n , work hours and t y p e of a p p l i c a t i o n make him
a p o t e n t i a l t r a v e l l i n g companion. There wil1,of course,be some
a p p l i c a n t s f o r whom no p o t e n t i a l p a r t n e r s can be found.
1.3.6 The next s t a g e of t h e simulation r e p r e s e n t s t h e c o n s i d e r a t i o n
by each applicant,who has received a l i s t of p o t e n t i a l partners,of
t h e worth t o himself of e n t e r i n g an arrangement with any of t h o s e
p o t e n t i a l p a r t n e r s . This consideration i s on t h e b a s i s of a
c a l i b r a t e d u t i l i t y model of t h e form:
--
urn
=c
C an pm xm + epn+
feepaid n = l m = lwhere UAp i s t h e u t i l i t y of arrangement A t o person P
al...a n a r e c h a r a c t e r i s t i c s of t h e arrangement A ( s e e t a b l e 1 . 2 )
pl.. .pa a r e c h a r a c t e r i s t i c s of t h e person P ( s e e t a b l e 1 . 3 )
x 1 xnm a r e c a l i b r a t e d components of u t i l i t y a s s o c i a t e d with any person with c h a r a c t e r i s t i c m engaging i n
an arrangement with c h a r a c t e r i s t i c n.
eip...e a r e s t o c h a s t i c elements a s s o c i a t e d with t h e u t i l i t y nP
t o person P of an arrangement w i t h c h a r a c t e r i s t i c n.
feepaid i s t h e n e t sum of money, i f any, passing t o person P i n r e s p e c t of h i s p a r t i c i p a t i o n i n t h e scheme.
The c a l i b r a t i o n of t h e cumponents x was on t h e b a s i s on a
s e r i e s of l i n e a r r e g r e s s i o n equations using d a t a from a s p e c i a l survey.
The c a l i b r a t i o n proredure l e a v e s a r e s i d u a l term which we t a k e t o be normally
d i s t r i b u t e d and from which we sample t o impart a unique ( s t o c h a s t i c )
element t o each of our d e c i s i o n makers. The c a l i b r a t i o n process and
The simulation model i s based on t h e assumption t h a t each
applicant w i l l consider a l l t h e p o t e n t i a l p a r t n e r s on h i s l i s t and
w i l l evaluate t h e u t i l i t y t o himself of an arrangement with each of
them. If any arrangements have a p o s i t i v e n e t u t i l i t y t o a l l
p a r t i c i p a n t s ( a f t e r t h e exchange of any f e e s ) t h e n t h e d r i v e r w i l l
choose, from among them, t h a t one which has g r e a t e s t n e t u t i l i t y t o
him and t h a t arrangement i s deemed made.
The model proceeds through each of t h e a p p l i c a n t s i n t u r n
and r e p l i c a t e s t h e i r evaluation of t h e p o t e n t i a l t r a v e l l i n g p a r t n e r s
included on t h e i r l i s t .
1.3.7 The model does not attempt t o derive a system optimum but t o
optimise from t h e point of view of t h e individual decision makers ( i n
t h i s r e s p e c t it mirrors t h e r e a l world). Once two i n d i v i d u a l s have
contracted t o t r a v e l together t h e y a r e both out of t h e market t h e
model p r e d i c t i o n s w i l l t h e r e f o r e be a function of t h e o r d e r i n which
bargains a r e s t r u c k . I n t h e absence of any i n d i c a t i o n t o t h e c o n t r a r y ,
t h e model assumes t h a t bargains w i l l be s t r u c k i n a random order.
L3.8 The model t h u s has two s t o c h a s t i c elements ( t h e r e s i d u a l
term i n evaluation of u t i l i t i e s and t h e order i n which bargains
a r e s t r u c k ) and model r e s u l t s w i l l t h e r e f o r e vary depending on which
random number s t r i n g s a r e used. I n order t o reach an average r e s u l t
t h e model i s t h e r e f o r e run f i v e times during each t e s t and mean
values of t h e various i n d i c a t o r s a r e derived. ( A confidence i n t e r v a l
on t h i s mean i s a l s o produced).
2 MODEL TESTS AND PREDICTIONS
2 . 1 Introduction - scope and purpose of t h e t e s t s
The t e s t s reported on i n t h i s paper a r e many and v a r i o u s , t h e y
include at one extreme, s e n s i t i v i t y a n a l y s i s of t h e model and i t s
Broadly, t h e r e a r e four groups of t e s t . The f i r s t group comprises
a number of s e n s i t i v i t y t e s t s designed t o i n v e s t i g a t e t h e s i g n i f i c a n c e
of some of t h e assumptions made during t h e design and c a l i b r a t i o n of
t h e model s u i t e . The second group of t e s t s examine how t h e performance
of organised c a r s h a r i n g schemes a r e a f f e c t e d by t h e procedures
adopted during t h e formation of match l i s t s . The r e s u l t s of t h i s group
of t e s t s should t h u s provide p r a c t i c a l guidance f o r p o t e n t i a l c a r pool
o r g a n i s e r s . The t h i r d group of t e s t s i s concerned w i t h t h e l o c a t i o n
and i n t e n s i t y of t h e proposed e a r pooling schemes and should c o n t r i b u t e
t o t h e formation of p o l i c y on t h e design and l o c a t i o n of schemes.
The f i n a l group of t e s t s comprise a s p e c u l a t i v e a n a l y s i s of t h e probable
e f f e c t on c a r pooling schemes of changes i n t h e broader p o l i c y
environment
-
changes i n t r a n s p o r t c o s t s and parking-space i n c e n t i v e sf o r c a r poolers f o r example.
2.2 The conduct of t h e t e s t s
The g e n e r a l framework f o r t h e t e s t s r e p o r t e d on i n t h i s paper i s
adapted from t h e p i v o t a l method of s e n s i t i v i t y a n a l y s i s developed a t
Leeds i n a previous p r o j e c t (Bonsall e t a l , 1977). Within t h i s framework
we begin by d e f i n i n g a p i v o t a l model run
-
using t h e 'most l i k e l y 'value of model parameters and the'lbest estimate! values o f model c o e f f i c i e n t s .
Within t h e o t h e r r u n s , t h e model parameters and c o e f f i c i e n t s a r e
s y s t e m a t i c a l l y v a r i e d one by one
-
a l l o t h e r parameters and c o e f f i c i e n t sr e t a i n i n g t h e i r d e f a u l t values. P r e d i c t i o n s by t h e p i v o t a l model
a r e then i n v e s t i g a t e d i n some depth before being used a s t h e y a r d s t i c k
f o r a n a l y s i s of o t h e r model runs.
I n t h i s way t h e e f f e c t of v a r i a t i o n i n t h e v a r i o u s model parameters
and c o e f f i c i e n t s (some of which represent p o l i c y v a r i a b l e s ) can be
compared with one another i n magnitude and importance.
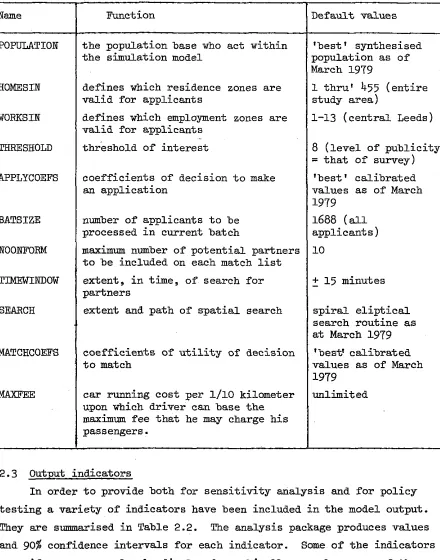
Table 2.1 l i s t s t h e model parameters and c o e f f i c i e n t s which w i l l
be t e s t e d i n t h e p r e s e n t paper, and shows t h e i r d e f a u l t values f o r use
TABLE 2.1: PARMETERS AND COEFFICIFLX";' OF THE SIMULATION MODEL
(AND DEFAULT VALUES THEREOF)
2.3 Output i n d i c a t o r s
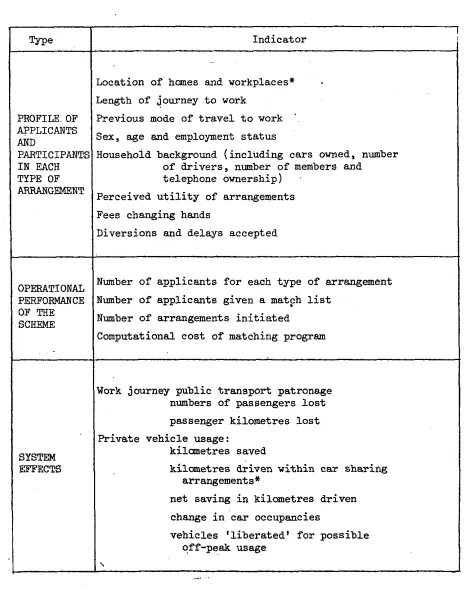
I n order t o provide both f o r s e n s i t i v i t y a n a l y s i s and f o r p o l i c y
t e s t i n g a v a r i e t y of i n d i c a t o r s have been included i n t h e model output. Name POPULATION HOMESIN WORKSIN THRESHOLD APPLYCOEFS BATSIZE NOONFORM TIMEWINDOW SEARCH MATCHCOEFS MAXFEE
They a r e summarised i n Table 2.2. The a n a l y s i s package produces values
and 90% confidence i n t e r v a l s f o r each i n d i c a t o r . Some of t h e i n d i c a t o r s
can, i f necessary, a l s o be displayed g r a p h i c a l l y on a base map of t h e Function
t h e population base who a c t within t h e simulation model
defines which residence zones a r e v a l i d f o r a p p l i c a n t s
defines which employment zones a r e v a l i d f o r a p p l i c a n t s
threshold of i n t e r e s t
c o e f f i c i e n t s of decision t o make
an a p p l i c a t i o n
number of a p p l i c a n t s t o be processed i n current batch
maximum number of p o t e n t i a l p a r t n e r s t o be included on each match l i s t
e x t e n t , i n time, of search f o r p a r t n e r s
extent and path of s p a t i a l search
c o e f f i c i e n t s of u t i l i t y of decision t o match
c a r running c o s t per 1/10 kilometer upon which d r i v e r can base t h e
maximum f e e t h a t he may charge h i s passengers.
study a r e a .
Default values
' b e s t ' synthesised population a s of March 1979
1 t h r u ' 455 ( e n t i r e study a r e a )
1-13 ( c e n t r a l Leeds)
8 ( l e v e l of p u b l i c i t y = t h a t of survey)
' b e s t ' c a l i b r a t e d values a s of March 1979
1688 ( a l l a p p l i c a n t s )
1 0
+
1 5 minutess p i r a l e l i p t i c a l search r o u t i n e as
a t March 1979
'best' c a l i b r a t e d values a s of March 1979
unlimited
The f i r s t group of i n d i c a t o r s , p r o f i l e s of a p p l i c a n t s and p a r t i c i p a n t s ,
w i l l be of p a r t i c u l a r i n t e r e s t t o p o l i c y makers wishing t o consider t h e
d i s t r i b u t i o n a l e f f e c t s of a c a r s h a r i n g policy. The second group,
[image:14.602.78.518.98.658.2]d e s c r i p t i o n s of o p e r a t i o n a l performance of t h e scheme, w i l l be of use t o
t h e o r g a n i s e r s and managers of schemes. The t h i r d group of i n d i c a t o r s ,
however, a r e t h e ones of g r e a t e s t general i n t e r e s t ; %hey d e s c r i b e t h e
e f f e c t s t h a t t h e scheme would have on t h e t r a n s p o r t system a s a whole.
TABLE 2.2: IMPORTANT MODEL OUTPUTS
*
can be d i s p l w e d on a base map.Type
PROFIU OF
AND
PARTICIPANTS I N EACH TYPE OF
OPERATIONAL PERFORMANCE OF THE
SCHEME
SYSTEM EFFECTS
I
I n d i c a t o r
-
Location of h m e s and workplaces*
Length of journey t o work
Previous mode of t r a v e l t o work .
Sex, age and employment s t a t u s
Household background ( i n c l u d i n g c a r s owned, number of d r i v e r s , number of members and
telephone ownership)
Perceived u t i l i t y of arrangements
Fees changing hands
Diversions and delays accepted
Number of a p p l i c a n t s f o r each t y p e of arrangement
Number of a p p l i c a n t s given a m a t ~ h l i s t
Number of arrangements i n i t i a t e d
Computational c o s t of matching program
Work journey public t r a n s p o r t patronage numbers of passengers l o s t
passenger kilometres l o s t
P r i v a t e v e h i c l e usage:
kilometres saved
kilometres driven w i t h i n c a r s h a r i n g arrangements*
net saving i n kilometres d r i v e n
change i n c a r occupancies
v e h i c l e s ' l i b e r a t e d ' f o r p o s s i b l e off-peak usage
[image:15.605.66.530.175.777.2]- 11
-
3 DESCRIPTION, RESULTS AND INTERPRETATION OF THE PIVOTAL MODEL RUN
3.1 I n t r o d u c t i o n
This s e c t i o n d e a l s with t h e p i v o t a l model r u n which provides t h e
y a r d s t i c k a g a i n s t which a l l o t h e r runs w i l l be considered. Subsequent
s e c t i o n s w i l l t h e n consider t h e four groups of t e s t s o u t l i n e d i n
s e c t i o n 2.1.
3.2 The t a r g e t population
The d e f a u l t values of parameters and c o e f f i c i e n t s which d e f i n e t h e
p i v o t a l model run were given i n t a b l e 2.1. We a r e using t h e ' b e s t
e s t i m a t e ' model c o e f f i c i e n t s t o run a policy t e s t of an organised c a r
sharing scheme open t o all peak period work t r i p makers employed i n
c e n t r a l Leeds. This p a r t of Leeds was chosen t o be t y p i c a l of s i t e s
t h a t might be considered f o r a l a r g e municipally organised c a r sharfng
scheme. It i s a commercial a r e a (shops, o f f i c e s and some s e r v i c e
i n d u s t r y ) approximately 1 kilometer by
2
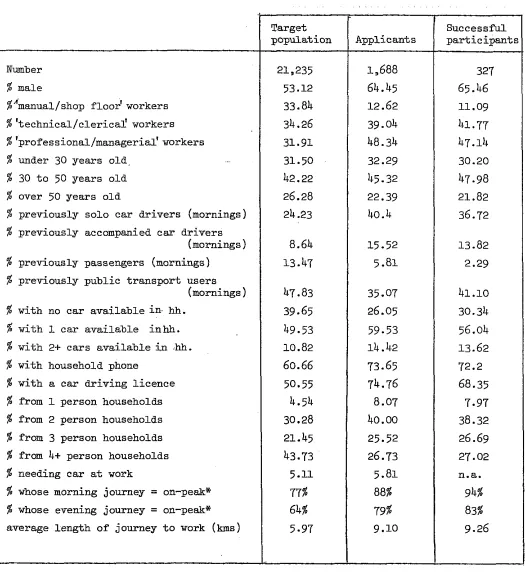
kilometer.The l o c a t i o n of t h e homes and workplaces of members o f t h i s t a r g e t
population a r e shown i n f i g u r e 3.1. S a l i e n t s t a t i s t i c s r e l a t i n g t o t h i s
population a r e given i n column one of t a b l e 3.1. It i s c l e a r t h a t t h e
population i s not a t y p i c a l of o t h e r groups of city-centre workers
elsewhere i n t h e country.
3.3 The a p p l i c a n t s
When t h e d e c i s i o n s by each member of t h i s t a r g e t population whether
o r not t o apply t o j o i n t h e scheme were simulated we found t h a t 1688
i n d i v i d u a l s a p p l i e d t o j o i n t h e scheme (=7.9% of t h e t a r g e t p o p u l a t i o n ) .
Column two i n t a b l e 3.1 contains a d e s c r i p t i o n of t h e s e a p p l i c a n t s and
may be compared with t h e t a r g e t population a s a whole which i s described
i n column one.
Comparing t h e s e two columns we note t h a t a p p l i c a t i o n s have been
p a r t i c u l a r l y forthcoming from: men, professional/managerial workers,
c a r d r i v e r s , and from persons with a home telephone, peak p e r i o d journeys
o r longer than average journeys t o work. Conversely, women, manual/shop
f l o o r workers, people over 50, c a r passengers, public t r a n s p o r t u s e r s ,
people w i t h no c a r d r i v i n g l i c e n c e o r a s h o r t journey t o work and people
from l a r g e households o r households w i t h no telephone o r c a r s a v a i l a b l e
-.
- 12
-
FIGURE 3.1 LOCATION OF TARGET POPULATION (PIVOTAL RUN)
- EACH DOT IS AT THE HOME OF AN INDIVIDUAL TRIPMAKER
- WORK LOCATION IS CROSS HATCHED
,a u
.-
F 5. :; ::Table 3.1 SUMMARY DESCRIFTION OF PARTICIPANTS AT VARIOUS STAGES OF
THE PIVOTAL MODEL RUN (Leeds City Centre Scheme).
*
morning peak here defined as 0730 hrs + 0930 hrs, evening peak definedas 1600 hrs + 1800 hrs.
Number
% male
%*manual/shop floor' workers
% 'technical/clerical! workers
% 'professional/managerial' workers
% under 30 years old
% 30 to 50 years old
% over 50 years old
%
previously solo car drivers (mornings)% previously accompanied car drivers
(mornings)
%
previously passengers (mornings)%
previously public transport usersI (mornings)
I
I
%
with no car available in hh.I
5
with 1 car available inhh.1
%
with 2+ cars available in hh.I
%
with household phone%
with a car driving licence%
from 1 person households%
from 2 person households%
from 3 person households%
frum 4+ person households%
needing car at work%
whose morning journey = on-peak*%
whose evening journey = on-peak*average length of journey to work (kms)
Target population 21,235 53.12 33.84 34.26 31.91 31.50 42.22 26.28 24.23
8.64
13.47 47.83 39.65 49.5310. 82
60.66
50.55 4.54 30.28 21.45 43.73 5.1177%
64%
5.97 r Applicants1,688
64.45
12.62 39.04 48.34 32.2945
-
32 [image:18.602.50.575.75.655.2]-
14
-
Although middle c l a s s males had a higher propensity t o apply, t h e
proportion of l e s s a f f l u e n t , predominantly public t r a n s p o r t using people
i s f a r from i n s i g n i f i c a n t because o f t h e i r predominance i n t h e t a r g e t
population. This f a c t i s r e f l e c t e d i n t h e not inconsiderable proportion
of a p p l i c a n t s who d e s i r e d t o r e c e i v e r a t h e r than t o give l i f t s .
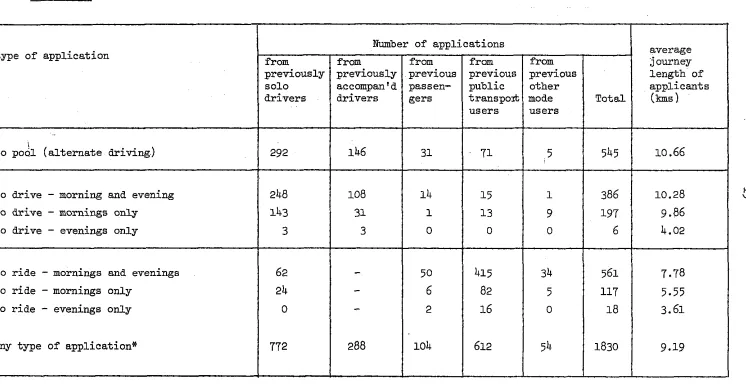
The t y p e of a p p l i c a t i o n s made i s shown i n t a b l e 3.2 from t h i s t a b l e
we note t h e following f a c t s : .
-
Applications t o receive l i f t s were t h e most numerous(561
+
117 + 1 8 = 696 = 38% of t o t a l a p p l i c a t i o n s ) .Applications t o give l i f t s made up 32% of t h e t o t a l and t h e remaining
30% were a p p l i c a t i o n s t o pool.
- Applications t o pool and t o take passengers came predominantly from
people who were previously d r i v e r s .
- Applications t o r e c e i v e l i f t s came predominantly from public
t r a n s p o r t u s e r s .
-
Applications t o pool came from people with longer journeys t o workthan did a p p l i c a t i o n s t o d r i v e . Applications t o r i d e came from people
with even s h o r t e r journeys t o work.
-
Applications f o r c a r sharing a t only one end of t h e day came frompeople with s h o r t e r journeys than d i d a p p l i c a t i o n s t o share a t both
ends of t h e day. Evening-only applications were a s s o c i a t e d with
p a r t i c u l a r l y s h o r t journeys.
3.4 The match lists
The next s t a g e i n t h e simulation was t h e production of 'match
l i s t s ' ( l i s t s of t r a v e l l i n g companions) f o r each o f t h e 1688
a p p l i c a n t s . I n t h i s p i v o t a l run, t h e production of match l i s t s f o r a l l
1688 a p p l i c a n t s was e f f e c t e d i n one batch. The search f o r p o t e n t i a l
p a r t n e r s w a s c a r r i e d out using t h e s p i r a l - e l i p t i c a l r o u t i n e which terminates
i t s search when t h e implied e x t r a diversion f o r t h e d r i v e r reaches $ of h i s journey t o work distance. The r o u t i n e was constrained t o r e j e c t p a r t n e r s
whose work hours were not within hour of those of t h e a p p l i c a n t i n question.
U p t o 10 p o t e n t i a l partners were sought f o r each applicant.
The matching process managed t o produce match l i s t s f o r 94% of t h e
a p p l i c a n t s . The average number of p o t e n t i a l p a r t n e r s on each match l i s t was
6.76. The computing c o s t s of t h e matching process were about £15, ( a t
Table 3.2 DESCRIPTION OF APPLICATIONS MADE I N PIVOTAL MODEL RUN.
*
note t h a t s t a t i s t i c s r e l a t i n g t o _applications w i l l not n e c e s s a r i l y be equivalent t o those f o r _ a p p l i c a n t s because each a p p l i c a n t may make more than one a p p l i c a t i o n .2
average journey l e n g t h of a p p l i c a n t s
(kms) 10.66 10.28 9.86 4.02 7.78 5.55 3.61 9.19 type of a p p l i c a t i o n
L
t o poal ( a l t e r n a t e d r i v i n g )
t o d r i v e - morning and evening
t o d r i v e - mornings only
t o d r i v e - evenings only
t o r i d e
-
mornings and eveningst o r i d e
-
mornings onlyt o r i d e
-
evenings onlyany type of a p p l i c a t i o n *
Number of a p p l i c a t i o n s
from
previously s o l o
d r i v e r s
292 248 143 3 62 24 0 772 from previously accompan'd d r i v e r s
146 108 31 3
-
-
-
288 from previous passen- g e r s31 1 4 1 0 50
6
2 104 from previous public transport u s e r s7 1 1 5 1 3 0 415 82 1 6 612 from previous o t h e r mode u s e r s
5 1 9 0 34 5 0 54
T o t a l
[image:20.847.67.813.117.503.2]-
16
- 3.5 The decisions t o form arrangements3.5.1. The f i n a l s t a g e i n t h e simulation was t h e d e c i s i o n by each of t h e
a p p l i c a n t s who received a match l i s t whether o r not t o form a c a r sharing
arrangement with any of t h e people on h i s l i s t . A d e s c r i p t i o n of those
people who d i d decide t o e n t e r an arrangement i s given i n column 3 of
t a b l e 3.1. It i s i n t e r e s t i n g t o compare t h i s column with t h e preceding
ones which describe t h e a p p l i c a n t s and t h e t a r g e t population r e s p e c t i v e l y .
Among o t h e r f e a t u r e s we note t h e following:
-
327 people a c t u a l l y e n t e r e d c a r sharing arrangements ( = 19% ofa p p l i c a n t s o r 1.5% of t h e t a r g e t population)
.
- ' T e c h n i c a l / c l e r i c a l ' workers and persons between 30 and 50 y e a r s
o l d were marginally more successful i n finding compatible c a r s h a r i n g
p a r t n e r s t h a n were o t h e r people.
-
If we consider t h e previous modes of t r a v e l of a p p l i c a n t s and successfulp a r t i c i p a n t s , we n o t e t h a t people previously t r a v e l l i n g by c a r were
l e s s l i k e l y t o f i n d s u i t a b l e t r a v e l l i n g p a r t n e r s t h a n were t h o s e who
previously used p u b l i c t r a n s p o r t . (This i s r e f l e c t e d i n t h e higher
success r a t e f o r people from non-car-owning and non-telephone-owning
households )
.
-
It i s something of a s u r p r i s e t o note t h a t t h e mean t r i p l e n g t h ofs u c c e s s f u l p a r t i c i p a n t s i s longer than t h a t of a p p l i c a n t s . Presumably
t h e geometrical r e l a t i o n s h i p (which ensures t h a t t h e g r e a t e r t h e
journey d i s t a n c e t h e n t h e l e s s t h e p r o b a b i l i t y of f i n d i n g a near
neighbour with t h e same workplace), i s swamped by t h e g r e a t e r
enthusiasm of long d i s t a n c e t r a v e l l e r s f o r c a r sharing.
- People who t r a v e l i n t h e main peak periods a r e more l i k e l y t o f i n d
compatible t r a v e l l i n g companions than a r e those with more e c c e n t r i c
work hours. The reason f o r t h i s i s obviously t h a t they have more
p o t e n t i a l p a r t n e r s t o choose from.
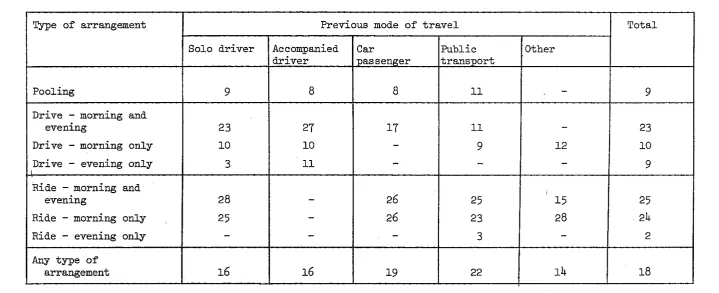
3.5.2 Table 3.3 compares a p p l i c a t i o n s made with arrangements e v e n t u a l l y
formed. The t a b l e i s disaggregated by t h e t y p e of arrangement and t h e
previous mode of t h e p a r t i c i p a n t . From t h i s t a b l e it i s apparent t h a t
lift requestors a r e s l i g h t l y more l i k e l y t o be s a t i s f i e d t h a n a r e l i f t
o f f e r e r s . Applicants f o r c a r pooling ( a l t e r n a t e d r i v i n g ) a r e s i g n i f i c a n t l y
l e s s l i k e l y t o be s a t i s f i e d . Persons wishing t o r i d e o r d r i v e f o r only
one journey p e r day a r e l e s s Likely t o be successFul than t h o s e wishing
f o r two journeys p e r day ( t h e evening only a p p l i c a n t i s p a r t i c u l a r l y
-
Table 3.3 Successful. participants per 100 applications made
Type of arrangement
Pooling
Drive
-
morning andevening
Drive
-
morning onlyDrive - evening only
L
Ride - morning and
evening
Ride - morning only
Ride
-
evening onlyAny type of arrangement Total 9 23 10 9 25 24 2 18 Previous mode of travel
[image:22.841.62.782.83.376.2]- 1 8 -
seem p a r t i c u l a r l y u n l i k e l y t o be s u f f i c i e n t l y pleased w i t h any of t h e
arrangements o f f e r e d t o them t o cause them t o become c a r s h a r e r s . Persons who previously t r a v e l l e d by p u b l i c t r a n s p o r t however, appear
more l i k e l y t o be s a t i s f i e d . (Previous public t r a n s p o r t u s e r s make up
35% of a p p l i c a n t s but 41% of p a r t i c i p a n t s ) .
3.5.3 Table 3.4 shows, f o r a p p l i c a n t s and f o r s u c c e s s f u l p a r t i c i p a n t s ,
t h e r e l a t i o n s h i p between t h e i r d i s t a n c e t o work and t h e i r t y p e of a p p l i c a t i o n .
Table 3.4 DISTANCES TO WORK (KMS) - APPLICANTS AND PARTICIPANTS.
We note t h a t pooling i s c h a r a c t e r i s e d by t h e l o n g e s t d i s t a n c e s and
r i d i n g by t h e s h o r t e s t . Arrangements f o r only 1 journey p e r day a r e
g e n e r a l l y p r e f e r r e d by people with much s h o r t e r journey d i s t a n c e s . When t h e matches a r e a c t u a l l y made we f i n d t h a t long d i s t a n c e t r a v e l l e r s
a r e more s u c c e s s f u l o v e r a l l and p a r t i c u l a r l y w i t h i n pools. The v e r y
s h o r t d i s t a n c e t r a v e l l e r s r e q u i r i n g arrangements f o r only one journey
per day t e n d not t o be s a t i s f i e d . type of a p p l i c a t i o n
pooling
d r i v i n g - mornings and evenings
d r i v i n g
-
mornings onlyd r i v i n g - evenings only
r i d i n g - mornings and evenings
r i d i n g - mornings only
r i d i n g - evenings only
a l l types of a p p l i c a t i o n
a p p l i c a n t s
10.66
10.28
9.86 4.02
7.78
5.55 3.61
9.10
I
s u c c e s s f u l p a r t i c i p a n t s
14.10
10.58
10.21
8.10
8.13
4.83
5.70
[image:23.595.70.493.266.589.2]3.5.4
We must now consider the overall impact on the transport system of the organised car sharing scheme here modelled. The following results are of particular interest:-
The work journey modal split(AM
peak) of the target population changes from46.35%
private car to 47.02% private car.-
The demand for city centre oar park spaces falls from 6981 to6957
(24 fewer spaces are required-
a reduction of0.34%).
-
The weekly peak period work trip public transport patronage falls-
by 10,708 passenger kilometres from
600750
to 590042 - a reductionof
1.78%.
-
The weekly peak period work trip ppivate vehicle kilometres travelled falls by 1423 kilometres from453,896
to 452,473-
a reduction of 0.31%. Clearly the effect of this car sharing scheme on the transport system is marginal. Its most significant effect is the reduced demand for peak period public transport.3.5.5
!hrning from this global summary of the scheme's effect on the transport system to a more detailed analysis of the matches actually made, we find the following points of particular interest.- Of total participants who actually join schemes; 52% are fee paying passengers, 33% are fee paid drivers and only 15% are true poolers (alternate driving - riding). We also find that 85% of aggreements are for two journeys per day.
- 54% of poolers, 63% of paid drivers and 13% of paying passengers were previously solo drivers.
- 15% of poolers, 3% of paid drivers and
74%
of paying passengers were previously public transport users.-
Mean car occupancies within true car-pools and simple lift giving arrangements are 2.01 and 2.57 persons/carrespectively. The comparatively low occupancies within true car pools is a result of the much lower probability which a driver has of finding two other drivers (whose home and work locations are such that any of the three could
- The arrangements contracted involve 1 5 c a r s which were
previously unused ( 9 of t h e s e a r e required by new c a r poolers
only on those days when they a c t a s d r i v e r i n t h e i r p o o l ) .
-
The arrangements contracted ' l i b e r a t e ' 47 c a r s which a r e nolonger r e q u i r e d (23 of t h e s e a r e l i b e r a t e d by new c a r poolers
and a r e t h e r e f o r e a v a i l a b l e only on those days when n o t
required within t h e p o o l ) .
- t h e arrangements contracted l i b e r a t e 17 c a r s i n households
where t h e r e a r e more d r i v e r s than c a r s ( 6 of t h e s e a r e
l i b e r a t e d by new c a r p o o l e r s ) .
-
!the n e t reduction i n p r i v a t e v e h i c l e usage of 1,423 k i l o m e t r e s p e r week i s due almost e n t i r e l y t o pooling arrangements ( w i t h i n simple l i f t giving m m g e m e n t s increased use by drivers i s almost e x a c t l y o f f s e t by reduced use by passengers).-
The l i f t giving arrangements contracted involve a t r a n s f e r of u t i l i t y u n i t s frum passengers t o t h e i r d r i v e r s . I nmonetary terms t h e average d r i v e r receives £3.75 p e r week
(= 3.7 pence per kilometer t r a v e l l e d ) and each passenger
gives £2.39 p e r week (= 2.98 pence per kilometer c a r r i e d ) .
The r a t e s per kilometer t r a v e l l e d f o r arrangements involving
only one journey per day a r e about 40% higher t h a n f o r
arrangements involving two journeys per day.
- The t o t a l u t i l i t y ( t o p a r t i c i p a n t s ) of matches made i s
£53'7 per week."
- The u t i l i t y * per person averages £4.71 f o r each pooler and
£1.16 per p a r t i c i p a n t i n simple l i f t giving schemes.
- Diversions t o pick up passengers cause t h e average p o o l e r t o d r i v e an e x t r a 4 kms. ( 2 kms. morning and 2 kms. evening)
on each day t h a t he i s t h e d r i v e r
-
t h i s r e p r e s e n t s an i n c r e a s eof about 14% on h i s d i s t a n c e t r a v e l l e d on t h o s e days.
- Diversions t o pick up passengers cause t h e average paid
d r i v e r t o d r i v e an e x t r a 2 kms ( 1 km morning and 1 km evening) each day
-
t h i s r e p r e s e n t s an increase of about 11% on h i sd a i l y d i s t a n c e travelled-. ( I t i s p a r t l y a s a r e s u l t of t h e s e
massive diversions t h a t t h e n e t reduction i n v e h i c l e usage i s
s o s m a l l ) .
3.5.6
The policy implications of this pivotal model run will, no doubt, alreadybe forming themselves in the minds of the perceptive reader. Before considering
these implications, however, we will present the results of the other model
tests. Discussion of policy issues is reserved for section 8 of this paper.
4.
THE SENSITIVITY ANALYSES4.1
IntroductionThe tests included under this head were designed to investigate the
sensitivity of model predictions to in certain model assumptions:
1. That the model of propensity to make an application should
be calibrated on positive answers to the question "would you
make use of an information system . . . . ' I which was posed in
our field survey (see Bonsall 1979a). An alternative
assumption (tested here) is that we should assume applications
from any eligible person expressing any interest at all in car
sharing.
2. That we should disregard applications from people who appear
unable to participate in the scheme in the stated manner
( - eg because they have no car and yet are offering to give
lifts). We will here test the effect of accepting all
applications even if the applicants appear ineligible.
3. That the calibration of match utilities should be based on
data from all respondents. We will here test the effect of
excluding data which appears counter-intuitive (see Bonsall
19791,
pp.34-36)
.
4. That the calibration of match utilities is best carried
out on a transformed data set in order to maximise normality.
We will here test the effect of not transforming the data, (see Bonsall
19761-
section
3.3.3).
5. That a mechanism should be built into the microsimulation
program to set counter intuitive valuations of match utility
to zero (~onsall 1979b pp.
36-39).
We will here test theeffect of omitting this mechanism.
6 . In the pivotal run it was assumed that passengers would be willing
to compensate their drgvers with an amountV as @sat as their perceived
utility of receiving the lift. /We will here test the assumption. that
no passenger would be prepared to pay more than the bus fare. -.
*
This compensation, although here expressed as a transferal of money4.1.2 A sensitivity analysis was also carried out to examine the impact on model results of the order in which bargains are struck in the simulation model
(see Bonsall 1979b, p.18). This analysis involved running the model five times with all inputs held constant except the random number string which determines the order in which bargains are struck. The conclusions from this test were that chang-ing the order in which bargains are struck has a very masginal
(e
%)
effect on model results. This conclusion being arrived at from inspection of the variances. Nevertheless, it remains quite probable that significant changes in system performance would result from a careful arrangement of the order in which bargains are struck.(A
complex ordering might be devised in order to aim for a wstem optimum). However such an arrangement would not occur by chance on the field and is unlikely to be attempted as a matter of strategy. Itsinvestigation and testing is therefore not warranted at the present time. 4.2 Results
Table
4.1
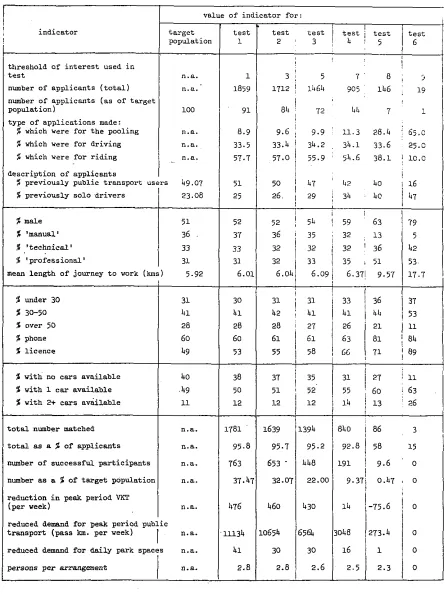
contains a summary of the results of the six tests described above. The table enables comparison of the value of each indicator from a given test with its value in the pivotal run. We will now consider the results of each test in turn.4.2.1 The first test (propensity to apply calibrated on respondents expressing any interest at all in car sharing) results in a 17% inorease in the number of applicants. This increase is most -ked among people wishing to give lifts (because it is they who, in the survey, were particularly keen to make their
own arrangements rather than to use a matching system).
The 17% increase in applications results in a 19% increase in participants (because the larger number of applicants allowed the matching system to work more efficiently).
The increased number of particripants is associated with further reductions in demand for parking spaces, for peak ~eriod public transport and private vehicle kilometres travelled (w)
.
The less rigorous definition of 'applicants' within the calibration results in a lower mean trip length for applicants and for participants. The lower mean utilities and compensations result from the lower mean trip lengths and
Indicator
I
value of indicator far:I
p- I
Pivotal Test Test Test Test Test Test Pivotal run with ! run 1 2 3 4 5 6 confidence interval
I
added subtracted Itotal applicants
1
1688applications for pooling
1
545 applications to give lirtsI
589applications to receive lifts
1
696number of successfxl participants
1
327% of applicants who previously used public transport
mean distance to work of applicants (kms)
number of participants in car pools
1
49
35.07 9.10
number of participants giving lifts
1
109 number of participants receiving lifts1
169mean car occupancy with arrangements
1
2.45 mean distance to work of participants (kms)l 9.26number of cars 'liberated' in households
with more drivers than cars
1
17 number of participants who previouslydmve solo
number of participants who previously used public transport
net reduction in daily demand for
parking spaces
(
24 120135 mean diversion experienced by participants
(a. per week)
reduction in demand far peak period public transport (pa~s.kms.~er wcekl
net reduction in peak period use of vehicles (kms. per week)
campensation offered to aversge driver _ giving lifts morning and evening
a) pence per week
11.82
10708
1423
b) pence per km,
1
3.70These indicators will be unchanged for tests 3-6 because these tests do not involve rerunning the model which simulates the decisions to m a k e
applications
total net utility of the scheme to participants ( C per week)
mean utility of the scheme to each participant (pence per week1
537
4.2.2- The second test (propensity to make an application calibrated on respondents' stated desire to use a matching system even if the respondents appeared ineligible to make an application of that tme) resulted in a 34%
increase in applicants. Particular increases are apparent among would-be poolers
(6246)
and would-be lift givers (41%) because it is amongst these that the eligibility constraint is most significant.The j@ increase in applicants grows to a 3996 increase in participants. The 8096 increase in successfil poolers reflects the importance of having an adequate population for the matching system to work effectively.
The number of car park spaces saved, cars liberated and peak period private vehicle kilometres saved all increase by at least 100%. Reduced demand for peak period public transport, on the other hand, increases by only 15% -
this obviously reflects the reduced proportion of applicants who previously relied on public transport.
The reduced mean rates of compensation reflect the increased number of would-be drivers
(-+
reduced competitive position).4.2.3
In
the third test (match utilities calibrated on a data set from which counterintuitive values have been removed), we find a 23% increase in the number of suocessful participants.Mean diversions within arrangements are increased and this contributes to a less marked reduction in peak period VXT.
There is an increased reduction in demand for peak period public transport but
a
reduction in the number of park* spaces saved.4.2.4 In the fourth test (match utilities calibrated without normalisation prior to the regression), we find a 21% reduction in the number of successful participants.
Participants have lower mean trip lengths. The reduction in demand for peak period public transport is less marked as is the saving in VXT and parking
spaces.
4.2.5
In
the fifth test (evaluation of match utilities not subject to a sievefor counter intuitive valuations), we find a 33% increase in the number of participants.
There is a higher proportion of true car pooling. The reduction in peak
4.2.6
In
the sixth test (compensation greater than bus f.we not allowed for), we find a 1% reduction in the number of participants.Car occupancies are up because fewer drivers feel that they get sufficient compensation to carry only one passenger).
Sav- in peak VRC are increased by 2O0A and the reduction in demand for peak period public transport is 10% less.
The mean net utility to participants is increased because the reduced compensation (not included as a net utility because it is a transfer payment) does not tempt drivers to give lifts which are particularly irksome to them. 4.2.7 %,ving considered each of the six sensitivity tests in turn we will now compare the magnitudes of their impacts with one another and with the 9%
confidence interval on the pivotal model run. (column 9 in table
4.5
shows for each indicator the mean value from the pivotal nul -the confidenceinterval while column 10 shows the result of subtracting the confidence interval from the mean value).
We find that the number of participants varies from
455
(test 2) to 257 (test4)
whereas the90%
confidence interval on the pivotal run gives a variation from348
to306.
The number of true poolers varies from 124 (test
5)
to 42 (test6)
- (pivotal run 9% confidence range =59
to39).
Cars liberated for possible off peak use varies from 38 (test
5)
to15
(test
6)
- (pivotal run90%
confidence range 20 to15).
Peak VHC saved varies from
3518
(test5)
to 648 (test3)
-
(pivotal run 9096 confidence range1835-1
012).
Reduction in peak period public transport patronage (pas kms per week) varies from 14250 (test
3)
to8043
(test4)
-
(pivotal run9%
confidence. rangeI
1338 to 10077).Reduction in d d for parking spaces varies from 62 spaces (test 2) to
15
spaces (test4)
-
(pivotal run90%
confidence range 28 spaces to 21 spaces). The conclusion from this analysis must be that certain of the model results are very sensitive to the model assumptions tested here. We must draw particular attention to the results of tests4
and5.
Clearly there is a case for examining in more detail the whole question of the calibration of match utilities if weTable 4.2 Global r e s u l t s of s e n s i t i v i t y analyses ( f o r d e s c r i p t i o n of t e s t s s e e s e c t i o n 4 . 1 )
'
IU 0\ I II n d i c a t o r
a p p l i c a t i o n s a s a
%
of t a r g e t populations u c c e s s f u l p a r t i c i p a n t s a s a
%
of t a r g e t population%
of pierticipants who previously used public t r a n s p o r tpeak period work t r i p VKT p e r week
reduction i n peak VKT a s a % of t h e 'before' t o t a l
peak period work t r i p public
t r a n s p o r t patronage (pass.kms/week)
reduction i n peak public t r a n s p o r t usage a s a % of t h e 'before' t o t a l
c a r parking spaces required ( p e r day)
reduction i n park space requirement a s a % o f t h e ' b e f o r e '
modal s p l i t ( % p r i v a t e )
-
value of i n d i c a t o r before
i n t r o d u c t i o n of t h e
scheme
-
-
-
453896 - 600750-
6981-
46.38P i v o t a l P i v o t a l run plus run minus confidence confidence i n t e r v a l i n t e r v a l
p i v o t a l run)
1 . 6 1 . 4
4 1 4 1
452061 452884
0.40 0.22
589412 590673
1.89 1.68
6953 6960
0.40 0.30
47.06
46.97
P i v o t a l run
7.94
1 . 5
4 1 452473 0.31 590042 1.78
6957
0.34 47.02value of i n d i c a t o r i n :
--
Test Test Test' Test Test Test
1 2 3
4
5 69.30 10.69 (not d i f f e r e n t from t h e
1 . 8 2.1 1 . 9 1 . 2 2.1 1 . 3
42 39
44
4 1 36 42452368 540886 453248 452608 450378 452185
.
0.34 0.66 0.14 0 . 2 8 , 0.78 0.38
588566 588374 586500 592707 587783 591188
2.03 2.06 2.37 1.34 2.16 1.59
6953 6918 6963 6966 6932 6957
0.40 0.90 0.26 0.21 0.70 0.34
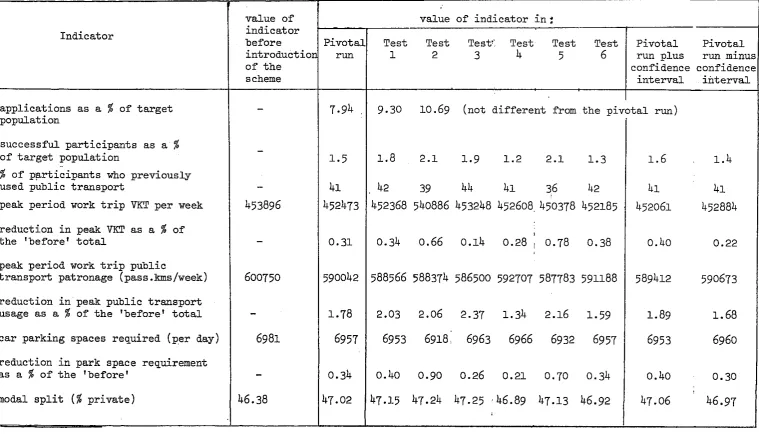
[image:31.841.56.816.80.514.2]4.2.8 Having considered the absolute magnitude of differences between the various sensitivity tests it is now important to put these differences in a proper
perspective. Table
4.2
shows values for some of the systq indicators which have particularly strong policy implications.The Table shows how these indicators vary with each of the tests and allows comparison with the situation before the introduction of an orwised car sharing scheme. The last two columns in the table show the range of values that fall within the 9096 confidence interval for the pivotal run.
-
From this table it is quite clear that the results of all the sensitivity tests are very close to that of the pivotal
run:
The application rate approximates to I&.
The participation rate to somewhat under
2%.
About 4096 of participants previously used public transport. The reduction in VKT is considerably less than 1%.
The reduction in peak public transport patronage approximates to
2%.
The reduced demand for parking spaces is less than 1%....and so on.
Clearly none of the sensitivity analyses have caused a significant change in the variables which are most likely to be used in policy formulation.
5. TESTS OF TBF: ORGBMSATIONAL SWUCICURE OF CAR SHARING SCHEMES 5.1 Introduction
In this group of tests we analyse how the performance of the car pooling scheme under investigation is affected by the procedures adopted during the formation of match lists. The procedural parameters tested here are:
The maximwn number of potential partners to be included on any applicant's natch list, and
the size of the 'time window1 used in searching for prima-facie matches.
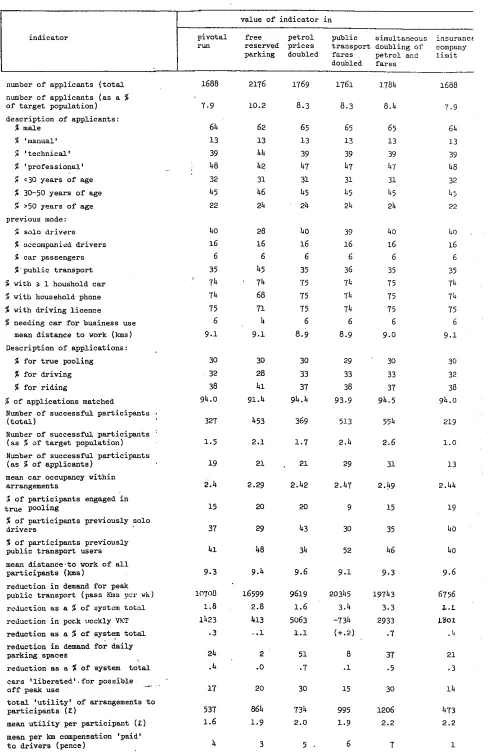
5.2 Results
Table 5.1 shows how certain important indicators are affected by changes in the maximum number of people on each match list and in the extent of the timeband within which the searoh for potential matches is made (Figmes 5.1 and
t e s t .. - ... ... I n d i c a t o r max number on form
1
e x t e n t of time window1
(each timeband = { hour)I ....
I
-~ --= ~ ~only
1
1
own timeband 1 own timeband+
2 timebands-
1
... ... . . . inumber of p a r t i c i p a n t s 327 290 253 205 j I 120 333
/
, , , ,1
1-11)
1,
( - 2 2 )/
(-37)1
1-63]I
I
- ... !
reduction i n peak period public t r a n s p o r t usage
reduction i n peak period c a r t r a v e l (kms/week)
-- .-
I
required .. !
ut i.rit-y..-o T-EEtkie-
schseee
p a r t i c i p a n t s ( 2 )... %
140 i
I
c o s t m of t h e matching process1
150 r 180L-
1
-- ... ( 2 0 )I X
I c o s t per park space saved
I 4.3
n
c o s t per 100 Deak oeriod I i
I
-
-
/
1 . 4 1 1.1 0.9 1 . 0
I
1 . 2public t r a n s p o r t passenger 1.5 I 1 . 6
kms saved per week (-21) k - 3 6 )
i
(-29) (-14)I
( 7 )( 1 4 )
-- + jj- ... i ...
1
cost-. per 100 kms of peak1
1
1
!I
!
*
' c o s t ' i s here expressed i n n o t i o n a l u n i t s derived from t h e computing c o s t s of t h e matching process. This i n t e r p r e t a t i o n i n monetary terms would be purely speculative s i n c e it should properly include elements f o r s t a f f time, s t a t i o n e r y and much e l s e b e s i d e s . We a r e h e r e i n t e r e s t e d i n t h e r e l a t i v e r a t h e r than t h e a b s o l u t e , of t h e d i f f e r e n t s d r t s of scheme. Having s a i d t h a t , however, it would not be i n a p p r o p r i a t e t o denote t h e s e u n i t s shown i n t h e t a b l e s a s pounds s t e r l i n g .period c a r use saved per week 5.9 25.5 I
(142)
1
I
...
I ...
5.2.1As expected, reducing the maximum number of people on the match list
decreases both the effects of the car sharing scheme and its cost of operation. We note (with reference to Figure
5 , l )
that the reduction in costs tends todecelerate as we reduce the maximum number of persons per form (the cost difference between
7
and5
is greater than between3
and 1) while the reduced effectiveness of the scheme tends to accelerate. If we were concerned only with maximising the cost effectiveness of the matching system then clearly we will decide that the optimum maximum number of persons per form is between 3 and5.
In
practice, however, the overall costs of a car sharing scheme will be dominated by staffingand publicity costs which are not proportional to the number of persons on a match list. When these costs are included the optimum number of persons per match list will rise from about
4
to about 10 (the precise number will obviously depend on the costs of publicity and staffing mangements).5.2.2 In examining the effect of extending or contracting the width of the time band within which the search is conducted (i.e. Figure 5.2) we note, with no surprise, that the measures of scheme impact (curves
A
toD)
show decreases when the time band is contracted and increases when it is expanded. We note also that the reduction in cost (curveE)
obtained by searching in one time band only is less than the consequently reduced effectiveness of the scheme(-es A, B, C and
D).
The increased costs incurred when 2 time bands are used are greater than the increased effectiveness except in respect of reducedVBP ( m e
c).
In terms of cost-effectiveness, therefore, the optimum time window will approximate to* l k$time band unless savings in VFT are thought to outweigh all other benefits of organised car sharing-
if such be the case then a wider time window is to be preferred.6.
TESTS OF SCHEME LOCATION BND IPENSITY6.1
Introduction6.1 .I Our first gcoup of tests under this heading was designed to investigate how the performance of a scheme is related to the characteristics of the target population. We tested schemes within which the target populations vary in
size, location and composition. Schemes were tested for eight target populations (coded
A-H)
:A
-
city centre officesB
-
inner suburb industrialC
-
outer suburb industrial employment based D-
inner suburb industrialE
-
mid suburb industrialF
- GarforthH - Otley
I
6.1.2 In our second group of tests we investigated how the performance of the scheme is affected by the strength of the public's reaction to
a
call for applications. (The strength of this reaction may result from variations in the intensity of any attendant publicity campaign but a discussion of this question is beyond the scope of the present paper).In
this soup of tests we are particularly interested in the relationship between the m b e r and typeof applications received and the effectiveness of the matching system. These tests involved variation in the 'threshold of interest1 which is used in the determination of applioations (see sections
1 . 3 . 3 .
and1.3.4).
Note that it is not possible to estimate the intensity of publicity campgain represented by any given 'threshold of interest1 (except that threshold 8
represents the level of publicity which accompanied our calibration surveys) (see Bonsall 1979a).
6.2 Descriutions of the Target Pouulations
Table 6.1 shows the target populations for each of the schemes tested. Figure
6.1
shows the location of these populations.In
comparing the various target population note in particular the following points :The populations are all considerably smaller than that of the pivotal run.
The Scheme A (city Centre offices) population has a somewhat smaller proportion of manual workers and of males.
The Scheme B (inner suburb industrial) population has a much higher proportion of manualworkers, a high proportion of people walk- to work, lower car ownership and telephone availability. The Scheme C (outer suburb industrial) population has a high proportion of males and mauual workers; short journeys to work and a consequent high proportion of walking.
The Scheme
D
(inner suburb industrial) population differs fromthe other inner suburb industrial population (soheme
B)
in having a very high proportion of females and of 'technical'/clericaltemployees. This is associated with low licence tenure and car use. I The Scheme E (mid suburb industrial) population is werwhelmhgly