promoting access to White Rose research papers
Universities of Leeds, Sheffield and York
http://eprints.whiterose.ac.uk/
This is an author produced version of a paper published in Chemical Physics Letters.
White Rose Research Online URL for this paper: http://eprints.whiterose.ac.uk/3542/
Published paper
OH yields from the CH3CO + O2 reaction using an internal standard
Authors
Scott A. Carr, M. Teresa Baeza-Romero*, Mark A. Blitz, Michael J. Pilling,
Dwayne E. Heard, Paul W. Seakins
School of Chemistry, University of Leeds, Leeds LS2 9JT, UK
* Now at School of Earth and Environment, University of Leeds, Leeds LS2 9JT, UK
Corresponding author.
Dr. M. Teresa Baeza Romero, School of Earth and Environment, University of Leeds, Leeds, LS2 9JT
Abstract
Laser flash photolysis of CH3C(O)OH at 248 nm was used to create equal zero time
yields of CH3CO and OH. The absolute OH yield from the CH3CO + O2 (+M)
reaction was determined by following the OH temporal profile using the zero time
OH concentration as an internal standard. The OH yield from CH3CO + O2 (+M) was
observed to decrease with increasing pressure with an extrapolated zero pressure yield
close to unity (1.1 ± 0.2, quoted uncertainties correspond to 95% confidence limits).
The results are in quantitative agreement with those obtained from 248 nm acetone
1. Introduction
The acetyl radical plays an important role in both atmospheric and combustion
processes [1,2]. In the atmosphere, it can be formed by the reactions of radicals/atoms
(OH, NO3, Cl, Br) with acetaldehyde [3] or by the photolysis of some ketones [4,5].
Under tropospheric conditions, the acetyl radical reacts with oxygen to produce
acetylperoxy radicals:
CH3CO + O2 + M → CH3CO(O2) + M (R1a)
which can further react with NO2 to form peroxyacetyl nitrate (PAN):
CH3CO(O2) + NO2 + M → CH3CO(O2)NO2 + M (R2)
PAN is a component of polluted environments and an important NOx reservoir species
[6]. However, experimental [3,7-9] and theoretical [10,11] studies have shown that
reaction (R1) has a dissociation channel that forms OH, especially at low pressure.
The suggested mechanism is shown in Scheme 1 [7]:
CH3CO + O2 CH3CO(O2)* OH + co-products
CH3CO(O2) (R1a) kM[M]
(R1b)
kc
Scheme 1
Although of insignificant atmospheric importance in its own right, R1b has been used
as a convenient experimental marker for the acetyl radical (in the presence of O2) in a
study of the atmospherically important photolysis of acetone and of other
methylketones [4,5,12].
There is good agreement between kinetic studies of reaction R1 [7,8,13], but the
previous experimental study where OH yields were measured directly at different
pressures of He; absolute, pressure dependent OH yields were assigned assuming
unity OH yield at zero pressure [7] on the basis of the reaction mechanism and a
strong collision model. However, the pressure dependence obtained does not agree
with indirect measurements of channel R1b obtained by Tyndall et al. [8] or with OH
yields obtained by theoretical methods [10].
The method presented here for assigning absolute OH yields from reaction R1 is
based on acetic acid photolysis. Hunnicutt et al. [14] showed that at 218 nm acetic
acid photolysis (R3) produces CH3CO+ OH(v’’=0) (R3a) in a 1:1 ratio with little or
no subsequent decomposition of the acetyl fragment (R3b). Dissociation to three
fragments via (R3c) could not be ruled out at 218 nm on energetic grounds, but at 248
nm (equivalent to 481 kJ mol-1) it is an endothermic process even when allowance is
made for the thermal energy of the photolyte:
CH3C(O)OH + hν → CH3CO + OH(v’’=0) ∆Ho0 = 439 kJ mol -1
(R3a) [14]
CH3C(O)OH + hν → CH3CO + OH → CH3 + CO + OH ∆Ho0 = 493 kJ mol -1
(R3b) [14]
CH3C(O)OH + hν → CH3 + OCOH → CH3 + CO + OH ∆H
o
0 = 493 kJ mol -1
(R3c) [14]
In this study, acetic acid was photolysed at 248 nm in the presence of O2 in order to
assign absolute OH yields from R1 as a function of total pressure. At zero time, the
photolysis generates equal amounts of OH and CH3CO radicals and this instant,
photolytic OH signal provides a convenient internal standard for the subsequent
Experimental
The apparatus, which uses slow flow laser flash photolysis combined with LIF (Laser
Induced Fluorescence), has been described previously [5]. The pressure in the cell
was measured using capacitance manometers and adjusted by throttling the exit
valves on the cell. Acetic acid was photolysed using an excimer laser operating at
248 nm (Lambda Physik, Compex, KrF-Ne) with a photon density between 1-5 × 10¹⁶
photon cm-2. OH was probed by LIF at ∼282 nm (detection limit was ∼109 molecule
cm-3) using the doubled output of a dye laser (PDL3, Rhodamine 6G) pumped at 532
nm from a Nd:YAG laser (Spectra Physics). The fluorescence at ∼308 nm was passed
through an interference filter (Barr Associates Inc., 308.5±5 nm) and was detected
using a photomultiplier (EMI 9813). The signal from the photomultiplier was
integrated with a boxcar averager, whose output was digitised and passed to a
personal computer for subsequent data analysis. The delay time between the
photolysis laser and probe laser was scanned using a delay generator such that the
recorded OH temporal profile consisted of 1000 time points, each averaged over 2-3
laser shots. The pulse repetition frequency of the lasers was varied between 10 and 5
Hz, and the total flow rate of gas ensured there was a fresh sample for each laser shot.
The typical initial concentration of radicals in the system was estimated to be about
2×10¹⁰ molecule cm-3.
The experimental concentrations of acetic acid were in the range 1013-1014 molecule
cm-3 to ensure that the dimer contributed less than 0.5% of the total concentration
[15]. Furthermore, the absorption cross section of the dimer at 248 nm is expected to
be small in comparison to that of the monomer [16] and it will not interfere in the
Acetic acid (99.8%), supplied by Aldrich, was degassed and diluted in He. Helium,
nitrogen (BOC, CP grade, 99.999%) and O2 (Air Products, high purity, 99.999%)
were used straight from the cylinder.
Results
Acetic acid (0.25-3 mTorr) was photolysed in the presence of O2 (<1 Torr) and either
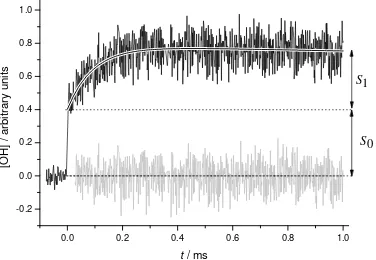
He (5-100 Torr) or N2 (5-25 Torr) as the buffer gas. A typical OH temporal profile is
shown in Figure 1. From this trace the two OH contributions are readily identified: the
instant, photolytic signal at time zero (S0) and the relatively slow growth signal from
reaction R1b (S1). The equation that describes the OH temporal profile is obtained
from the solution of the rate equations for Scheme 1 [7] and the inclusion of an instant
OH signal (S0):
(
)
[
]
[
exp(
k t)
exp(
kt)
]
k k k S t k exp S
S 4 4 1'
4 ' 1 ' 1 1 0
OH − − −
− + −
= (E1)
where k’1 is the pseudo-first-order rate constant for reaction R1 and k4 represents the
slow loss of OH from the system due to reaction with acetic acid (k298K = 7.4 × 10⁻¹³
molecule-1 cm3 s-1 [17]) and diffusion:
OH → loss (R4)
Absolute OH yields for reaction R1,
Φ
OH, were obtained by fitting equation E1 to thedata, varying S0, S1, k’1and k4,and then simply dividing S1 by the photolytic signal S0:
0 1 OH([M])
S S
=
At low total pressures (< 10 Torr) O2 can comprise a significant fraction (≤10%) of
the total composition. Small corrections (<2%) were made in the He experiments to
allow for the greater collisional stabilization efficiency of O2 relative to He, by
assuming that the efficiency of O2 in stabilising the CH3C(O)O2* intermediate is the
same as that of N2. The results are summarized in Tables 1 and 2 for helium and
nitrogen bath gases, respectively.
Experiments were performed for [O2] = 5×10¹⁴- 2×10¹⁶ molecule cm-3, and from
fitting equation E1 to the data the rate coefficient of R1 could be obtained as well as
the OH yield. The rate coefficients obtained for R1 when He was the buffer gas are
shown in Table 1. The present experiments are not ideally suited to accurate
determinations of k1, especially at higher pressures, because of the zero time signal
and because of the fact only 2 or 3 different O2 concentrations were used in some
cases. As a result the uncertainties in k1 are large. Except for the measurements at
[He] = 5.51 × 10¹⁷ and 1.68 × 10¹⁸ molecule cm-3, the uncertainties in the fitted k1 for
these experiments and the more accurately measured values obtained by Blitz et al.
[7] overlap. In order to test the validity of the approach, an alternative method was
used for one of the cases with poor agreement: the k1 (k = 2.87 × 10⁻¹² molecule-1 cm3
s-1) value obtained by Blitz et al. [7] was used in the fitting process. This gave an
averaged value
φ
OH = (0.30 ± 0.09) in agreement with the averaged value obtainedwithout fixing k’1rate coefficient (
φ
OH = 0.32 ± 0.08).At higher concentrations of acetic acid (>3 × 10¹³ molecule cm-3), k’1 was
observed to increase and the OH yield to decrease, possibly because of a reaction
Consequently, only data obtained in conditions where this effect was negligible were
used ([O2]/[CH3C(O)OH] > 300).
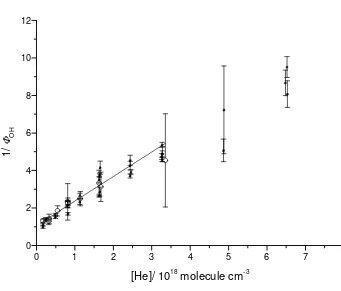
Discussion
A steady-state solution of the coupled rate equations generated from Scheme 1, using
the strong collision assumption gives an equation for the OH yield that can be
expressed in a linearized form (Stern Volmer plot):
[M] 1
(M) 1
C M
OH k
k + =
Φ
(E3)where kM/kC is the Stern Volmer constant. Fitting equation (E3) to the weighted data a
straight-line with a slope equal to kM/kC was obtained. Plots for the He and N2 data are
shown in Figures 2 and 3, respectively. For He as bath gas kM/kC = (1.31 ± 0.51)×10-18
molecule-1 cm3 was obtained (the uncertainties correspond to 95% confidence limits).
Figure 2 shows Stern Volmer plots from the current work and also from
previous studies on acetone photolysis [7,18] together with new data obtained in this
laboratory also using acetone photolysis:
CH3COCH3 + 248 nm → CH3CO + CH3 (R4)
The OH yields obtained with acetone photolysis are relative and were converted to
absolute yields by assuming that the zero pressure OH yield from R1 is unity and that
a strong collision model is valid. A value of kM/kC equal to (1.07 ± 0.06) × 10-18
molecule-1 cm3 was obtained [7], in good agreement, within error bars, with the
present study ((1.31±0.51) × 10-18 molecule-1 cm3). The CH3C(O)OH data confirm
calculations of Lee et al. [11] and Hou et al.[10] where at room temperature, OH is
almost exclusively the bimolecular product; the yield of HO2+CH2CO, the next most
facile bimolecular channel, was calculated by Hou et al.[10] to be ≤ 1%.
An advantage of the present study over our previous relative OH study is that this
internal OH standard method is independent of any other collisional stabilization in
the photolytic source. For example, there is good evidence from fluorescence studies
that the excited state in acetic acid is long-lived [19]. If it is collisionally stabilised,
then the yield of products is reduced but there is still a 1:1 relationship between OH
and CH3CO. In our previous relative OH study [7,18], it was assumed that the yield
of CH3CO following 248 nm acetone photolysis is independent of total pressure.
However, subsequent studies on acetone photolysis by Somnitz et al. [20] and
Khamaganov et al. [21] have observed a weak pressure dependence of the quantum
yield for acetyl formation which decreases slightly with increasing N2 bath gas
pressures. Applying a correction factor to the OH yields in Figures 2 for acetone
photolysis for this effect increase kM/kC by 16%. Nevertheless, in view of the good
agreement between the present results and our previous work, the assumption that the
acetyl formation from acetone photolysis is pressure independent seems to be
reasonable in He and in the range of pressures under which these experiments were
carried out (10-200 Torr). The present method has large error bars at higher pressures.
The OH yield from R1 decreases with increasing pressure and the experimental data
trace shows only a small growth on a large photolytic OH background. Analysing
such traces using equation E1 results in large errors in S1, which in turn propagate to
large errors in
Φ
OH(M). Moreover, any errors in the determination of either S0 or S1and their effects on the comparison in Figure 2 may mask any weak pressure
dependence in the acetyl yields from acetone photolysis.
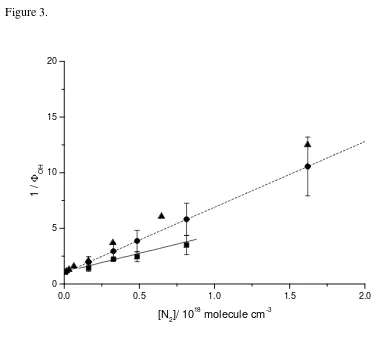
Figure 3 shows a Stern-Volmer plot of 1/
Φ
OH(M) vs. [M] for nitrogen as the buffergas, yielding kM/kC equal to (3.59 ± 0.60) × 10-18 molecule-1 cm3; about three times
higher than for helium, consistent with N2 being a more efficient quencher than He.
Consequently, at a given total pressure a smaller OH yield is obtained in N2 than in
He. This is the reason, together with a larger quenching of the LIF OH signal by N2,
why measurements were made over a smaller total pressure range. The results of this
study together with those of Tyndall et al. [8,22] and Hou et al. [10] are plotted in
Figure 3. The OH yields shown in Figure 3 for the work from Tyndall et al.[8] have
been recalculated from the original data using Fc =1. Note that in the original
reference [8], incorrect values of the rate coefficients are given, as a result of an
incorrect fitting routine. The new fit gives kM/kC to be equal to 5.9 × 10⁻¹⁸ molecule-1
cm3 [22]. Our results show a factor of ca. one and a half less quenching of
CH3CO(O2)* than the work from Tyndall et al. [8,22] and ca. two and a half less
quenching than the work from Hou et al. [10]. The reasons for this discrepancy are
not clear. The present study is absolute and directly measures the OH, in contrast with
the study of Tyndall et al. [8] in which OH yields were indirectly obtained by FTIR
monitoring of the stable products coupled with the fitting of kinetic data. The
theoretical study by Hou et al., that obtained smaller OH yields, using multichannel
RRKM theory, appears to be in better agreement with the Tyndall et al. data.
However, in the master equation calculations the quenching parameter is highly
potential energy surface, the calculation would better fit our data. These calculations
have been performed and will be described in detail in a forthcoming paper.
Conclusions
A novel method of studying the absolute OH yield from the CH3CO + O2 (+M)
reaction is presented based on acetic acid photolysis at 248 nm which produces equal
concentrations of CH3CO and OH. By adding O2 to the system, the absolute OH yield
from CH3CO + O2 (+M)is assigned by comparison of the ensuing growth of OH with
the instant, photolytic OH signal, which acts as internal standard. The OH yield from
CH3CO + O2 was observed to depend on the pressure and is close to unity at zero
pressure. This result is in agreement with previous measurements of relative OH
yields in helium made in this laboratory; both studies gave a similar OH Stern Volmer
constant. Measurements of the OH yield from CH3CO + O2 in N2 buffer gas show
less quenching than found in measurements in another laboratory.
Acknowledgments
This work, including a studentship to SAC, was supported by EPSRC
(GR/T28560/01) and the EU funded programme SCOUT.
The authors would like to thank Dr. G. S. Tyndall for his helpful comments in relation
FIGURES
Figure 1. Temporal evolution of OH following the 248 nm photolysis of acetic acid
and the reaction CH3CO+O2 (+M). The solid line represents a fit to the data using
equation (E1). T = 298 K, [N2] = 3.24 × 10¹⁷ molecule cm-3, [O2]= 5.58 × 10¹⁵
molecule cm-3, [acetic acid] = 5 ×10¹² molecule cm-3 , [OH] ∼ 2 ×10¹⁰ molecule cm-3.
The residuals are shown as the lower trace.
Figure 2. Plot of 1/
φ
OH versus [He] for CH3CO + O2 (+M) at room temperature usingtwo different acetyl radical sources. Open circles (acetic acid), squares (acetone from
[7,18] and new data obtained in this laboratory). The solid line represents a fit to the
data obtained in this work using equation (E3).
Figure 3. Comparison of OH yields using N2 as bath gas for CH3CO+O2 (+M)
obtained in this work (squares), by Tyndall et al.[8] (circles, data calculated using
equation E3 and a value of kM/kc= 8.9 × 10⁻¹⁸ molecule-1 cm3) and by Hou et al.[10]
(triangles), respectively. The solid and dashed lines represents a fit to the data
obtained in this work and the work from Tyndall et al. [8,22] (scaled values, see
Figure 1.
0.0 0.2 0.4 0.6 0.8 1.0
-0.2 0.0 0.2 0.4 0.6 0.8 1.0
S
0[O
H
]
/
a
rb
it
ra
ry
u
n
it
s
t / ms
S
1
Figure 2
0 1 2 3 4 5 6 7 8
0 2 4 6 8 10 12
1
/
Φ
O
H
Figure 3.
0.0 0.5 1.0 1.5 2.0
0 5 10 15 20
1
/
Φ O
H
Table 1. Absolute OH yields for CH3CO+O2 (+M) reaction as function of [He] at
room temperature. The quoted uncertainties correspond to 95% confidence limits.
No of
expt.
[M] / 1018
molecule cm-3
1 /
Φ
OH 1 /Φ
OHb k1a/ 10-12 k1a,b/ 10-1223 0.17 1.32 ± 0.09 1.18 ± 0.15 1.39 ± 0.37 1.80 ± 0.23
13 0.32 1.30 ± 0.18 1.35 ± 0.16 1.94 ± 0.94 1.95 ± 0.23
18 0.33 1.43 ± 0.24 1.35 ± 0.16 1.38 ± 0.60 1.96 ± 0.23
11 0.55 1.85 ± 0.27 1.59 ± 0.18 3.21 ± 0.60 2.16 ± 0.24
12 0.81 2.33 ± 0.97 1.87 ± 0.21 2.6 ± 1.0 2.36 ± 0.27
29 0.82 2.27 ± 0.26 1.88 ± 0.21 2.29 ± 0.31 2.36 ± 0.27
22 1.14 2.50 ± 0.38 2.23 ± 0.26 1.97 ± 0.85 2.58 ± 0.30
9 1.63 3.33 ± 0.67 2.75 ± 0.34 2.16 ± 0.67 2.84 ± 0.36
12 1.67 3.13 ± 0.78 2.80 ± 0.35 4.6 ± 1.2 2.87 ± 0.36
6 3.35 4.55 ± 2.48 4.60 ± 0.70 --- 3.54 ± 0.53
a
In molecule-1 cm3 s-1
b
Generated using the data given in [7] together with new data obtained in this laboratory using 248 nm
acetone photolysis as CH3CO source and assuming a unit yield of OH at zero pressure and a strong
Table 2. Absolute OH yields for the CH3CO+O2 (+M) reaction as a function of [N2]
at room temperature. The quoted uncertainties correspond to 95% confidence limits.
No of expt. 10-18 [N2] / molecule cm-3 1 /
Φ
OH39 0.16 1.43 ± 0.29
27 0.33 2.22 ± 0.10
18 0.48 2.45 ± 0.45
References
(1) R Atkinson, DJ Baulch, RA Cox, RF Hampson, JA Kerr, MJ Rossi, J Troe, J. Phys. Chem. Ref. Data 29 (2000) 167.
(2) EW Kaiser, CK Westbrook, WJ Pitz, Int. J. Chem. Kinet. 18 (1986) 655. (3) GS Tyndall, TA Staffelbach, JJ Orlando, JG Calvert, Int. J. Chem. Kinet. 27
(1995) 1009.
(4) MA Blitz, DE Heard, MJ Pilling, J. Phys. Chem. A 110 (2006) 6742-56. (5) MTB Romero, MA Blitz, DE Heard, MJ Pilling, B Price, PW Seakins, L
Wang, Faraday Discuss. 130 (Atmospheric Chemistry) (2005) 73-88.
(6) BJ Finlayson-Pitts, JN Pitts: Chemistry of the Upper and Lower Atmosphere, Academic Press, London, 1999.
(7) MA Blitz, DE Heard, MJ Pilling, Chem. Phys. Lett. 365 (2002) 374-79. (8) GS Tyndall, JJ Orlando, TJ Wallington, MD Hurley, Int. J. Chem. Kinet. 29
(1997) 655.
(9) JV Michael, DG Keil, RB Klemm, J. Chem. Phys. 83 (1985) 1630-6. (10) H Hou, A Li, H Hu, Y Li, H Li, B Wang, J. Chem. Phys. 122 (2005)
224304/1-04/11.
(11) J Lee, C-J Chen, JW Bozzelli, J. Phys. Chem. A 106 (2002) 7155-70.
(12) SR Arnold, MP Chipperfield, MA Blitz, J. Geophys. Res. (Atmos) 110 (2005) D22305/1-D05/14.
(13) CE McDade, TM Lenhardt, KD Bayes, J. Photochem. 20 (1982) 1-7. (14) SS Hunnicutt, LD Waits, JA Guest, J. Phys. Chem. 93 (1989) 5188-95.
(15) NI Butkovskaya, A Kukui, N Pouvesle, GL Bras, J. Phys. Chem. A 108 (2004) 7021-26.
(16) JJ Orlando, GS Tyndall, J. Photochem. Photobiol A 157 (2003) 161-66. (17) R Atkinson, DL Baulch, RA Cox, JN Crowley, RF Hampson, RG Hynes, ME
Jenkin, MJ Rossi, J Troe, Atmos. Chem. Phys. 6 (2006) 3625-4055.
(18) MTB Romero, MA Blitz, DE Heard, MJ Pilling, B Price, PW Seakins, Chem. Phys. Lett. 408 (2005) 232-36.
(19) M Suto, X Wang, LC Lee, 92 (1988) 3764-8.
(20) H Somnitz, M Fida, T Ufer, R Zellner, PCCP 7 (2005) 3342-52.
(21) V Khamaganov, R Karunanandan, A Rodriguez , JN Crowley, PCCP (2007) DOI: 10.1039/b701382e.
![Table 2. Absolute OH yields for the CH3CO+O2 (+M) reaction as a function of [N2]](https://thumb-us.123doks.com/thumbv2/123dok_us/8080881.228891/18.595.82.513.182.326/table-absolute-oh-yields-ch-co-reaction-function.webp)
