This is a repository copy of
The use of Rasch analysis as a tool in the construction of a
preference based measure: the case of AQLQ
.
White Rose Research Online URL for this paper:
http://eprints.whiterose.ac.uk/10918/
Monograph:
Young, T., Yang, Y., Brazier, J. et al. (1 more author) (2007) The use of Rasch analysis as
a tool in the construction of a preference based measure: the case of AQLQ. Discussion
Paper. (Unpublished)
HEDS Discussion Paper 07/01
Reuse
Unless indicated otherwise, fulltext items are protected by copyright with all rights reserved. The copyright exception in section 29 of the Copyright, Designs and Patents Act 1988 allows the making of a single copy solely for the purpose of non-commercial research or private study within the limits of fair dealing. The publisher or other rights-holder may allow further reproduction and re-use of this version - refer to the White Rose Research Online record for this item. Where records identify the publisher as the copyright holder, users can verify any specific terms of use on the publisher’s website.
Takedown
If you consider content in White Rose Research Online to be in breach of UK law, please notify us by
HEDS Discussion Paper 07/01
Disclaimer:
This is a Discussion Paper produced and published by the Health Economics
and Decision Science (HEDS) Section at the School of Health and Related
Research (ScHARR), University of Sheffield. HEDS Discussion Papers are
intended to provide information and encourage discussion on a topic in
advance of formal publication. They represent only the views of the authors,
and do not necessarily reflect the views or approval of the sponsors.
White Rose Repository URL for this paper:
Once a version of Discussion Paper content is published in a peer-reviewed
journal, this typically supersedes the Discussion Paper and readers are invited
to cite the published version in preference to the original version.
Published paper
None.
H
H
e
e
a
a
l
l
t
t
h
h
E
E
c
c
o
o
n
n
o
o
m
m
i
i
c
c
s
s
a
a
n
n
d
d
D
D
e
e
c
c
i
i
s
s
i
i
o
o
n
n
S
S
c
c
i
i
e
e
n
n
c
c
e
e
D
Di
i
sc
s
cu
us
ss
si
io
on
n
P
P
a
a
pe
p
e
r
r
Se
S
er
r
i
i
e
e
s
s
No. 07/01
The Use of Rasch Analysis as a Tool in the
Construction of a Preference Based
Measure: The Case of AQLQ
Tracey Young1, 2, Yaling Yang1, John Brazier1, Aki Tsuchiya1, 3
1
School of Health and Related Research, The University of Sheffield
2
Trent RDSU, ICOSS, The University of Sheffield
3
Department of Economics, The University of Sheffield
Corresponding author:
Tracey Young
School of Health and Related Research The University of Sheffield
Regent Court 30 Regent Street Sheffield S1 4DA
Telephone: +44 (0)114 2220837 Fax: +44 (0)114 2724095
E-Mail: [email protected]
Acknowledgements
This study is funded by Novartis. John Brazier is funded by the Medical Research
Council Health Service Research Collaboration. The “Trial” dataset was provided by
Novartis. The “Observation” dataset was collected by the COGENT project at the
University of Newcastle, funded by the NHS programme “Methods to promote the
uptake of research findings”. We are grateful to Professor Alan Tennant, University of
Leeds, for his advice on Rasch analysis techniques. The usual disclaimer applies.
SUMMARY
The majority of quality of life instruments are not preference-based measures and so
cannot be used within cost utility analysis. The Asthma Quality of Life Questionnaire
(AQLQ) is one such instrument. The aim of this study was to develop a health state
classification that is amenable to valuation from the AQLQ.
Rasch models were applied to samples of responders to the AQLQ with the aim of i)
selecting a number of items for a preference based utility measure (AQL-5D), ii)
reducing the number of levels for each item to a more manageable number of levels for
establishing AQL-5D. Selection of items for the evaluation survey was supported with
conventional psychometric criteria for item selection (feasibility, internal consistency,
floor and ceiling effects, responsiveness and regression against overall health).
The role of Rasch analysis in reducing the number of item levels to a preconceived
target number of levels proved unsuccessful. However, Rasch analysis proved to be a
useful tool in assisting in the initial process of selecting items from an existing HRQL
alongside conventional psychometric testing to aid in the development of
preference-based measures.
INTRODUCTION
Rasch analysis is a mathematical modelling technique [Rasch, 1960] commonly used
in education in the development and validation of assessments and examination
papers [Willmott & Fowles, 1974; Bhakta et al, 2005]. It is increasingly being used in
health related quality of life (HRQL) studies in the development of new quality of life
questionnaires [See for example: Duncan et al, 2003; Gilworth et al, 2004; Pesudoves,
Garamendi & Elliott, 2004] and in the validation of existing questionnaires [See for
example: Raczek et al, 1998; White & Velozo, 2002; Valderas, Aonso & Prieto, 2004].
However, to date Rasch analysis has not been used in the development of a
preference based utility index.
This paper presents an approach to the process of selecting items and reducing the
number of item levels using Rasch analysis, for deriving a much smaller classification
system that is amenable to valuation. The approach described here develops the
methodology adopted for the short form (SF)-36, where the 36 item, eight dimension
instrument was reduced to a six dimension health state classification [Brazier, Roberts
& Deverill, 2002; Brazier et al, 1998]. The advantage of a health state classification
system is that each dimension of the classification has X levels, and by selecting one
level from each dimension it is possible to derive a unique health state. In this way the
SF-6D, for example, derives 18,000 health states, these states constitute six
statements and have been shown to be amenable to evaluation.
This paper uses a case study of the Asthma Quality of Life Questionnaire (AQLQ),
which has been designed to assess health related quality of life (HRQL) in patients with
alongside conventional psychometric methods, firstly to select items for a preference
based utility index and secondly to reduce the existing number of levels of the AQLQ
from seven to a more manageable number. In this paper we do not argue that Rasch
analysis is offering a single formulaic solution to the problem of developing a health
state classification from an evaluative measure of HRQL. What we attempt to show is
how Rasch analysis can help ensure this process to a solution makes the best use of
the richness and sensitivity of the original instrument. A companion paper describes a
study that values the resulting health state classification system [Yang et al, In
submission].
The AQLQ
The AQLQ is a 32 item instrument that was designed to assess HRQL in patients with
asthma. It asks a series of questions across four domains: symptoms (12 items),
activity limitations (11 items), emotional function (5 items) and environmental stimuli (4
items). For each item the respondent is asked to choose from a series of seven levels,
ranging from extreme problems (level 1) to no problems (level 7).
Level responses are converted into scores which range from 1 (level 1) to 7 (level 7)
and scores are summed and averaged over items to obtain a domain score, or an
overall score across all 32 items. This potentially generates too many states for
valuation and states that would too large for valuation using choice-based preference
elicitation techniques.
Two versions of the AQLQ exist which are virtually identical, with the exception of the
first five items: the “individualised” version of the AQLQ asks respondents to choose
of these chosen activities has been limited by asthma within the previous two weeks,
whereas the “standardised” version of the questionnaire asks how asthma has limited
strenuous, moderate, social, work related activities or sleeping. The aim of the Rasch
analysis was to select a number of items to be used in the development of a preference
based measure that were common to both the standardised and individualised versions
of the AQLQ.
An Overview of Rasch Analysis
Rasch analysis is a mathematical technique that converts qualitative (categorical)
responses to a continuous (unmeasured) latent scale using a logit model, and can be
conceptualised as “a statistical approach to the measure of human performance,
attitudes and perceptions” [Tesio, 2003]. In relation to HRQL questionnaires, Rasch
analysis converts each categorical item (question) to a continuous latent scale, where
the scale is conceived to be a continuous measure of HRQL.
Tennant [Tennant, 2004] describes the concept behind Rasch analysis, as applied to
HRQL instruments, and explains that HRQL can be measured on a latent (“ruler”) scale
where:
• the underlying scale is independent of the person measuring the scale
• points on the ruler may be added together
• there is an ordering across the scale, i.e. the higher one is on the ruler scale the
better ones’ HRQL
examination or test. When applying Rasch analysis to HRQL responses, each
respondent’s position on the underlying latent (HRQL) scale accounts for a person’s
degree of health problems. To apply Rasch models to HRQL instruments it is assumed
that: patients with more severe problems should indicate they have difficulties with
more items (tasks) described in the instrument than patients with less severe problems.
It is further assumed that the easier an item (task) is to achieve the more likely it will be
achieved [Tennant, 2004].
An Illustration of Rasch Analysis
To illustrate the concept of Rasch analysis, let us take a hypothetical three-item
questionnaire given to patients with asthma, where the response option for each item is
dichotomous (as a result of my asthma I suffer/do not suffer from symptom X). The
three items ask about the presence or absence of symptoms relating to: shortness of
breath, wheezing and clearing the throat. Further, in terms of asthma symptoms
shortness of breath is regarded as more severe than wheezing, which, in turn, is
regarded as more severe than clearing the throat. Let us also assume that the
questionnaire is asked of three patients with asthma:
• Patient A has severe asthma and suffers from shortness of breath, wheezing
and clearing their throat
• Patient B has moderate asthma and suffers from wheezing and clearing their
throat
• Patient C has minor asthma and has problems clearing their throat
Under the Rasch model it is assumed that the underlying HRQL of Patient C, the least
the worst HRQL (Figure 1). Further, patients with asthma suffering from shortness of
breath are assumed to have worse HRQL than patients suffering from wheezing, and
patients suffering from wheezing are assumed to have worse HRQL than those
suffering with clearing their throat.
Figure 1 about here
The Rasch Rating Scale Model
The Rasch model used in this paper is known as the Rasch rating scale model and is
fitted to allow for multi level item responses to all items, as is the case with the AQLQ,
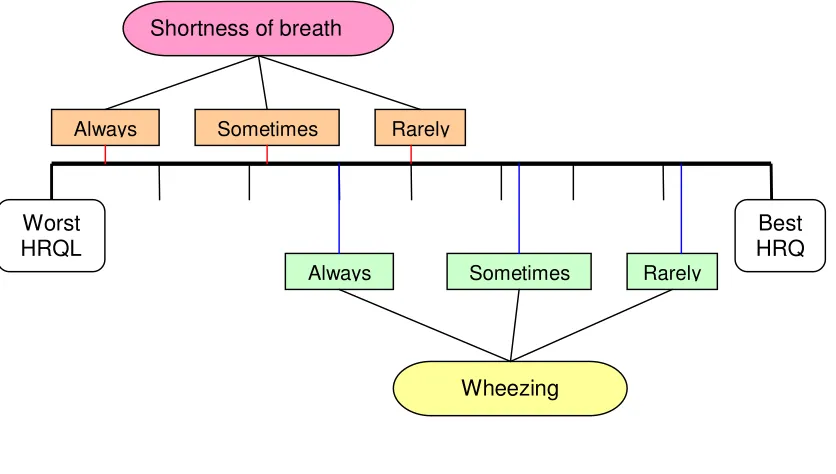
where the latent (ruler) scale for item levels may overlap between items. For example,
let us consider two items, one asking about shortness of breath and the other
wheezing, where patients may answer always, sometimes or rarely for each item. The
illustration in Figure 2 shows that, on average, the HRQL of patients with wheezing is
generally better than that for patients who suffer from shortness of breath. However,
patients who state they are rarely short of breath can have better HRQL than patients
who are always wheezing.
Figure 2 about here
The Rasch rating scale model allows for multi level responses and assumes that item
and patient responses are independent variables that may be estimated separately.
The mathematical formula for the model is set out below.
)
,
,
(
1
ln
n i jnij nij
f
p
p
τ
δ
θ
=
−
where pnij is the probability of patient n with asthma severity
θ
n responding to item iThe next section of this paper sets out the role of Rasch analysis, alongside
psychometric criteria, in the development of a health state classification for AQLQ. The
section also sets out the role of Rasch analysis in the reduction of the number of item
levels of the items selected for the health state classification.
METHODS
Using Rasch Analysis to Develop a Health-State Classification – the AQL-5D
From an economists perspective Rasch analysis helps to understand the relationship
between items (and item levels) and HRQL, but not the appropriate weighting for a
health state classification system. A Rasch model may indicate that one item response
is worse than another for respondents, but it does not indicate anything about the
extent to which it would be preferred, this requires additional information on
preferences, and this is the subject of a companion paper [Yang et al, In submission].
Thus, the aim of this analysis is to create a health state classification measure by
selecting one item from each of the four AQLQ domains (symptoms, activity limitations,
emotional function and environmental stimuli); therefore, four Rasch models were fitted
one for each AQLQ domain. In addition the AQLQ asks a series of questions about
sleep (Items 5 [Standardised version only], 20, 24 and 29), so we aimed to select an
additional item for a fifth domain in the health state classification asking how asthma
affected sleep. A separate Rasch analysis for sleep related items was not conducted
here, but instead these items were selected from the Rasch analysis from the two
domains that included sleep items (symptoms and activity limitations).
Rasch Model Assumptions: Initial Selection of Items for AQL-5D
Prior to using Rasch to aid in the selection items for a preference based measure, it
was necessary to establish whether each of the four domains of the AQLQ fitted the
Rasch model. In other words, the first step was to validate whether the items of the four
AQLQ domains measured symptoms, activity limitations, emotional function and
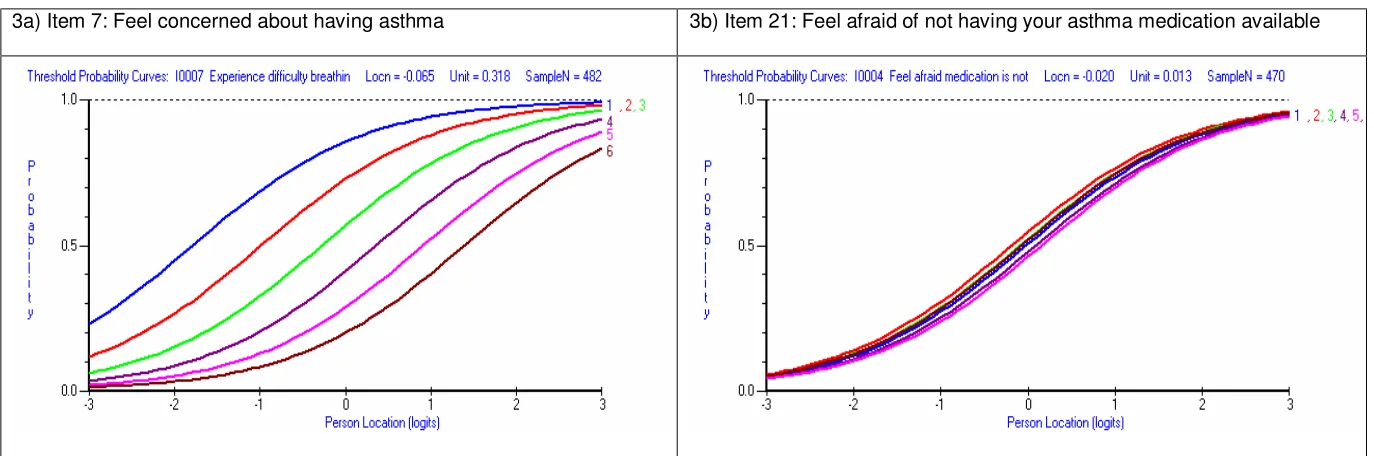
environmental stimuli HRQL. The first step in checking the fit of a Rasch model is to
identify items where responders to the AQLQ are unable to distinguish between item
response levels. This process is achieved by examining individual item threshold
probability curves (a plot of the probability of being in each item level across the latent
[HRQL] scale [Figure 3]). In Figure 3 the x-axis depicts the underlying latent (logit)
scale and the y-axis the probability of being in a particular item level. As an illustrative
example, if the latent (ruler) scale for each level of an item is ordered then respondents
are able to distinguish between item levels (Figure 3a), however if the latent scale is
unordered then responders have difficulty distinguishing between levels (Figure 3b). If
curves are unordered, adjacent item levels should be merged and the Rasch model
refitted using the merged levels. The merging step is repeated until all items are
ordered.
Figure 3 about here
The selection of the appropriate item levels to merge is left to the analyst, using a
summary of the frequency of responses at each item level aids this choice, and
eyeballing the threshold probability curve and merging levels where curves lie close
Levels may be collapsed generically, across all items in a questionnaire
(notwithstanding the ordering within a particular item) by questionnaire domain, or
individually item by item. The choice is left to the analyst and may be dependent on the
number of items being examined (if a questionnaire contained a large number of items
it may be preferable to collapse generically across the whole questionnaire). In the
initial stage of developing the AQL-5D items are collapsed at the individual item level.
After ordering has been achieved across all items the goodness of fit statistics for the
overall Rasch model are examined. The overall goodness of fit of the Rasch model is
measured in terms of item-trait (HRQL) interaction, the person separation index and
the person and item fit residuals. These are described below.
The item-trait interaction measures whether data fit the Rasch model for discrete
groups of responders. The groups are selected by dividing the responders into a series
of subgroups based upon where each responder lies on the latent scale of the Rasch
model. Thus responders who tend to have similar HRQL for an AQLQ domain will be
grouped together. Observed and expected responses are compared across items and
traits and the difference between these responses is summarised using the
χ
2 teststatistic. A good fitting Rasch model should have no deviation between the observed
and expected responses and therefore the convention is that the p-value for the overall
model
χ
2 statistic should be greater than 0.01 for a good fitting model [Kubinger,2005].
The person separation index (PSI) measures the level of agreement between
agreement between respondents. A PSI of 0.7 or more indicates a well fitting Rasch
model [Nunnally, 1978].
Fit residuals estimate the amount of divergence between the expected and observed
responses for each respondent or item response; fit residuals are summed over all
items (item fit residuals) or summed over all persons (person fit residuals). The
residuals are standardised to approximate the Z-score and therefore the mean item or
person fit residual should be approximately zero with a standard deviation
approximately equal to one.
If the overall item-trait fit of the model is statistically significant (p < 0.01), i.e. poor
Rasch model goodness of fit, the fit of each of the individual items included in the
Rasch model should be examined. As with the overall model goodness of fit, items with
an individual
χ
2p-value of < 0.01 are said not to fit the Rasch model, in other words
these items do not contribute to the underlying latent scale, i.e. symptom, activity
limitation, emotional function or environmental stimuli HRQL. The item with the lowest
p-value (that is < 0.01) is removed, the model is refitted and the overall goodness of
fitness statistic examined for the new model. The process is repeated until only well
fitting items remain and the overall item-trait goodness of fit of the model is greater than
0.01.
Once the model fit is satisfied the analyst is left with a sub-sample of items for each of
the AQLQ domains and the process of selecting items for AQL-5D can begin.
AQL-• Items were not common to both the individualised and standardised versions
of the AQLQ (We wished to derive a preference based measure that could be
used with both versions)
• At the initial Rasch model fitting stage the item levels needed collapsing due
to responders being unable to distinguish between levels
• Items were eliminated as they did not fit the Rasch model (did not measure
the underlying HRQL trait: symptoms, activity limitations, emotional function
or environmental stimuli)
Using Psychometric Criteria in the Development of AQL-5D
Tennant and colleagues state that quality of life measures should be “unidimensional
… and have good traditional psychometric properties” [Tennant, 2004]. Therefore, the
performance of the AQLQ was also tested using five conventional psychometric
criteria: feasibility (rate of missing data), internal consistency (correlation between item
and domain scores), distribution of responses (e.g. the absence of ceiling or floor
effects), and responsiveness (between baseline and follow-up visits). In addition, we
examined the relationship between item responses and general health in order to
establish independent criteria for describing the correlation of an item with HRQL.
The five criteria were applied across all 32 AQLQ items and were used as a further
method for identifying and eliminating items from inclusion in a health state
classification system. These criteria were chosen to represent conventional
psychometric criteria for assessing instruments. Though the cut-off levels chosen for
each criterion is arbitrary (unless stated otherwise in the text), there main purpose is to
select those items that perform best against each criteria. The five methods are
1. Feasibility – Prevalence of missing data
A high prevalence of missing data reduces the usefulness of an item. Overall, the
AQLQ had very low levels of missing data, so the cut off was set at 1% for inclusion
in a health state classification system.
2. Internal Consistency – Correlation of an item score and its domain score
We hypothesised that if the correlation between an item and its domain score was
poor that the item was not representative of the domain. Spearman’s correlation
coefficient was calculated for each item to domain score. The cut off value for the
criteria was ≤ 0.65.
3. Distribution of responses across the seven response
Since AQL-5D will be covering the spectrum of asthma with a smaller number of
items, it is important that items utilise the whole range of 7 response levels rather
than just a few of them. Specifically, it is important for the items not to suffer from
floor or ceiling effects i.e. a large proportion of respondents indicating they are in
the worst or best level, which limits the ability of an item to assess change below or
above the floor or ceiling range. The distribution of respondents’ answers was
examined across the seven levels of response. If the proportion of responders in
the extreme levels (i.e. level 1 or level 7) was over 20% the item was rejected.
4. The responsiveness at two time points – Standardised Response Mean
Responsiveness is generally defined as the ability of an instrument to detect a
change when it has occurred, and thus, it is a test to be used for time series data
possible ways to calculate this, the standardised response mean (SRM) was used, defined as: SRM =
)
(
Deviation
Standard
)
(
Average
b f b fx
x
x
x
−
−
Where x represents the item score and subscripts f and b represent follow-up and
baseline data respectively. There is no gold standard for good or acceptable levels
of responsiveness, but SRM such as this conventionally use the criterion for a
“small” effect size of ≤ 0.2 established by Cohen [Cohen, 1978].
5. Regression coefficients between a general health indicator and the item
Items selected for AQL-5D will on the one hand present specific domains of asthma
related quality of life, and on the other hand represent a component of a more
general concept of HRQL. In other words, an ideal item will be correlated with some
measure of overall health. This was pursued by regression analysis between the
general health question of the SF-36 (as the dependent variable) and the individual
AQLQ items (as categorical explanatory variables). Technically, and strictly
speaking, the use of an SF-36 item as a continuous dependent variable is
problematic, but this was intended as an exploration of the importance of each item
with respect to the patients’ overall health. A very low R² would suggest that the
item has little to do with the patient’s perception of their health. The criterion was
set at R² ≤ 0.15.
Using Rasch Analysis to Select Items for AQL-5D
Any item that remained in the AQLQ after the above exclusion criteria had been
applied was considered as a potential candidate for inclusion in AQL-5D. Item selection
space, where the wider the spread the better the item. The logit (latent) scale in Rasch
analysis is centred at zero (See Figure 3) and the different levels of an item should be
spread evenly across the latent space, therefore, items with a greater spread of levels
at logit 0, represented items where the respondent was more likely to distinguish
between item levels. Item (
χ
2) goodness of fit statistics and results from the fivepsychometric tests were also taken into consideration when selecting items.
Using Rasch Analysis to Collapse Item Levels
Once five items were selected for AQL-5D the authors attempted to collapse the
number of item levels, per selected item, from seven to a smaller number. It was felt
that five would be a reasonable number for respondents in the evaluation survey [Yang
et al, In submission] to distinguish between when imagining the hypothetical health
states. The choice of five levels was chosen a priori to all Rasch and psychometric
analysis. A further requirement of the level collapsing was to generically collapse item
levels for the five selected items to aid responders in the evaluation survey to
distinguish between health states, given that four of the five items share a common set
of response choices.
Further Rasch analysis was used in order to collapse seven levels to five levels, where
threshold probability curves were examined and item levels that were closer together,
in comparison with other levels were merged. Each of the selected items was
examined using Rasch analysis within the domain level Rasch models (symptoms,
activity limitations, emotional function, environmental stimuli).
AQLQ Datasets
Two data sets of asthma AQLQ responders were used in this study. The “Trial” data
comes from a multinational trial, and included patients with severe persistent asthma
[Humbert et al, 2005]. Patients filled in the individualised version of the AQLQ on
several occasions throughout the trial period. For this paper, patients from the
treatment and placebo arms are not distinguished, and unless otherwise stated,
analyses are based on 482 “baseline” observations of this Trial data. However, there
were three exceptions.
Firstly, since the responsiveness analysis (psychometric criteria 4) needs more than
one observation, the baseline and follow-up information from the Trial data were used.
Furthermore, in order to carry out the regression analysis the SF-36 was needed
(psychometric criteria 5), so information from a second dataset, known as the
“Observation” dataset was used. The Observation data set comes from a UK trial of
computerised decision support (and thus observational in a therapeutic sense), with
3,000 patients covering a wide range of asthma severities [Eccles et al, 2000]. The
Observation data set included both the AQLQ and the SF-36 questionnaire.
Lastly, three Rasch analyses were conducted for the symptoms, environmental
function and environmental stimuli domains, but regarding the activity domain, given
that the first five questions of the individualised version of the questionnaire depend on
the responder’s choice of activities, it was felt to be inappropriate to include the
responses to these questions in the item selection process. Therefore, in order to
supplement for this, data from the Observation dataset was introduced. The
consisting of 2,119 cases. Rasch models were fitted to a random sample of 413 cases
from the Observation data set for the activity domain of the AQLQ.
Using Rasch Analysis to Validate Item Choice
The aims of the validation were threefold: firstly to confirm the validation of item
selection across different samples of responders to the AQLQ (the Trial and
Observation populations). Secondly, to confirm the validity of item responses across
randomly chosen samples from the same population (the Observation dataset) and
thirdly to confirm the validity of the Rasch model for a larger sample of patients (N =
880).
Further samples of data were drawn from the Observation dataset to validate the
Rasch model item selection for all four domains of the AQLQ. After excluding the 413
cases randomly selected for the main item selection process the remaining 1706
responders in the Observation dataset were divided into three further random samples:
two samples consisted of 413 randomly selected patients and the third sample
consisted of the remaining 880 responders.
RESULTS
At the initial stage of the development of AQL-5D four Rasch models were fitted to
AQLQ responders, one for each of the AQLQ domains. Examination of items on the
latent scale across the seven levels of item response for each of the four models
(domains) of the AQLQ showed that responders were unable to distinguish between
levels for the following items: 30 (symptoms), 4 (activity), 11 (activity), 25 (activity), 28
unordered items. Items were collapsed individually in each Rasch model.
Notwithstanding the individual item approach, ordering of levels was achieved by
collapsing the two mildest levels of item response (none and very little problems) the
two most severe levels (problems all or the majority of the time) and the three middle
levels across all unordered items, leaving just three levels for each of these items. The
eight items that needed collapsing in the initial stage of item selection were excluded
from consideration in the AQL-5D.
The next step in the initial Rasch analysis was to make sure that each of the four
AQLQ domains achieved overall Rasch model goodness of fit (measured from the
overall model item-trait [HRQL]
χ
2statistic). To achieve this the individual item
goodness of fit
χ
2statistics were examined and items that did not fit the Rasch model
(Item fit p-value < 0.01) were removed one at a time until the overall Rasch model
item-trait goodness of fit p-value exceeded 0.01. The following poorly fitted items were
excluded from the four Rasch models and were excluded from selection in AQL-5D:
items 12, 16 and 30 from the symptoms domain
items 1, 5, 11, 19 and 28 from the activity limitations domain
item 17 from the environmental stimuli domain
It was unnecessary to exclude any item from the emotion domain.
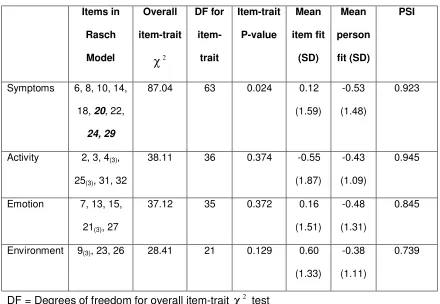
Table 1 summarises the overall Rasch model statistics for each of the four AQLQ
domains. All Rasch model goodness of fit requirements are met for all four AQLQ
Table 1 about here
Elimination of Items Using Psychometric Criteria
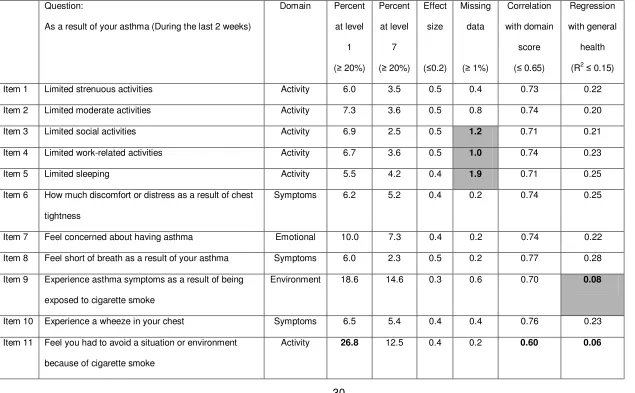
The results from the conventional psychometric tests are presented in Table 2, where
items not meeting the test criteria are highlighted in bold. This resulted in a further
seven items being removed from the selection process: items 3, 4, 9, 20, 21, 25 and
26. With items 1 to 5 being excluded due to lack of commonality between the two
versions of the AQLQ this left a possible 15 items for inclusion in AQL-5D (eight items
from the symptoms domain, two from the activity limitations domain, four from the
emotional function domain and one in the environmental stimuli domain, where two of
the items in the symptoms domain asked about sleep).
Table 2 and 3 about here
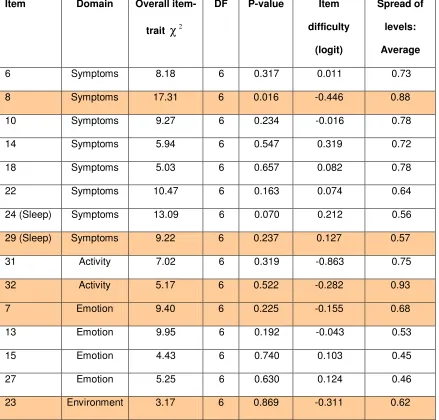
Table 3 summarises the statistics used in the selection process of remaining items for
AQL-5D. The statistics were taken from the four Rasch analysis performed on the
AQLQ domains. Given that only one item remained in the environmental stimuli domain
this item was automatically selected (Item 23). Two items remained for the activity
limitations domain; item 32 was selected as it had a better fitting
χ
2 statistic (lowerχ
2value) and had a slightly higher spread of probabilities across levels at logit 0. Two
items also remained that asked about sleep, item 29 had a better fitting
χ
2 statisticand had a slightly higher spread of probabilities across levels at logit 0 and was
therefore selected. Item 8 was selected from the remaining non-sleep related
symptoms items due to having the greatest spread of probabilities across levels at logit
Rasch models and item selection were validated on three further datasets using the
item selection process described above. This validation process confirmed the
selection of items 7, 8, 23, 29 and 32 for AQL-5D across different samples (Trial and
Observational data), across randomly chosen samples from the same population
(Observational data) and confirmed the validity of Rasch analysis on a larger sample of
patients (N = 880). (Results available from the authors on request).
Collapsing Item Levels for the Five Selected Items
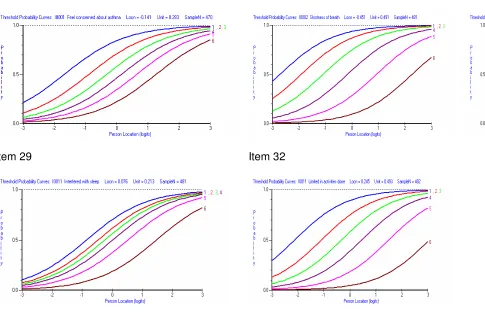
An attempt was made to use Rasch analysis to reduce the number of levels from seven
to five by studying the Rasch threshold probability curves for each selected item
(Figure 4). For each item, the item levels that corresponded to item level threshold
curves that were closest together were collapsed. However, various scenarios and
combinations of levels failed to produce five items that fitted within the Rasch
assumptions (item levels were no longer ordered when collapsed into five levels and
threshold plots suggested that levels should be collapsed further). Therefore,
consensus was reached, partially based on Rasch results and through agreement
amongst the authors, which levels should be collapsed: for items 7, 8, 23 and 29 which
asked about how asthma effected the responders in terms of time, levels were
collapsed as follows: none of the time, a little or hardly any of the time, some of the
time, most of the time and all of the time. The wording for item levels for item 32 is
related to limitations and the five levels were chosen as follows: not at all limited, a little
limited, moderate or some limitation, extremely or very limited and totally limited. Figure
5 presents the final version of the reduced preference based measure AQL-5D used in
the evaluation stage of the study [Yang et al, In submission].
DISCUSSION
The first stage of deriving a preference-based single index measure from the AQLQ for
use in calculating QALYs was to derive a health state classification system from the
AQLQ that is amenable to valuation using a preference elicitation technique. Rasch
modelling was applied alongside conventional psychometric methods to identify a
number of AQLQ items, one from each AQLQ domain plus a further item on sleep, that
adequately represent the AQL-5D. A valuation survey has been undertaken on a
sample of AQL-5D states using a sample of the UK general population and
econometric models, fitted to survey responses, in order to predict health state values.
These will enable the calculation of QALYs based on AQLQ data, these results are
reported elsewhere [Yang et al, In submission]. The approach taken here to identify
items for AQL-5D, to our knowledge, has not been used previously in the derivation of
a preference based measure.
After the initial stages of the Rasch and psychometric analysis, where poorly
performing items were eliminated from the analysis, and items that were not common
to both versions of the AQLQ excluded, a total of 15 possible items were available from
which to choose items for AQL-5D. Rasch analysis was then used in the second stage
to select, what were felt to be, the best performing items per AQLQ domain. Finally, the
number of item levels was reduced from seven to five, although this process was
based in part on author opinion and judgement rather than the Rasch analysis results.
The approach used here suggests that Rasch analysis should be used as a
complementary method with psychometric criteria as neither method identified all 16
obvious reasons why conventional methods failed to identify these three items, though
this could be due to the arbitrary exclusion criteria chosen. Similarly, three items
identified by conventional methods were not identified in the Rasch analysis (Items 3,
20 and 26). The proportion of common items excluded by both approaches was 10/16
(= 63%: Items 4, 5, 9, 11, 16, 17, 19, 21, 25 and 28). These results could be unique to
this data set, however the results were cross-validated using another data set.
To the best of our knowledge, this is the first time that Rasch analysis has been used in
the selection process for a preference based measure and no guidance currently exists
on the most appropriate method for selecting items. We wished to select the best
performing items from each domain for inclusion in a preference based measure and,
at the item selection stage, there was sometimes little to distinguish between items for
a particular domain. In this analysis, items were selected based primarily upon the
spread of item levels at logit 0 using results from threshold probability curves, where
respondents were believed to be making full use of the range of possible responses.
However, it is possible that other approaches could be equally applicable. For example,
choosing the best fitting model according to the item
χ
2 statistic, had this approachbeen used a slightly different set of items would have been chosen: 15, 18, 23, 29 and
32.
The choice of Rasch analysis performed (one per AQLQ domain) and the selection of
responders to be included in the Rasch analysis could also be varied, e.g. conducting a
separate Rasch analysis for sleep related items rather than selecting items from the
Rasch analysis from the two domains that included sleep items. Additionally, we could
have selected a mixture of baseline and follow-up data from the Trial data set.
data set and, even with a larger samples size, one set included 880 responders, our
selection of items for a preference based measure appeared justified.
In addition to its role in the selection of items for a preference based measure Rasch
analysis has inadvertently been used as a validation tool for the four AQLQ HRQL
domains, by checking the assumptions that the items selected for each domain are
appropriate and measure the underlying latent trait (HRQL).
The role of Rasch analysis in the collapsing of the number of levels to a preconceived
target of five levels proved unsuccessful. However, this might be explained by the fact
that when the five items were initially selected, one of the selection criteria was the
spread of item levels – where the wider the item spread the better, and the chosen
items typically had evenly spread item levels. Therefore, any attempt to reduce the
number of levels resulted in violation of Rasch model assumptions. However, Rasch
analysis can also be used to examine the appropriateness of giving responders seven
possible respondent choices per item. Analysis not presented here showed that if all
items were generically collapsed ordering of levels was achieved across all items using
three levels (none and very little problems, problems all or the majority of the time and
combining the three middle item levels). However, it was felt that three levels may not
be sensitive enough to adequately capture patients’ self reported health preferences.
Further, the results from the valuation survey showed that individuals were able to
distinguish between five item level categories [Yang et al, In submission]
This work has made it possible to derive patient utilities and subsequently QALYs from
which is a 15 item shortened version of AQLQ and a 23 item paediatric version of the
AQLQ (PAQLQ) which exists both as a standardised version and an individualised
version [Juniper et al, 1996]. Our analysis focused primarily of deriving a health state
classification obtained from the full 32 item AQLQ and therefore, at present AQL-5D
can not be derived from mini-AQLQ or PAQLQ due to:
• differences in wording for those items common to both AQL-5D (for example
item levels are phrase in terms of bother rather than limitations in PAQLQ)
• the alternative instrument combining items (mini-AQLQ combines AQLQ item
23 with 25, AQLQ item 29 with 24 and AQLQ item 32 with items 1 to 5)
• the item not being present in the alternative instruments (item 23 not in PAQLQ)
Rasch analysis has proved to be a useful tool in assisting in the initial process of
selecting items from an existing HRQL instrument in the construction of a preference
based measure. The method recommended should be used alongside traditional
psychometric criteria to aid in the development of health state classifications for
preference-based measures. The process inevitably involves compromises and some
difficult decisions, but using Rasch analysis alongside conventional psychometrics
ensures the best use of the description of the original questionnaire. Whilst far from
perfect, it represents an improvement on past practice [Brazier et al, 2007], such as
that used to develop the health state classification for the SF-6D [Brazier, Roberts &
Deverill, 2002; Brazier et al, 1998], and some earlier preference based summary
REFERENCES
Beaton DE, Bombardier C, Katz JN, Wright JG. A taxonomy for responsiveness. J Clin
Epidemiol, 2001; 54(12): 1204-1217
Bhakta B, Tennant A, Horton M, Lawton G, Andrich D. Using item response theory to explore
the psychometric properties of extended matching questions examination in undergraduate
medical education. BMC Med Educ 5(9) http://www.biomedcentral.com/1472-6920-5-9 [2005]
Brazier JE, Ratcliffe J, Tsuchiya A, Solomon J. Measuring and valuing health for economic
evaluation. Oxford: Oxford University Press, 2007
Brazier J, Roberts J, Deverill M. The estimation of a preference-based measure of health from
the SF-36. J Health Econ, 2002; 21(2):271-292
Brazier J, Usherwood T, Harper R, Thomas K. Deriving a preference-based single index from
the UK SF-36 health survey. J Clin Epidemiol, 1998; 51(11): 1115-1128
Cohen J. Statistical power analysis for the behavioural sciences. New York Academic Press,
1978
De Bruin AF, Diederiks JPM, De Witte LP, Stevens FCJ, Philipsen H. Assessing the
responsiveness of a functional status measure: the Sickness Impact Profile versus the SIP68. J
Clin Epidemiol, 1997; 50(5): 529-540
Duncan PW, Bode RK, Min Lai S, Perera S, Glycine Antagonist in Neuroprotection Americans
Investigators. Rasch analysis of a new stroke-specific outcome scale: the Stroke Impact Scale.
Eccles M, Grimshaw J, Steen N, Parkin D, Purves I, McColl E, et al. The design and analysis of
a randomized controlled trial to evaluate computerized decision support in primary care: the
COGENT study. Fam Pract, 2000; 17(2):180-186
Gilworth G, Chamberlain MA, Bhakta B, Haskard D, Silman A, Tennant A. Development of the
BD-HRQL: a quality of life measure specific to Behcet’s disease. J. Rheumatol, 2004; 31(5):
931-937
Humbert M, Beasley R, Ayres J, Slavin R, Hebert J, Bousquet J, et al. Benefits of omalizumab
as add-on therapy in patients with severe persistent asthma who are inadequately controlled
despite best available therapy (GINA 2002 step 4 treatment): INNOVATE. Allergy, 2005; 60(3):
309-316
Juniper EF, Buist AS, Cox FM, Ferrie PJ, King DR. Validation of a standardized version of the
Asthma Quality of Life Questionnaire. Chest, 1999; 115(5): 1265-1270
Juniper EF, Guyatt GH, Cox FM, Ferrie PJ, King DR. Development and validation of the mini
asthma quality of life questionnaire. Eur Respir J, 1999; 14(1): 32-38
Juniper EF, Guyatt GH, Feeny DH, Ferrie PJ, Griffith LE, Townsend M. Measuring quality of life
in children with asthma. Qual Life Res, 1996; 5(1): 35-46
Juniper EF, Guyatt GH, Ferrie PJ, Griffith LE. Measuring quality of life in asthma. Am Rev Resp
Dis, 1993; 147(4): 832-838
Kubinger KD. Psychological test calibration using the Rasch model – Some critical suggestions
on traditional approaches. International Journal of Testing, 2005; 5(4): 377-394
Pesudovs K, Garamendi E, Elliott DB. The quality of life impact of refractive correction (QIRC)
questionnaire: development and validation. Optom Vis Sci, 2004; 81(10): 769-777
Raczek AE, Ware JE, Bjorner JB, Gandek B, Haley SM, Aaronson NK, et al. Comparison of
Rasch and summated rating scales constructed from SF-36 physical functioning items in seven
countries: Results from the IHRQLA project. J Clin Epidemiol, 1998; 15(11): 1203-1214
Rasch G. Probabilistic models for some intelligence and attainment tests. Chicago: University of
Chicago Press, 1960: Reprinted 1980
Rasch Unidimensional Measurement Models (RUMM) 2020 ©. RUMM Laboratory Pty Ltd
1997-2004
SPSS for Windows, Release. 12.0.1. 2003. Chicago: SPSS Inc. 2003
Tennant A, McKenna S.P. Hagell P. Application of Rasch analysis in the development and
application of quality of life instruments. Value Health, 2004; 7(Supplement 1): S22-S26
Tesio L. Measuring behaviours and perceptions: Rasch analysis as a tool for rehabilitation
research. J Rehabil Med, 2003; 35(6): 105-15
Valderas JM, Alonso J, Prieto L. Content-based interpretation aids for health-related quality of
life measures in clinical practice. An example for the visual function index (VF-14). Qual Life
Res, 2004; 13(1): 35-44
White LJ, Velozo CA. The use of Rasch measurement to improve the Oswestry classification
Willmott AS, Fowles DE. The objective interpretation of test performance: The Rasch model
applied. Windsor NFER, 1974
Wright JG, Young NL. A comparison of different indices of responsiveness. J Clin Epidemiol,
1998; 50(3): 79-93
Yang Y, Tsuchiya A, Brazier J, Young TA. Estimating a preference-based single index from the
Table 1: Summary of Rasch Goodness of Fit Statistics for the Four AQLQ Domains Items in Rasch Model Overall item-trait 2
χ
DF for item-trait Item-trait P-value Mean item fit (SD) Mean person fit (SD) PSISymptoms 6, 8, 10, 14,
18, 20, 22,
24, 29
87.04 63 0.024 0.12
(1.59)
-0.53
(1.48)
0.923
Activity 2, 3, 4(3),
25(3), 31, 32
38.11 36 0.374 -0.55
(1.87)
-0.43
(1.09)
0.945
Emotion 7, 13, 15,
21(3), 27
37.12 35 0.372 0.16
(1.51)
-0.48
(1.31)
0.845
Environment 9(3), 23, 26 28.41 21 0.129 0.60
(1.33)
-0.38
(1.11)
0.739
DF = Degrees of freedom for overall item-trait
χ
2 testPSI = Person separation index
(3) = Denotes items where number of levels was collapsed to three to ensure ordering
of levels
[image:33.595.78.518.129.433.2]Table 2: Overall Summary of Five Psychometric Criteria for each of the 32 AQLQ Items (failed items are in bold)
Question:
As a result of your asthma (During the last 2 weeks)
Domain Percent at level
1 (≥ 20%)
Percent at level
7 (≥ 20%)
Effect size
(≤0.2)
Missing data
(≥ 1%)
Correlation with domain
score (≤ 0.65)
Regression with general
health (R2≤ 0.15)
Item 1 Limited strenuous activities Activity 6.0 3.5 0.5 0.4 0.73 0.22
Item 2 Limited moderate activities Activity 7.3 3.6 0.5 0.8 0.74 0.20
Item 3 Limited social activities Activity 6.9 2.5 0.5 1.2 0.71 0.21
Item 4 Limited work-related activities Activity 6.7 3.6 0.5 1.0 0.74 0.23
Item 5 Limited sleeping Activity 5.5 4.2 0.4 1.9 0.71 0.25
Item 6 How much discomfort or distress as a result of chest tightness
Symptoms 6.2 5.2 0.4 0.2 0.74 0.25
Item 7 Feel concerned about having asthma Emotional 10.0 7.3 0.4 0.2 0.74 0.22 Item 8 Feel short of breath as a result of your asthma Symptoms 6.0 2.3 0.5 0.2 0.77 0.28 Item 9 Experience asthma symptoms as a result of being
exposed to cigarette smoke
Environment 18.6 14.6 0.3 0.6 0.70 0.08
Item 10 Experience a wheeze in your chest Symptoms 6.5 5.4 0.4 0.4 0.76 0.23 Item 11 Feel you had to avoid a situation or environment
because of cigarette smoke
Question:
As a result of your asthma (During the last 2 weeks)
Domain Percent at level
1 (≥ 20%)
Percent at level
7 (≥ 20%)
Effect size
(≤0.2)
Missing data
(≥ 1%)
Correlation with domain
score (≤ 0.65)
Regression with general
health (R2≤ 0.15) Item 12 How much discomfort or distress have you felt as a
result of coughing
Symptoms 7.1 8.1 0.3 0.2 0.70 0.21
Item 13 Feel frustrated as a result of your asthma Emotional 11.2 10.0 0.4 0.0 0.79 0.24 Item 14 Experience a feeling of chest heaviness Symptoms 4.0 9.2 0.4 0.4 0.77 0.23 Item 15 Feel concerned about the need to use medication for
your asthma
Emotional 11.8 16.8 0.3 0.0 0.75 0.17
Item 16 Feel the need to clear your throat Symptoms 10.6 5.0 0.2 0.6 0.59 0.17 Item 17 Experience asthma symptoms as a result of being
exposed to dust
Environment 17.0 6.6 0.4 0.0 0.77 0.09
Item 18 Experience difficulty breathing out as a result of your asthma
Symptoms 5.4 5.8 0.4 0.2 0.74 0.22
Item 19 Feel you had to avoid a situation or environment as a result of being exposed to dust
Activity 14.3 10.6 0.2 0.0 0.67 0.12
Question:
As a result of your asthma (During the last 2 weeks)
Domain Percent at level
1 (≥ 20%)
Percent at level
7 (≥ 20%)
Effect size
(≤0.2)
Missing data
(≥ 1%)
Correlation with domain
score (≤ 0.65)
Regression with general
health (R2≤ 0.15) Item 21 Feel afraid of not having your asthma medication
available
Emotional 21.8 21.4 0.3 0.2 0.77 0.13
Item 22 Feel bothered by heavy breathing Symptoms 7.5 9.1 0.5 0.0 0.76 0.22 Item 23 Experience asthma symptoms as a result of the
weather or air pollution outside
Environment 13.7 5.4 0.5 0.2 0.69 0.18
Item 24 Were woken at night by your asthma Symptoms 8.8 15.2 0.4 0.4 0.76 0.17 Item 25 Avoid or limit going out because of the weather or air
pollution
Activity 7.7 20.4 0.3 0.4 0.65 0.24
Item 26 Experience asthma symptoms as a result of being exposed to strong smells or perfume
Environment 10.8 16.0 0.3 0.2 0.74 0.15
Item 27 Feel afraid of getting out of breath Emotional 11.0 15.8 0.4 0.2 0.76 0.24 Item 28 Feel you had to avoid a situation or environment
because of strong smells or perfume
Activity 11.7 20.0 0.2 0.4 0.55 0.16
Question:
As a result of your asthma (During the last 2 weeks)
Domain Percent at level
1 (≥ 20%)
Percent at level
7 (≥ 20%)
Effect size
(≤0.2)
Missing data
(≥ 1%)
Correlation with domain
score (≤ 0.65)
Regression with general
health (R2≤ 0.15) Item 31 How much has your range of activities you would like
to have done been limited by your asthma
Activity 9.4 4.2 0.5 0.4 0.71 0.30
Item 32 Among all the activities you have done how limited have you been by your asthma
Table 3: Summary of Item Statistics for 15 Potential AQLQ Items for Inclusion in
a Preference Based Measure by Domain
Item Domain Overall
item-trait
χ
2DF P-value Item
difficulty
(logit)
Spread of
levels:
Average
6 Symptoms 8.18 6 0.317 0.011 0.73
8 Symptoms 17.31 6 0.016 -0.446 0.88
10 Symptoms 9.27 6 0.234 -0.016 0.78
14 Symptoms 5.94 6 0.547 0.319 0.72
18 Symptoms 5.03 6 0.657 0.082 0.78
22 Symptoms 10.47 6 0.163 0.074 0.64
24 (Sleep) Symptoms 13.09 6 0.070 0.212 0.56
29 (Sleep) Symptoms 9.22 6 0.237 0.127 0.57
31 Activity 7.02 6 0.319 -0.863 0.75
32 Activity 5.17 6 0.522 -0.282 0.93
7 Emotion 9.40 6 0.225 -0.155 0.68
13 Emotion 9.95 6 0.192 -0.043 0.53
15 Emotion 4.43 6 0.740 0.103 0.45
27 Emotion 5.25 6 0.630 0.124 0.46
23 Environment 3.17 6 0.869 -0.311 0.62
DF = Degrees of freedom for overall item-trait
χ
2Figure 1: Illustration of Patient Response Scale for Three Hypothetical Patients
on a Ruler/Latent Scale (Rasch Model)
Figure 2: Illustration of Item Response Scale for Two Items for Multi-Level Item
Responses (Three Levels)
Worst HRQL
Best HRQ
Wheezing Shortness of breath
Sometimes
Always Rarely
Always Sometimes Rarely Worst
HRQL
Best HRQ
HRQL for Patient A
HRQL for Patient B
[image:39.595.95.492.161.347.2] [image:39.595.87.505.487.724.2]Figure 3: Illustration of the Ordering of Threshold Curves for Two AQLQ Items
3a) Item 7: Feel concerned about having asthma 3b) Item 21: Feel afraid of not having your asthma medication available
Figure 4: Initial Probability Threshold Curves for Items 7, 8, 23, 29 and 32 of the AQLQ Prior to Item Level Collapsing
Item 7 Item 8 Item 23
Figure 5: The Reduced Health State Classification System
CONCERN
5. Feel concerned about having asthma all of the time. 4. Feel concerned about having asthma most of the time. 3. Feel concerned about having asthma some of the time.
2. Feel concerned about having asthma a little or hardly any of the time. 1. Feel concerned about having asthma none of the time.
SHORT OF BREATH
5. Feel short of breath as a result of asthma all of the time. 4. Feel short of breath as a result of asthma most of the time. 3. Feel short of breath as a result of asthma some of the time.
2. Feel short of breath as a result of asthma a little or hardly any of the time. 1. Feel short of breath as a result of asthma none of the time.
WEATHER & POLLUTION
5. Experience asthma symptoms as a result of air pollution all of the time. 4. Experience asthma symptoms as a result of air pollution most of the time. 3. Experience asthma symptoms as a result of air pollution some of the time.
2. Experience asthma symptoms as a result of air pollution a little or hardly any of the time.
1. Experience asthma symptoms as a result of air pollution none of the time.
SLEEP
5. Asthma interferes with getting a good night’s sleep all of the time. 4. Asthma interferes with getting a good night’s sleep most of the time. 3. Asthma interferes with getting a good night’s sleep some of the time.
2. Asthma interferes with getting a good night’s sleep a little or hardly any of the time. 1. Asthma interferes with getting a good night’s sleep none of the time.
ACTIVITIES
5. Overall, totally limited with all the activities done.
4. Overall, extremely or very limited with all the activities done. 3. Overall, moderate or some limitation with all the activities done. 2. Overall, a little limitation with all the activities done.