Int. J. Electrochem. Sci., 12 (2017) 2777 – 2790, doi: 10.20964/2017.04.58
International Journal of
ELECTROCHEMICAL
SCIENCE
www.electrochemsci.org
Electrochemical Degradation of Phenol Wastewater by
Sn-Sb-Ce Modified
Granular Activated Carbon
Ping Li, Wangfeng Cai, Yue Xiao, Yan Wang*, Jiangyang Fan
School of Chemical Engineering and Technology, Tianjin University, Tianjin, 300354, China *
Email: wangyan170112@126.com
Received: 13 January 2017 / Accepted: 4 March 2017 / Published: 12 March 2017
Electrochemical degradation of phenol wastewater using Sn-Sb-Ce modified granular activated carbon (SCG) particle electrode was investigated. The electro-catalytic performance of different SCG electrodes were investigated by cyclic voltammetry (CV) and polarization plots. The scanning electron microscope accompanied with energy dispersive X-ray spectroscopy (SEM-EDS), X-ray diffraction (XRD) and Brunauer-Emmett-Teller (BET) were investigated in order to characterize the surface morphology of SCG particle electrode. The effects of volume flow rate, current density and initial pH value on removal of phenol and chemical oxygen demand (COD) were studied. Results demonstrated that at volume flow rate of 0.15 L min-1, current density of 25mA cm-2 and initial pH value of 3, the optimal phenol and COD removal could reach 88.93% and 84.21%. Average current efficiency (ACE) and energy consumption (EC) were 16.25% and 0.2474 KWh gCOD-1, respectively. These results demonstrated that SCG electrode would be a promising particle electrode for electrochemical degradation of phenol.
Keywords: Electrochemical degradation; particle electrode; phenol wastewater; three-dimensional electrode; COD removal
1. INTRODUCTION
As an electrochemical method, three-dimensional electrode technology has become the mainstream of research. Three-dimensional electrode technology has been successful applied to deal with many wastewater, such as paper mill wastewater [16], dye wastewater [17, 18], oil refinery wastewater [19, 20] and phenolic wastewater [21-24]. Usually, bio-refractory of the wastewater is declined when confronted to three-dimensional electrode technology [25, 26]. Thus, three-dimensional electrode technology is a practical and feasible way to deal with organic contaminant.
Compared to conventional two-dimensional electrode, three-dimensional electrode technology is constructed by adding particle electrodes between anode and cathode. When proper potential is applied across the particulate packed bed, the particle electrodes are polarized and become many microelectrodes. It is obvious that the introduction of particle electrode can enhance reaction area, increase the rate of transmission and reduce energy consumption [27]. Thus, the efficiency of degradation organic pollutions in three-dimensional electrodes is much higher than that in conventional two-dimensional electrodes.
In recent years, researches about three-dimensional reactor degradation of organic wastewater draw attention on not only the design of reactors but also the use and selection of particle electrodes. It is obvious that particle electrodes have a vital role in organic degradation efficiency. Traditional particle electrodes include activated carbon [24], carbon aerogel [22, 28], which have shown good performance in this electrochemical technology. In order to further increase the efficiency of three-dimensional electrode, many researchers have begun to modify particle electrode and better results have been achieved. He et al. [29] studied the performance of kaolin-based particle electrodes for deal with methyl orange wastewater, higher degradation efficiency and better stability were obtained during experiments. Chen et al. [30] investigated electrochemical degradation of dinitrotoluene wastewater by Sn-Sb-Ag-modified ceramic particulates. And the experiment exhibited better performance on COD removal and biodegradability. These results are ascribed to the doping for particle electrodes. Taking the excellent adsorption ability and low price of granular activated carbons (GAC) into consideration, we prepared and designed Sn-Sb-Ce modified GAC (SCG) as particle electrodes for electrochemical oxidation of phenol wastewater.
In this paper, we discussed the optimum loading conditions to create best performance of SCG electrodes for electrochemical degradation of phenol wastewater. The structure and morphology of SCG were also investigated by SEM-EDS, XRD and BET. Particular attention was focused on difference of COD and phenol removal between SCG and GAC electrodes. The optimal experimental conditions (volume flow rate, current density, and initial pH value) in electrochemical oxidation process were also investigated.
2. EXPERIMENTAL
2.1 Reagents and phenolic wastewater
2.2 Particle electrode preparation
The GAC particulates were washed by tap water and distilled water several times by turns, sequentially soaked in dilute hydrochloric acid for 2 hour and then dried at 105℃ for 24 hours. These pretreated GAC particulates were dipped into n-butanol solution containing 0.5 mol L-1 SnCl4 and 0.05 mol L-1 SbCl3 for 3 hours in oscillated instrument with 170 rpm at 25℃, dried at 80℃ for 7 hours in vacuum drying chamber and then calcined at 500℃ for 2 hours with the protection of nitrogen. Then they were introduced to the n-butanol solution containing certain concentration of CeNO3, and the following procedures were the same as the above. The SCG particulates were prepared by repeating above procedures several times. According to the molar ration of Sn: Ce in dipping solution, the electrodes were signed as 1% SCG (Sn: Ce=50: 0.5), 2% SCG (Sn: Ce=50: 1), 6% SCG (Sn: Ce=50: 3), 10% SCG (Sn: Ce=50: 5).
2.3 Electrochemical degradation of phenol wastewater
The three-dimensional electrode reactor is shown in Fig. 1. The reactor was made of Plexiglas with dimensions of 60×50×120 mm. Ti/IrO2-TaO2 electrode was used as anode with an area of 50×130×1 mm, and a Ti plate with the same area was used as cathode. The distance of the two electrodes was 60 mm.
Figure 1. Schematic diagram of three-dimensional electrode reactor. (1) Magnetic stirrer; (2) Phenol wastewater; (3) peristaltic pump; (4) inlet; (5) outlet; (6) DC power; (7) Ti/IrO2-TaO2 electrode; (8) Ti electrode; and (9) particle electrode.
[image:3.596.159.423.411.617.2]
wastewater was prepared by dissolving 100 mg L-1 phenol in deionized water with 0.15 mol L-1 Na2SO4 as electrolyte. The initial pH value of phenol wastewater was adjusted to a certain value through addition of 0.1 mol L-1 NaOH or H2SO4 solution. A peristaltic pump which can adjust the volume flow rate was used to pump the phenol wastewater into the reactor. And regulated DC power (DC 30V/5A, RXN-305D, ZhaoXin Corporation, China) was used to provide electric power under galvanostatic conditions. Each experiment run for 2 hours and sample was taking at every 20 min for following analysis during the experiment.
2.4 Analytical methods
The morphology and structure of the SCG were studied by SEM-EDS (S4800, Hitachi High-Technologies Corporation, Japan), XRD (D/Max-3C diffractometer, Japan) using Cu Kα radiation and BET (Micrometerics ASAP 2020 M apparatus, McKesson Corporation, USA). Polarization plots and CV curves were analyzed by electrochemical workstation (CHI 660D, CH Instrumental Corporation, China)
The chemical oxygen demand (COD) value and phenol removal efficiency were chosen as the parameters to evaluate the effect of degradation. COD was measured by COD-571 meter (LeiCi Corporation, China). And concentration of phenol was measured by 4-aminoantipyrine method using 752 Spectrophotometer (LENG GUANG, China) in 520 nm wavelength. The initial pH value was determined by PHS-25/3C meter (LeiCi Corporation, China)
Average current efficiency (ACE) and energy consumption (EC) were calculated by following equations.
(1)
(2)
Where COD t+Δt and COD t are the COD (g L-1) values at t+Δt and t, F is Faraday constant
(96487C mol-1), I is the current (A), V is the volume of the solution (L), and U is the average cell potential (V).
3. RESULTS AND DISCUSSION
3.1. Electrochemical property of SCG electrodes
3.1.1 The effect of different molar ratios SCG electrodes on electro-catalysis property
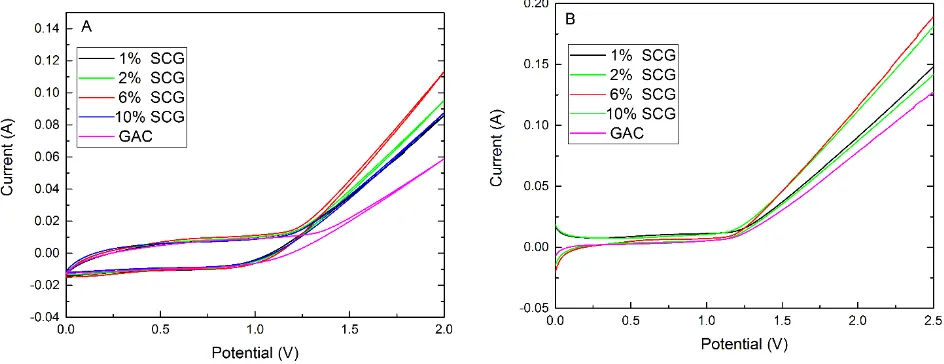
decreases to a low value. It could be explained as follows: the defects such as vacancy or cavity caused by adulteration of Ce increase with the addition of Ce concentration. As a result, it enhance electric-catalytic property of Sn-Sb components. However, too much Ce concentration would destroy the lattice of electrode coating and enlarged the degree of disorder. Therefore, the electro-catalytic effect of particle electrode on organic pollutants decline. The area of the organic electrolyte CV curves can calculate the number of voltammetric charge participated in the electrochemical reaction quantitatively [31-33]. And voltammetric charge is derived from the organic oxidation- reduction reaction at the surface of active sites. So the number of the voltammetric charge can show the reaction area of packed bed. The bed expansion coefficient in SCG compared to GAC is: 1% SCG: 2% SCG: 6% SCG: 10% SCG=1.44: 1.53: 1.86: 1.41. The results suggest that 6% SCG electrode shows an excellent electro-catalytic property.
Fig. 2(B) displays that under the same potential (1.2 V-2.5 V), feed current of 6% SCG electrode is higher than other SCG electrodes in polarization plots. The reason is that in the polarization tests, 6% SCG occurs more oxidation-reduction reactions than GAC in electrode surface. The results are similar with CV curves. To sum up, 6% SCG (Sn: Sb: Ce=50: 5: 3) electrode is the optimum Ce concentration.
Figure 2. CV curves (A) and polarization plots (B) of electrode in 100 mg L-1 phenol with 0.15 mol L-1 NaSO4. (1% SCG: Sn: Sb: Ce=50: 5: 0.5; 2% SCG: Sn: Sb: Ce=50: 5: 1; 6% SCG: Sn: Sb: Ce=50: 5: 3; 10% SCG: Sn: Sb: Ce=50: 5: 5. Operation condition: polarization test scanning rate 10 mV s-1, CV test scanning rate 20 mV s-1)
3.1.2 The effect of loading times on electro-catalytic property
[image:5.596.56.528.355.537.2]
reaction for the charge and reactant molecules. Moreover, with the addition of loading time, active component which does not exist in the carbon aperture could run away rapidly. The same tendency is also found in polarization plots in Fig. 3(B). It can be observed that the feed current in second time loading is just little higher than that of first time loading. While for the third time loading, the feed current declines a lot. So in terms of cost and many other factors, we use the 6% SCG which was loaded only once as the best particle electrodes.
Figure 3. CV curves (A) and polarization plots (B) of 6% SCG (Sn: Sb: Ce=50: 5: 3) in 100 mg L -1
phenol solution with 0.15 mol L-1 NaSO4. (Operation condition: polarization test scanning rate 10 mV s-1, CV test scanning rate 20 mV s-1)
3.2. Characterization of prepared SCG electrode
[image:6.596.61.534.201.382.2]EDS analysis was carried out to determine elements and concentration of SCG particle electrodes, and the result is shown in Table 1.
Table 1. Chemical compositions of SCG particle electrodes determined by EDS
Element Concentration (mass %)
O 63.16
Sn 25.19
Sb 7.89
Ce Cl
2.06 1.7
It can be seen that all of the elements used in the loading experiments are detected in the EDS analysis, indicating that all of these elements are successfully loaded in the surface of carbon.
[image:6.596.41.562.573.660.2]
electrode, the 6% SCG electrode displays no crack and compact morphology, improving the extent of electrode polarization and electro-catalytic property. It is mainly attributed to the cover of carbon surface structure by active component.
A B
Figure 4. SEM surface images un-doped GAC (A); 6% SCG (B) magnification (magnification: 13000×)
[image:7.596.57.543.147.345.2]The comparison of XRD patterns for GAC electrode and 6% SCG electrode are depicted in Fig.5.
Figure 5. XRD pattern of GAC and SCG (◇C, △SnO2, ▽Sb2O5).
[image:7.596.184.414.473.666.2]
of GAC electrode, which conforms to deposition mechanism of carbon base [34]. For the spectrum of SCG, the diffraction peaks at 2Ѳ of 26.51, 33.75 and 51.9 are attributed to the plane (110), (101) and (211) of SnO2 (JCPDS, no 77-0452), respectively. The main XRD pattern of Sb2O5 appeared at 2Ѳ of 28.906, according to JCPDS, no 33-0110. But we do not find the diffraction peak of CeO2, which means the CeO2 is dispersed into crystal lattice of SnO2.
[image:8.596.41.553.277.356.2]Table 2 presents the BET specific surface area, pore volume and average pore size of GAC and SCG electrodes. A lower specific surface area and pore volume are found when active components are introduced into GAC electrode. It also interprets why the loading time of active material was only once.
Table 2. Structure properties of GAC and SCG electrodes
Sample SBET (m2 g-1) VP (cm3 g-1)
GAC 1025.80 0.66155
SCG 779.481 0.48953
3.3. Enhancement in electrochemical degradation of phenol wastewater by SCG
The electrochemical degradation of phenol wastewater by SCG was run 15 times under the same conditions, and the results are represented in Fig. 6. The phenol and COD removal are stable relatively and the decline of phenol and COD removal are only 3.9% and 5%, suggesting the stability and repeatability of the SCG particle electrode.
[image:8.596.45.552.637.715.2]The results of the removal of phenol and COD by GAC, SCG and AC/SnO2-Sb electrode [35] are shown in Table 3. It can be observed that the removal of phenol and COD by SCG and AC/SnO2-Sb electrodes are much higher than that of GAC electrode. In addition, the removal of phenol and COD by SCG electrode is 88.93% and 84.2%, compared with 79.52% and 78.43% of that by AC/SnO2-Sb electrode. It indicated that SCG electrode has good effect on electrochemical degradation of phenol.
Table 3. The comparison of different particle electrodes
Different particle electrodes GAC SCG AC/SnO2-Sb
Removal of phenol (%) 73.61 88.93 79.52
Figure 6. The variations of phenol and COD removal under the same conditions (current density 25 mA cm-2, volume flow rate 0.15 L min-1, initial pH value 8).
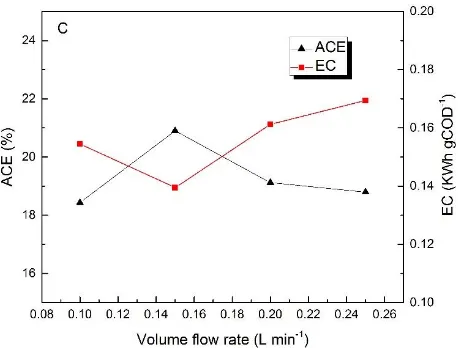
3.4 Effects of three-dimensional electrochemical system on degradation of phenol 3.4.1 Effect of volume flow rate
[image:9.596.181.405.71.254.2]
Figure 7. Effect of volume flow rate on phenol removal (A), (B) COD removal (B) and ICE、 EC (C) (initial pH value 8.0, current density 25 mA cm-2).
Fig. 7(C) represents the changes in ACE and EC during the reaction. When the volume flow rates are 0.10, 0.15, 0.20 and 0.25 L min-1, the ACE are 18.43%, 20.9%, 19.12% and 18.79%. And the relative EC are 0.1545, 0.1395, 0.1621 and 0.1694 KWh gCOD-1 .It is obviously that when the volume flow rate is 0.15 L min-1, current energy obtained the best usage. Thus, the best optimum volume flow rate is 0.15 L min-1.
3.4.2 Effect of current density
As an important variable parameter of electrochemical process, current density is found to influence not only the electrochemical degradation but also polarization performance of particle electrodes [36]. Fig. 8 shows the effect of current density ranging from 5 mA cm-2 to 35 mA cm-2 on the electrochemical degradation of phenol using SCG electrode. As shown in Fig. 8(A)-(B), an increase in current density from 5 mA cm-2 to 25 mA cm-2, lead to an increase of phenol removal from 79.7% to 89.15% and COD removal from 50.6% to 75.45%. The reasons to explain the results are that the increase of current density improves the generation of hydroxyl radical and the charge loading, thus promotes the removal of COD and phenol. However, when current density further increases to 35 mA cm-2, COD removal decreases to 73.2% and the same tendency is also observed in phenol degradation. It may be because that the higher current density lead to more side reactions (Eq. (3)-Eq. (4)).
(3)
(4)
[image:10.596.192.421.88.262.2][image:11.596.55.526.145.551.2]
Considering high COD removal and lower energy consumption, we choose 25 mA cm-2 as the best current density, the phenol and COD removal are 89.15% and 75.45%, while the ACE and EC are 13.95% and 0.2930 KWh gCOD-1
Figure 8. Effect of current density on phenol removal (A), COD removal (B) and ICE、EC (C) (initial pH value 8.0, volume flow rate 0.15 L min-1).
3.4.3 Effect of pH
It is well known that the initial pH value directly affects the charge and nature of interaction between oxidant and phenol solution [37]. Initial pH value that varied from 3 to 11 without any further treatment was used to study the degradation of phenol on the condition of volume flow rate 0.15L mL -1
, current density 25 mA cm-2.
75.45%, 62.77% and 58.33%. We can conclude that in the acidic condition, the removal of phenol and COD increases with the decrease of pH value. It can be ascribed that H+ would promote the generation of H2O2 and ·OH [38], and inhibit the evolution of oxygen. However, under the alkaline condition, it is not easy to find that the phenol and COD removal shows a trend of decline, especially for COD removal. The effect of higher pH on electrochemical reaction can be explained from two facts: one is that in alkaline condition, side effect (Eq. (4)) would be aggravated; the other is electrolyte would be consumed too fast, resulting a decline in conductivity of solution and increase of EC value [39].In addition, higher pH value also brings about the decrease of ACE, it is decreased by 2.3% (from16.25% to 13.95%), when pH is changed from 3 to 12 (Fig. 9(C)).The same tendency is also applied to EC. Under the alkaline condition, the EC reaches 0.3926 KWh gCOD-1 nearly 1.59 times higher than that of acid condition. Therefore, the optimum pH value for electrochemical degradation reaction of phenol is 3.
[image:12.596.60.527.278.687.2]
4. CONCLUSION
(1)The electrochemical property of SCG electrode was determined by CV and polarization plot. When element Sn, Sb and Ce molar rate was 50: 5: 3 and loading time was once, the electrochemical property could reach the best. The prepared SCG electrode was characterized by SEM-EDS, XRD and BET.
(2)The repeated experiment for degradation of phenol wastewater showed the stability and repeatability of the SCG particle electrode. The comparison among GAC, SCG and AC/SnO2-Sb electrodes in phenol degradation indicated the SCG electrode showed the best electro-catalytic property.
(3)Removal of 88.93% and 84.21% for phenol and COD was obtained at the best condition of volume flow rate 0.15 L min-1, current density 25 mA cm-2 and initial pH value 3. The optimum ACE and EC is 16.25% and 0.2474 KWh gCOD.
ACKNOWLEDGEMENTS
We are grateful for the financial support from Tianjin Research Program of Application Foundation and Advanced Technology (Grant No. 13JCQNJC03100).
References
1. S. Ahmed, M. G. Rasul, W. N. Martens, R. Brown and M. A. Hashib, Desalination, 261 (2010) 3. 2. J. Araña, V. M. R. López, J. M. D. Rodríguez, J. A. H. Melián and J. P. Peña, Catal. Today., 129
(2007) 185.
3. W. Zhen, F. F. Liang, Y. F. Liu, J. Wang, W. Q. Yao and Y. F. Zhu, Appl. Catal. B: Environmental, 201 (2017) 600
4. A. A. Monteiro, R. A. Boaventura and A. E. Rodrigues, Biochem. Eng. J., 6 (2000) 45. 5. V. L. Santos and V. R. Linardi, Process. Biochem., 39 (2004) 1001.
6. S. W. Tan, X. C. Chen, C. Z. Cui, Y. Hou, W. G. Li and H. Hou, Biotechnol. Lett., 39 (2017) 91 7. A. Marone, A. A. Carmona-Martinez, Y. Sire, E. Meudec, J. P. Steyer, N. Bernet and E. Trably,
Water Res., 100 (2016) 316
8. L. Chen, L. Lei and D. U. Yingxun, Acta Scientiae Circumstantiae, 24 (2004) 225. 9. K. Hanna, T. Kone and C. Ruby, Environl. Sci. Pollut. R., 17 (2010) 124.
10.N. Kang, S. L. Dong and J. Yoon, Chemosphere, 479 (2002) 15.
11.J. Iniesta, P. A. Michaud and C. Comninellis, Electrochim. Acta., 46 (2001) 3573. 12.X. Y. Li, Y. H. Cui, Y. J. Feng, Z. M. Xie and J. D. Gu, Water Res., 39 (2005) 1972.
13.J. Barbosa, A. Fernandes, L. Ciriaco, A. Lopes and M. J. Pacheco, Clean-Soil Air Water, 44 (2016) 1242
14.R. Berenguer, J. M. Sieben, C. Quijada and E. Morallón, Appl. Catal. B: Environmental, 199 (2016) 394
15.N. H. Ince and I. G. Apikyan, Water Res., 34 (2000) 4169. 16.W. Bo, W. Kong and H. Ma, J. Hazard. Mater., 146 (2007) 295. 17.N. R. Neti and R. Misra, Chem. Eng. J., 184 (2012) 23.
18.L. Xu, H. Zhao, S. Shi, G. Zhang and J. Ni, Dyes & Pigments, 77 (2008) 158.
19.L. Y. Wei, S. H. Guo, G. X. Yan, C. M. Chen and X. Y.Jiang, Electrochim. Acta., 55 (2010) 8615. 20.L. Yan, H. Ma, B. Wang, Y. Wang, Y. Chen and L. Yan, Desalination, 276 (2011) 397.
22.G. Lv, D. Wu and R. Fu, J. Hazard. Mater., 165 (2009) 961.
23.M. Zhou, Z. Wu, X. Ma, Y. Cong, Q. Ye and D. Wang, Separation & Purification Technology, 34 (2004) 81.
24.X. Zhu, J. Ni, X. Xuan, H. Li and J. Yi, Electrochim. Acta., 56 (2011) 1270.
25.A. Vlyssides, D. Arapoglou, S. Mai and E. M. Barampouti, Chemosphere, 58 (2005) 439. 26.Á. Anglada, A. Urtiaga and I. Ortiz, J. Cheml. Technol. Biot., 84 (2009) 1747.
27.J. O. M. Bock and J. Kim, J. Appl. Electrochem., 27 (1997) 890. 28.X. Wu, X. Yang, D. Wu and R. Fu, Chem. Eng. J., 138 (2008) 47.
29.W. He, Q. Ma, J. Wang, J. Yu, W. Bao and H. Ma, Appl. Clay. Sci., 99 (2014) 178. 30.Y. Chen, W. Shi, H. Xue, W. Han, X. Sun and J. Li, Electrochim. Acta., 58 (2011) 383. 31.O. Barbieri, M. Hahn, A. Herzog and R. Kötz, Carbon, 43 (2005) 1303.
32.S. Kumagai, M. Sato and D. Tashima, Electrochim. Acta., 114 (2013) 617.
33.Y. Liu, D. Yan, Y. Li, Z. Wu, R. Zhuo and S. Li, Electrochim. Acta.,117 (2014) 528. 34.J. H. Jang, S. Han, T. Hyeon and S. M. Oh, J. Power. Sources., 123 (2003) 79.
35.S. X. Yang, L. Z. Wang, B. Wu, B.Zhang and Z. N. Li, Chemical Industry and Engineering Progress, 35 (2016) 1230
36.C. T. Wang, W. L. Chou, Y. M. Kuo and F. L. Chang, J. Hazard. Mater., 169 (2009) 16. 37.S. Kumar, S. Singh and V. C. Srivastava, Chem. Eng. J., 263 (2015) 135.
38.38.W. Z. Tang and C. P. Huang, Chemosphere, 33 (1996) 1621
39.Q. Dai, H. Shen, Y. Xia, F. Chen, J. Wang and J. Chen, Separation & Purification Technology, 104 (2013) 9.