i
Applied Epidemiology of Communicable Disease at a National Level
Dr Amy Louise Burroughs
November, 2016
A thesis submitted for the degree of
Master of Philosophy (Applied Epidemiology) of
The Australian National University
Field placement:
Vaccine Preventable Diseases Surveillance Section, Office of Health Protection,
Australian Government Department of Health, Canberra
Funded by:
Australian Government Department of Health
NCEPH Supervisors:
Dr Kathryn Glass and Associate Professor Martyn Kirk
Field Supervisors:
Ms Rhonda Owen, Ms Cindy Toms and Dr Jennie Hood
ii
Declaration by author
This thesis is composed of my original work, and contains no material previously published or written by
another person except where due reference has been made in the text. I have clearly stated the contribution
by others to jointly-authored works that I have included in my thesis.
I have clearly stated the contribution of others to my thesis as a whole, including statistical assistance,
survey design, data analysis, significant technical procedures, professional editorial advice, and any other
original research work used or reported in my thesis. The content of my thesis is the result of work I have
carried out since the commencement of my research higher degree candidature and does not include a
substantial part of work that has been submitted to qualify for the award of any other degree or diploma
in any university or other tertiary institution.
iii
Acknowledgements
I have been very fortunate through my MAE to have wonderful supervision from Dr Kathryn Glass. Thank you Katie for being so quick to review my work and for always finding time to chat about methodologies and stats. I don’t think I could have handed in on time without your help! I have had a number of field supervisors throughout the two years (Ms Rhonda Owen, Ms Cindy Toms and Dr Jennie Hood) and they have all provided very useful input into my projects. I am particularly thankful to Rhonda for supporting my trip to WPRO; not all students can be so lucky. Thanks to Associate Professor Martyn Kirk for his support and for keeping me in mind for opportunities like WPRO and presenting at the AEA MAE day.
I am grateful to have two MAE alumni working on the same floor as me: Ms Anna Glynn-Robinson and Mr Tim Sloan-Gardner. Anna and Tim were so generous with their time and I don’t think I would have had such an easy introduction to and progression through the MAE without them. I am particularly thankful to have Ms Amy Bright and Ms Christina Bareja as mentors in the VPDS section. They allowed me the freedom to take charge of projects but were always available for any questions I had. The fact that they are delightful people didn’t hurt either. Thanks to Ms Oriana Wallace who joined the section half-way through my MAE but was such a lovely desk neighbour and I will miss our chats about all things STI related. Thanks also to Ms Kate Pennington and Dr Rachael de Kluyver for their mentorship and assistance with the ASPREN evaluation. Thanks to Mr Mark Trungrove and Ms Rachael Corvisy for making sure I understood where NNDSS data came from. I cannot name everyone here but coming to work really felt like being in an environment with friends.
Thanks to members of the NBBVSTI SSC, NISC, the Kimberley CA-MRSA Steering Group and CDNA for allowing me to present my work to you and for providing input into my projects. I learnt a lot about epi from simply sitting in on teleconferences.
Thanks to my family and my love Andreas for understanding (or at least accepting) the fact that I put myself through writing another thesis. This is the last one I swear!
iv
Abstract
The Vaccine Preventable Diseases Surveillance section of the Australian Government Department of Health uses national data to monitor, analyse and report on a number of communicable diseases. Functions of the section include providing advice to inform policy, developing national pandemic plans, and providing epidemiological information to national and international stakeholders, including the Communicable Diseases Network Australia (CDNA). In this thesis, four epidemiological projects are described that utilize national data and state- and territory- specific data shared with the Commonwealth through professional networks. These projects identify populations at risk for certain communicable disease, identify gaps in national surveillance and make recommendations to improve the utility of surveillance data to better inform policy and public health interventions.
Chapter Two describes an epidemiological analysis of national notifications of infectious and congenital syphilis over the period 2006 to 2015. Trends in rates over time are compared between Aboriginal and Torres Strait Islander people and non-Indigenous people and the analysis determines the impact that an ongoing multijurisdictional outbreak of infectious syphilis affecting Aboriginal and Torres Strait Islander people in the northern parts of Australia has on state-specific and national rates. Information gaps in national surveillance data are identified, particularly for cases of congenital syphilis and a proposal for the inclusion of additional fields to better understand risk factors for congenital syphilis infections is developed.
Chapter Three describes the evaluation of the Australian Sentinel Practice Research Network (ASPREN); a national network of primary care practitioners that report on influenza-like illness. System data and the opinions of key stakeholders are used to evaluate whether ASPREN is achieving the objectives set for the system by the funding body, the Australian Government Department of Health. Recommendations are made to improve the representativeness, simplicity, sensitivity, and usefulness of ASPREN syndromic and virological data. Representativeness of syndromic surveillance sites is identified as necessary for the collection of meaningful data but is often challenging to achieve.
v Chapter Five describes an investigation into an outbreak of acute gastroenteritis at a catered lunch event in the Australian Capital Territory. Although this cohort study does not identify the cause of the outbreak, key learnings from the experience are reflected upon. Chapter Six describes my experience conducting event-based surveillance at the World Health Organization’s Western Pacific Regional Office in Manila.
vi
Table of Contents
Declaration by author ... ii
Acknowledgements ... iii
Abstract ... iv
List of Abbreviations ... vii
Chapter 1 General introduction ... 1
Chapter 2 Data analysis project: Syphilis trends in Aboriginal and Torres Strait Islander and non-Indigenous persons in Australia: an analysis of routine surveillance data ... 6
Chapter 3 Evaluation of the Australian Sentinel Practice Research Network (ASPREN) ... 34
Chapter 4 Epidemiological project: Use of hospital services by individuals notified with community-associated methicillin-resistant Staphylococcus aureus (CA-MRSA), Kimberley, Western Australia ... 105
Chapter 5 Outbreak chapter part one: Cohort study of acute gastroenteritis at a catered event ... 142
Chapter 6 Outbreak chapter Part Two: Event-based surveillance at the World Health Organization’s Western Pacific Regional Office ... 151
vii
List of Abbreviations
ANU Australian National University
ASPREN Australian Sentinel Practice Research Network ACT Australian Capital Territory
CA-MRSA Community-associated methicillin-resistant Staphylococcus aureus CDC Centers for Disease Control and Prevention
CNDA Communicable Diseases Network of Australia DoH Australian Government Department of Health
ED emergency department
GP general practitioner
HA-MRSA healthcare-associated methicillin-resistant Staphylococcus aureus
ICD-10-AM The International Statistical Classification of Diseases and Related Health Problems, 10th Revision, Australian Modification
IHR 2005 International Health Regulations (2005)
ILI influenza-like illness
MAE Master of Philosophy (Applied Epidemiology) program MRSA methicillin-resistant Staphylococcus aureus
MSM men who have sex with men
NBBVSTI SSC National Blood-borne Viruses and Sexually Transmissible Infections Surveillance Sub-committee
NCEPH National Centre for Epidemiology and Population Health NISC National Influenza Surveillance Committee
NNDSS National Notifiable Diseases Surveillance System
NSW New South Wales
NT Northern Territory
viii
Qld Queensland
SA South Australia
Tas Tasmania
Vic Victoria
VPDS Vaccine Preventable Diseases Surveillance
WA Western Australia
WHO World Health Organization
WHO CC World Health Organization Collaborating Centre for Reference and Research on Influenza
WPRO Western Pacific Regional Office
Page 1 of 209
CHAPTER 1
GENERAL INTRODUCTION
1.1 FIELD PLACEMENT
My field placement commenced on 16 February 2015 in the Vaccine Preventable Disease Surveillance (VPDS) section within the Office of Health Protection (OHP) Division of the Australian Government Department of Health (DoH). The VPDS section is responsible for monitoring, analysing and reporting on vaccine preventable disease and some bacterial, blood-borne and sexually-transmissible infections. The section provides advice to inform policy on vaccines and pandemic planning, relevant information on VPDs to national and international stakeholders, and epidemiological advice to the Communicable Disease Network Australia (CDNA). My field supervisor was the Director of VPDS; initially Ms Rhonda Owen, then Ms Cindy Toms and then Dr Jennie Hood. Supervision and mentorship was provided for each project by section epidemiologists Ms Amy Bright (syphilis), Ms Christina Bareja (influenza), Dr Rachel de Kluyver (influenza) and Ms Kate Pennington (influenza).
In addition to the core MAE requirements, I contributed to the routine work of the VPDS section. This included extracting and analysing data for and writing several fortnightly Communicable Disease Surveillance reports and the syphilis section of the 2014 National Notifiable Diseases Surveillance System (NNDSS) Annual Report. Also, approximately once a month for 12 months I performed the role of Watch Officer (WO) which involved acting as the National Focal Point (NFP) for Australia during office hours; fulfilling Australia’s obligations under the International Health Regulations 2005 (IHR 2005). The WO is responsible for receiving incoming communications from international NFPs and state health departments regarding notifications of diseases of international public health concern and relaying this information to relevant NFPs and contact points for their action. I was trained in contact tracing, particularly how to identify contacts of communicable disease events on aircraft through passenger seat allocation lists (PSALs) and how to obtain contact details of these passengers through incoming passenger cards (IPCs) provided by the Department of Immigration and Border Protection.
Page 2 of 209
1.2 OVERALL EXPERIENCE
Practicing epidemiology at a national level comes with many benefits but also some challenges that may differ to those experienced by students placed in state/territory health departments. In my opinion, the greatest benefit of working at a national level is the access to surveillance data for Australia via the NNDSS. This system provides a rich source of data for more than 50 communicable diseases or disease groups. I now understand that the objectives of conducting surveillance nationally are usually different to those at a state/territory level. Epidemiologists at the DoH are able to access these data in order to obtain a national picture of disease trends. This allows the reporting of information back to state/territory health departments, to policy makers and to international stakeholders such as the WHO. Multijurisdictional outbreaks may be detected through these means – where state/territory-based surveillance systems may not have the complete information available to make connections to similar disease events happening in other jurisdictions. Another benefit to working at the DoH is the strong interaction with CDNA and CDNA sub-committees. I learnt a lot of epidemiological concepts and methods through sitting-in on and participating in teleconferences and meetings with CDNA, the National Influenza Surveillance Sub-Committee (NISC), and the National Blood-borne Virus and Sexually Transmissible Infections Sub-Committee (NBBVSTI SSC). I had the opportunity to present project proposals and project outcomes to CDNA, NISC and NBBVSTI SSC where valuable feedback was given by members.
Page 3 of 209
1.3 SUMMARY OF CORE ACTIVITIES RELATED TO COURSE REQUIREMENTS
Presented below are the core requirements of the MAE program and how I have satisfied these requirements.
Investigate an acute public health problem or threat
Cohort study of acute gastroenteritis at a catered event (Chapter 5)
Event-based surveillance at the World Health Organization’s Western Pacific Regional Office (Chapter 6)
Analyse a public health dataset
Recent trends in syphilis in Aboriginal and Torres Strait Islander people and non-Indigenous persons in Australia; an analysis of routine surveillance data (Chapter 2)
Evaluate a surveillance system
Evaluation of the Australian Sentinel Practice Research Network (ASPREN) (Chapter 3)
Design and conduct an epidemiological study
Utilisation of hospital services by individuals notified with community-associated methicillin-resistant Staphylococcus aureus (CA-MRSA), Kimberley, Western Australia (Chapter 4)
Literature review
All projects (Chapters 2-6) required a critical review of the literature to develop context and scope prior to commencement. The Introduction sections of each Chapter present a summary of relevant literature as background information for the reader and also to argue the value in conducting the research. The Discussion sections of each Chapter use relevant literature to understand project results and to support recommendations or the need for further research.
Report to a non-scientific audience
Syphilis chapters, 2014 NNDSS Annual Report. Published in Communicable Diseases Intelligence, 2016, Volume 40, pages E84-E89. Available at:
Page 4 of 209
Weekly and bi-weekly surveillance reports for the Emerging Disease Surveillance and Response Unit (ESR), WPRO (human infection with avian influenza, dengue, hand, foot and mouth disease and seasonal influenza). These reports are available on the web and links are given to the reports I wrote in Chapter 6.
Preparation of an advanced draft of a paper for publication in a national or international
peer-reviewed journal
Chapter 2 is an advanced draft of manuscript that will be submitted to the Medical Journal of Australia.
Conference presentation
Lunchtime lecture field report, 1 March 2016, NCEPH, Canberra. ‘Analysis of syphilis notifications at a national level 2004-2015: How are we faring?’
2016 Australasian Epidemiological Association 23rd Annual Scientific Meeting ‘MAE Day’ 14 September 2016, Australian National University, Canberra. ‘Does rumour surveillance work?’ (Appendix 6-1, Chapter 6)
CDNA face-to-face meeting, 15 September 2016, DoH, Canberra. Feedback of the results of syphilis data analysis project.
NISC teleconference, 25 October 2016, DoH, Canberra. Feedback of the results of the ASPREN evaluation.
2016 Australasian Sexual Health Conference, 14-16 November 2016, Adelaide. ‘Recent trends in syphilis in Aboriginal and Torres Strait Islander people and non-indigenous persons in Australia.’ (Appendix 2-1, Chapter 2)
8th Southeast Asia and Western Pacific Bi-regional TEPHINET Scientific Conference, 28 November-2 December 2016, Siem Reap, Cambodia. ‘Recent trends in syphilis in Aboriginal and Torres Strait Islander people and non-indigenous persons in Australia.’ (Appendix 2-1, Chapter 2)
Teaching
Lessons from the field (LFF) (Chapter 7)
Page 5 of 209 Coursework
POPH8915 (Outbreak Investigation): Semester 1, 2015
POPH8917 (Public Health Surveillance): Semester 1, 2015
POPH8913 (Analysis of Public Health Data): Semester 2, 2015
POP8916 (Issues in Applied Epidemiology): Semester 1, 2016
Page 6 of 209
CHAPTER 2
DATA ANALYSIS PROJECT: SYPHILIS TRENDS IN
ABORIGINAL AND TORRES STRAIT ISLANDER AND NON-INDIGENOUS
PERSONS IN AUSTRALIA: AN ANALYSIS OF ROUTINE SURVEILLANCE
DATA
Table of Contents
2.1 Role ... 8
2.2 Lessons learnt ... 8
2.3 Public health importance ... 8
2.4 Abstract ... 10
2.5 Introduction ... 11
2.6 Methods ... 12
2.6.1 Surveillance procedures ... 12
2.6.2 Analysis ... 12
2.6.3 Ethics ... 13
2.7 Results ... 13
2.7.1 Characteristics of infectious syphilis notifications ... 13
2.7.2 Characteristics of congenital syphilis notifications ... 14
2.7.3 Trends in the Aboriginal and Torres Strait Islander population ... 15
2.7.4 Trends in the non-Indigenous population ... 20
2.8 Discussion ... 22
2.9 References... 24
Page 7 of 209
Tables
Table 2-1 Infectious syphilis notification trends in Aboriginal and Torres Strait Islander
people, 2006-2010 and 2011-2015, by sex, age, remoteness and jurisdictions ... 16 Table 2-2 Infectious syphilis notification trends in non-Indigenous people, 2006-2010
and 2011-2015, by sex, age, remoteness and jurisdictions ... 21
Figures
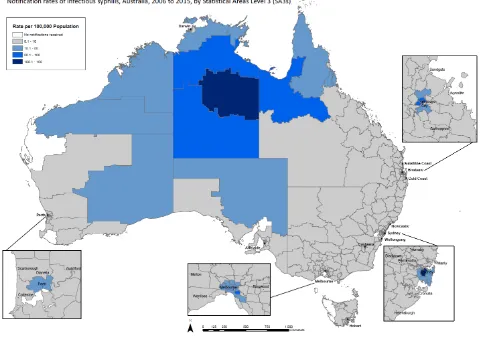
Figure 2-1 Rates of infectious syphilis per 100,000 population, estimated resident
population of Australia, by Statistical Areas Level 3 (SA3), 2006-2015 ... 14 Figure 2-2 Notifications and rates per 100,000 live births of congenital syphilis by
Indigenous status and year, Australia, 2006-2015 ... 15 Figure 2-3 Age-standardised notification rate of infectious syphilis by Indigenous status,
Australia, 2006-2015 ... 17 Figure 2-4 Infectious syphilis crude notification rate, by Indigenous status and sex,
Australia, 2006-2015 ... 18 Figure 2-5 Infectious syphilis age-specific notification rate, by Indigenous status and age
group, Australia, 2006-2015 ... 19 Figure 2-6 Infectious syphilis notifications for Aboriginal and Torres Strait Islander
people, 2006-2010 [blue bar] & 2011-2015 [red bar]. For 2011-2015, light red shading for Queensland, the Northern Territory, Western Australia and
National indicates notifications attributed to the MJSO.10 ... 20
Appendices
Appendix 2-1 Conference presentation at Australasian Sexual Health Conference (14 November 2016, Adelaide) and the 8th TEPHINET Bi-Regional Scientific
Page 8 of 209
2.1 ROLE
An epidemiological review of syphilis notifications in Australia was identified as a work item by the National Blood-borne Virus and Sexually Transmissible Infections Surveillance Sub-Committee (NBBVSTI SSC) and was raised as a project for an MAE student to undertake. Early on in the MAE, Ms Amy Bright (epidemiologist, DoH) invited me to a NBBVSTI SSC teleconference and I accepted the task as my MAE data analysis project. I performed data extraction from NNDSS, data cleaning, analysis and am first author of the manuscript. I have worked closely throughout this project with the NBBVSTI SSC and a number of members are co-authors on the manuscript. This thesis chapter is a late draft of a manuscript that will be submitted to the Medical Journal of Australia. It has been co-authored with the following people: A/Prof Rebecca Guy (Kirby Institute), Ms Carolien Giele (WA DoH), Dr Jiunn-Yih Su (NT DoH and Menzies School of Health Research), Dr Carolyn Lang (Qld DoH), A/Prof James Ward (SAHMRI), Prof Margaret Hellard (Burnet Institute), Dr Marlene Kong (Kirby Institute), Dr Skye McGregor (Kirby Institute), Dr Johanna Dups (WA DoH and ANU), Mr James Newhouse (DoH), Dr Kathryn Glass (ANU), and Ms Amy Bright (DoH). I produced all tables and figures apart from the map which was prepared by Mr James Newhouse with data that I provided
2.2 LESSONS LEARNT
This project has been very valuable as it allowed me to take part in NBBVSTI SSC meetings as well as meetings for the Multijurisdictional Syphilis Outbreak Working Group. I have learnt through these meetings the sensitivities around reporting on sexually transmissible diseases and many of the social and cultural barriers that may challenge effective surveillance and treatment for infections such as syphilis. I have learnt the importance of defining why surveillance is conducted for an infection or a disease – why are we concerned? For syphilis I have learnt that the main public health concerns surrounding infection are the risk of congenital syphilis and the increased risk of HIV transmission that may occur concurrently with infectious syphilis. Being placed at a national level I have learned about the National BBVSTI Strategies that are in place to target public health action towards reducing the incidence of syphilis and to eliminate congenital syphilis. At a data level this project has enabled me to explore different methods of measuring disease trends over time; each with their own benefits and limitations. This issue became the topic of my LFF (Chapter 7). I am very grateful to have had the support of the NBBVSTI SCC and the opportunity to prepare this manuscript with many experts in the field of sexually transmissible infections and sexual health.
2.3 PUBLIC HEALTH IMPORTANCE
Page 9 of 209
2005 to 2009, notification rates for infectious syphilis substantially declined for Aboriginal and Torres Strait Islander people and significantly increased for non-Indigenous people. In 2011 an outbreak of infectious syphilis affecting Aboriginal and Torres Strait Islander people in regional and remote areas of northern Australia was officially declared. This report describes trends in infectious and congenital syphilis over a 10 year time period (2006-2015) to investigate whether similar trends were continuing for Aboriginal and Torres Strait Islander and non-Indigenous people and how the outbreak affected these trends. This project shows that post-2011, notification rates for Aboriginal and Torres Strait Islander people significantly increased with time, while for non-Indigenous people rates significantly increased across the entire study period, from 2006 to 2015. From 2006 to 2015, congenital syphilis rates were on average 30 times higher for Aboriginal and Torres Strait Islander people compared to non-Indigenous people. This epidemiological picture is at odds with the targets of the National BBVSTI Strategies which are to reduce the incidence of infectious syphilis and eliminate congenital syphilis.
As a result of this project, gaps in the collection of national surveillance data for infectious and congenital syphilis were identified. For NNDSS data, currently there is no way to link cases of congenital syphilis to the notification of his/her mother. Thus, core data collected through NNDSS for congenital syphilis notifications are limited in allowing us to understand the circumstances that may have contributed to such outcomes, particularly in relation to the provision of antenatal care in the mother. I worked on a proposal with Ms Amy Bright to modify the core NNDSS CASE_FOUND_BY field to include a category for antenatal screening. I pitched this proposal to the National Surveillance Committee (NSC). This proposal was accepted and the change was incorporated into NNDSS on October 2015.
Page 10 of 209
definition, stillbirths are not specifically identified in NNDSS. This will allow an understanding of the clinical and social burden of the disease. The third enhanced field collects further information to understand risk factors for congenital syphilis outcomes (e.g. provision of antenatal care, re-infection during pregnancy). Comprehensive national surveillance data for congenital syphilis notifications would enable robust reporting against our progress towards elimination and the dissemination of this information to those responsible for public health policy and action. An initial proposal has been circulated to NBBVSTI SSC for comment. Suggestions will be incorporated, fed back to the sub-committee for final review and then submitted to NSC for their consideration.
I disseminated the results of this project to CDNA at a face to face meeting (15 September 2016) and I will give an oral presentation of this work at the Australasian Sexual Health Conference in Adelaide (14 November 2016, Appendix 2-1) and at the 8th TEPHINET Bi-Regional Scientific Conference in Cambodia (28 November-2 December 2016, Appendix 2-1). This manuscript will be submitted to the MJA for publication.
2.4 ABSTRACT
Objective: To describe time trends in syphilis notifications among Aboriginal and Torres Strait
Islander people and non-Indigenous persons in Australia.
Design: A retrospective descriptive analysis of infectious and congenital syphilis notifications by
Indigenous status.
Setting: Analysis of data from the National Notifiable Diseases Surveillance System divided into two
time periods: 2006-2010 and 2011-2015.
Main outcome measures: Age-standardised and crude notification rates. Poisson regression
determined trends in annual notification rates comparing 2006-2010 and 2011-2015; stratified by sex, age-group, remoteness and jurisdiction.
Results: Among Aboriginal and Torres Strait Islander people, from 2011-2015, infectious syphilis
Page 11 of 209
Conclusion: Infectious syphilis notifications have increased significantly in Australia over the last
five years. Effective surveillance, community engagement and clinical management are required to control recent increases in syphilis transmission among Aboriginal and Torres Strait Islander persons residing in regional and remote areas and non-Indigenous males residing in metropolitan and regional centres.
2.5 INTRODUCTION
Syphilis is a sexually transmitted infection (STI) caused by the bacterium Treponema pallidum subspecies pallidum which is readily treated.1 Infection progresses from the initial symptomatic
primary and secondary stages through to asymptomatic stages of early latent and late latent syphilis.1
A proportion of untreated persons will develop serious complications associated with tertiary syphilis.1 People with primary, secondary and early latent syphilis are infectious, while those with late latent and tertiary syphilis are not.2 The risk of vertical transmission from mother to child is high during the infectious stages, but is also possible during the late latent stage.1 Infection of the foetus can result in spontaneous abortion, stillbirth, premature delivery, perinatal death, or infection and disease in the newborn.3
Syphilis is of particular public health concern among pregnant women and men who have sex with men (MSM) due to the increased risk of congenital syphilis1, and human immunodeficiency virus (HIV) transmission and acquisition4, respectively. Despite the existence of effective preventive measures, treatment and diagnostic assays, syphilis continues to cause significant morbidity and mortality world-wide.5 In Australia, syphilis transmission occurs mainly in two distinct populations: Aboriginal and Torres Strait Islander people resident in remote areas and non-Indigenous men who have sex with men (MSM) in urban areas.6
From 2004, when enhanced surveillance information on infectious syphilis was first routinely collected, there has been a steady increase in the number of cases reported among MSM consistent with other developed countries.7,8 In response, the National Gay Men’s Syphilis Action Plan was
developed in 2008.9 At around the same time, notification rates of infectious syphilis significantly
declined for Aboriginal and Torres Strait Islander persons resident in remote areas, with calls for increased control efforts to achieve elimination.6 However, recently there has been a resurgence of
Page 12 of 209
In this report we analyse infectious and congenital syphilis national notification data by Indigenous status over the ten year period from 2006-2015 to inform public health responses with a particular focus on trends in the five year periods pre- and post- the multijurisdictional outbreak: 2006 to 2010 and 2011 to 2015.
2.6 METHODS
2.6.1 Surveillance procedures
Infectious and congenital syphilis are nationally notifiable diseases in Australia and de-identified data on diagnoses which meet standard case definitions11,12 are provided by all jurisdictions to the National
Notifiable Diseases Surveillance System (NNDSS) managed within the Australian Government Department of Health. Core notification data include information on Indigenous status, sex, age and postcode of residence at time of diagnosis. Data for confirmed cases of infectious syphilis, and confirmed and probable cases of congenital syphilis were extracted from the NNDSS using date of diagnosis for the 2006-2015 period. The date of diagnosis is the onset date or where the onset date was not known, the earliest of the following dates: specimen collection date, the notification date, or the notification received date. Due to an amendment of the case definition, probable cases of infectious syphilis have only been reported from mid-2015 and are not included in our analyses.
The Indigenous status field records if a person is of Aboriginal and/or Torres Strait Islander origin, or not (“non-Indigenous”). Notifications with unknown or missing Indigenous status were excluded from the analyses. Completeness of the Indigenous status field for infectious syphilis exceeded 50% for each reporting jurisdiction and exceeded 90% nationally for all years of the study. Notifications of infectious syphilis were excluded from analyses if the individual was aged less than 13 years (10 notifications).
2.6.2 Analysis
Notifications were divided into two five-year periods: 2006-2010 and 2011-2015. We first conducted a descriptive analysis of infectious and congenital syphilis notifications over the study period by Indigenous status, sex, age, jurisdiction, and remoteness determined by postcode and based on the Australian Statistical Geography Standard Remoteness Areas.13
Page 13 of 209
were sourced from Bright and Dups 2015.10 Congenital syphilis notification rates per 100,000 births were calculated using denominator data from the Australian Bureau of Statistics (ABS) Birth Registrations collection.15 As 2015 birth data were not available, 2014 data were used for 2015. We also calculated infectious syphilis notifications among women of childbearing age (15-49 years) due to the potential for congenital syphilis.16 We calculated notification rates by remoteness and Indigenous
status using 2011 remoteness distributions provided by the ABS.17 A map was created by grouping the postcode of each notification by statistical area level 3 (SA3) regions. Notification rates were calculated using the 2011 SA3 distributions for the Australian resident population.18
Univariate Poisson regression was used to calculate trends in infectious syphilis notification rates per 100,000 population by Indigenous status, sex, age group, remoteness, jurisdiction, and for women of childbearing age. Trends in congenital syphilis notification rates per 100,000 births were analysed by Indigenous status. The incident rate ratio interpreted as an annual trend is reported along with p-values and 95% confidence intervals (95% CI). Descriptive analyses were performed using Microsoft Excel 2010 and statistical analyses were performed using Stata version 13. P-values < 0.05 were considered statistically significant.
2.6.3 Ethics
Ethics approval was obtained from the Australian National University Human Research Ethics Committee.
2.7 RESULTS
2.7.1 Characteristics of infectious syphilis notifications
Page 14 of 209 Figure 2-1 Rates of infectious syphilis per 100,000 population, estimated resident population of Australia, by Statistical Areas Level 3 (SA3), 2006-2015
2.7.2 Characteristics of congenital syphilis notifications
Page 15 of 209 Figure 2-2 Notifications and rates per 100,000 live births of congenital syphilis by Indigenous status and year, Australia, 2006-2015
2.7.3 Trends in the Aboriginal and Torres Strait Islander population
Page 16 of 209 Table 2-1 Infectious syphilis notification trends in Aboriginal and Torres Strait Islander people, 2006-2010 and 2011-2015, by sex, age, remoteness and jurisdictions
2006 2010
Annual trend (IRR), 2006-2010
P 95% CI 2011 2015
Annual trend (IRR), 2011-2015
P 95% CI
Notificationsa 238 140 0.85ǂ <0.001 0.81-0.89 197 322 1.17ǂ <0.001 1.12-1.22
Age-standardised
rate 41.1 24.4 0.86ǂ <0.001 0.85-0.87 30.3 47.6 1.14ǂ <0.001 1.13-1.15 Sex
Males 40.9 28.7 0.89ǂ 0.001 0.84-0.95 33.6 57.4 1.17ǂ <0.001 1.10-1.24
Females 51.4 21.0 0.77ǂ <0.001 0.72-0.83 34.9 45.0
1.09ǂ 0.004 1.03-1.17
M:F rate ratio 1 1 - - - 1 1 - - -
Age group (yrs)
15-19 131.1 39.0 0.71ǂ <0.001 0.64-0.78 108.5 120.7 1.07 0.10 0.99-1.16
20-29 105.4 58.1 0.82ǂ <0.001 0.76-0.89 62.6 116.4 1.19ǂ <0.001 1.11-1.28
30-39 56.3 45.9 0.95 0.36 0.86-1.06 41.6 86.3 1.20ǂ <0.001 1.09-1.33
40 + 25.3 20.1 0.94 0.29 0.83-1.06 20.1 23.9 1.06 0.29 0.95-1.19 Women of
child-bearing ageb 90.7 36.5 0.76ǂ <0.001 0.70-0.82 60.4 81.8 1.12ǂ 0.002 1.04-1.18
Remoteness
Major cities 8.2 3.9 0.84ǂ 0.03 0.72-0.98 11.2 14.6 1.06 0.34 0.94-1.19
Inner regional 4.7 2.0 0.82 0.11 0.64-1.05 6.1 5.4 1.00 1.000 0.82-1.22 Outer regional 16.4 28.7 1.18ǂ 0.01 1.04-1.33 24.0 59.5 1.27ǂ <0.001 1.17-1.39
Remote 117.0 62.4 0.84ǂ 0.002 0.76-0.94 91.7 117.0 1.06 0.24 0.96-1.16
Very remote 139.7 58.9 0.78ǂ <0.001 0.73-0.83 87.3 145.1 1.19ǂ <0.001 1.11-1.38
Jurisdictionc
NSW 5.2 6.1 1.09 0.44 0.88-1.34 3.6 7.6 1.22ǂ 0.03 1.02-1.45
NT 226.5 58.3 0.68ǂ <0.001 0.63-0.73 40.1 183.4 1.82ǂ <0.001 1.63-2.03
Qld 29.0 42.3 1.09 0.10 0.98-1.20 73.4 57.3 0.96 0.14 0.90-1.01 SA 49.9 6.6 0.57ǂ <0.001 0.43-0.75 22.6 29.6 0.94 0.60 0.75-1.18
Vic 23.9 2.7 0.58ǂ 0.004 0.40-0.84 13.3 26.5 1.22 0.11 0.96-1.56
WA 29.6 24.9 0.98 0.77 0.89-1.09 37.3 52.6 1.13 0.08 0.99-1.29
Data are presented as crude rates per 100,000 population unless otherwise indicated 95% CI, 95% Confidence Interval
IRR, Incident Rate Ratio
NSW, New South Wales; NT, Northern Territory; Qld, Queensland; SA, South Australia; Vic, Victoria; WA, Western Australia ǂp<0.05
aExcludes 3 notifications of unknown sex and 10 notifications aged less than 13 years bWomen aged 15-49 years
[image:24.595.57.543.108.568.2]Page 17 of 209 Figure 2-3 Age-standardised notification rate of infectious syphilis by Indigenous status, Australia, 2006-2015
Page 18 of 209 Figure 2-4 Infectious syphilis crude notification rate, by Indigenous status and sex, Australia, 2006-2015
Page 19 of 209 Figure 2-5 Infectious syphilis age-specific notification rate, by Indigenous status and age group, Australia, 2006-2015
[image:27.595.59.540.122.379.2]Page 20 of 209 Figure 2-6 Infectious syphilis notifications for Aboriginal and Torres Strait Islander people, 2006-2010 [blue bar] & 2011-2015 [red bar]. For 2011-2015, light red shading for Queensland, the Northern Territory, Western Australia and National indicates notifications attributed to the MJSO.10
ACT, Australian Capital Territory, NSW, New South Wales; Vic, Victoria; SA, South Australia; Qld, Queensland; NT, Northern Territory; Tas, Tasmania; WA, Western Australia
On average, annual rates of congenital syphilis were 30 times higher than for the non-Indigenous population. For example, in 2015, rates of congenital syphilis for Aboriginal and Torres Strait Islander people and non-Indigenous persons were 11.2 and 0.4 per 100,000 live births, respectively.
2.7.4 Trends in the non-Indigenous population
Page 21 of 209
(Table 2-2). There was no significant trend in the rate of infectious syphilis in women of childbearing age across either time period (Table 2-2).
Table 2-2 Infectious syphilis notification trends in non-Indigenous people, 2006-2010 and 2011-2015, by sex, age, remoteness and jurisdictions
2006 2010
Annual trend (IRR),
2006-2010
P 95% CI 2011 2015
Annual trend (IRR),
2011-2015
P 95% CI
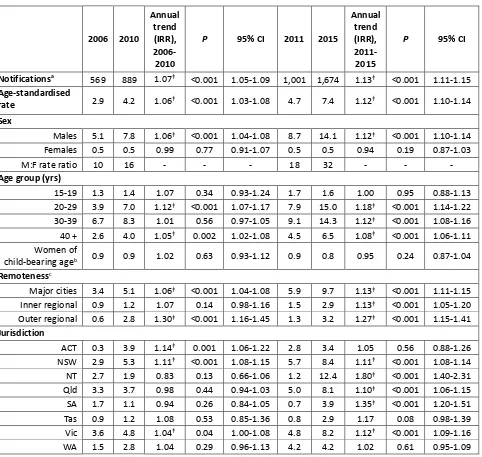
Notificationsa 569 889 1.07ǂ <0.001 1.05-1.09 1,001 1,674 1.13ǂ <0.001 1.11-1.15
Age-standardised
rate 2.9 4.2 1.06ǂ <0.001 1.03-1.08 4.7 7.4 1.12ǂ <0.001 1.10-1.14 Sex
Males 5.1 7.8 1.06ǂ <0.001 1.04-1.08 8.7 14.1 1.12ǂ <0.001 1.10-1.14
Females 0.5 0.5 0.99 0.77 0.91-1.07 0.5 0.5 0.94 0.19 0.87-1.03
M:F rate ratio 10 16 - - - 18 32 - - -
Age group (yrs)
15-19 1.3 1.4 1.07 0.34 0.93-1.24 1.7 1.6 1.00 0.95 0.88-1.13 20-29 3.9 7.0 1.12ǂ <0.001 1.07-1.17 7.9 15.0 1.18ǂ <0.001 1.14-1.22
30-39 6.7 8.3 1.01 0.56 0.97-1.05 9.1 14.3 1.12ǂ <0.001 1.08-1.16
40 + 2.6 4.0 1.05ǂ 0.002 1.02-1.08 4.5 6.5 1.08ǂ <0.001 1.06-1.11
Women of
child-bearing ageb 0.9 0.9 1.02 0.63 0.93-1.12 0.9 0.8 0.95 0.24 0.87-1.04
Remotenessc
Major cities 3.4 5.1 1.06ǂ <0.001 1.04-1.08 5.9 9.7 1.13ǂ <0.001 1.11-1.15
Inner regional 0.9 1.2 1.07 0.14 0.98-1.16 1.5 2.9 1.13ǂ <0.001 1.05-1.20
Outer regional 0.6 2.8 1.30ǂ <0.001 1.16-1.45 1.3 3.2 1.27ǂ <0.001 1.15-1.41
Jurisdiction
ACT 0.3 3.9 1.14ǂ 0.001 1.06-1.22 2.8 3.4 1.05 0.56 0.88-1.26
NSW 2.9 5.3 1.11ǂ <0.001 1.08-1.15 5.7 8.4 1.11ǂ <0.001 1.08-1.14
NT 2.7 1.9 0.83 0.13 0.66-1.06 1.2 12.4 1.80ǂ <0.001 1.40-2.31
Qld 3.3 3.7 0.98 0.44 0.94-1.03 5.0 8.1 1.10ǂ <0.001 1.06-1.15
SA 1.7 1.1 0.94 0.26 0.84-1.05 0.7 3.9 1.35ǂ <0.001 1.20-1.51
Tas 0.9 1.2 1.08 0.53 0.85-1.36 0.8 2.9 1.17 0.08 0.98-1.39 Vic 3.6 4.8 1.04ǂ 0.04 1.00-1.08 4.8 8.2 1.12ǂ <0.001 1.09-1.16
WA 1.5 2.8 1.04 0.29 0.96-1.13 4.2 4.2 1.02 0.61 0.95-1.09
Data are presented as crude rates per 100,000 population unless otherwise indicated 95% CI, 95% Confidence Interval
IRR, Incident Rate Ratio
ACT, Australian Capital Territory; NSW, New South Wales; NT, Northern Territory; Qld, Queensland; SA, South Australia; Tas, Tasmania; Vic, Victoria; WA, Western Australia
ǂp<0.05
aExcludes 10 notifications of unknown sex and 1 notification of nonsensical age bWomen aged 15-49 years
cRates not presented for Remote and Very Remote areas due to low annual numbers of notifications
Page 22 of 209
increased in inner regional areas. By jurisdiction, between 2006 and 2010, there was no significant trend in rates except for the Australian Capital Territory, New South Wales and Victoria where rates significantly increased. From 2011 to 2015, rates significantly increased in New South Wales, the Northern Territory, Queensland, South Australia, and Victoria. The largest annual rate increase from 2011 to 2015 occurred in the Northern Territory (increase of 80%, 95% CI 40%, 131%) (Table 2-2).
2.8 DISCUSSION
Over the last decade, Australia has experienced sustained increases in infectious syphilis notifications, as in a number of developed countries.7,8 The epidemics in MSM in the major cities of Australia are
well characterised19,20 and are reflected in the increasing male-to-female rate ratios observed in our
analyses for non-Indigenous persons, particularly over the last five years. For non-Indigenous persons, the second half of the study period saw significantly increased rates of infectious syphilis across a wide range of ages and geographical areas. Substantial disparities in syphilis rates between Aboriginal and Torres Strait Islander people and non-Indigenous persons are evident from our analyses. The Aboriginal and Torres Strait Islander population of Australia comprise 3% of the total Australian population but 14% of all infectious syphilis notifications in the study period.
There are a few limitations to consider when interpreting these data. The use of national notifications restrict the study population to people who have been tested and diagnosed with infectious syphilis and may under-estimate the true burden of infection in the population. Also any changes in testing policies and programs, diagnostic assays, awareness campaigns and other factors that may influence health-seeking behaviour may affect trends in notifications. Our analysis excluded notifications where the Indigenous status was unknown or missing to avoid making assumptions of the true status. The profile of these excluded notifications indicated that these people were mostly non-Indigenous (majority male, resided in major cities, median age of 38 years), thus underestimating notification rates of infectious syphilis in non-Indigenous people in this study. Lastly, until mid-2015, the national case definition for infectious syphilis led to many potential cases, particularly 15-19 year olds, being excluded due to lack of past testing information to confirm incident infection in the last two years. Effective since mid-2015, the addition of a probable case definition allows for the reporting of persons with no known previous reactive serology but who meet other specified criteria. Probable cases were not included in this study.
Page 23 of 209
study period (2011 to 2015) coincided with an ongoing outbreak of syphilis affecting Aboriginal and Torres Strait Islander people living in remote and regional areas of northern Australia.10 Comparing 2011 to 2015, crude rates of infectious syphilis in Aboriginal and Torres Strait Islander people increased for both sexes, for all age groups, and in the majority of regions and jurisdictions. We showed that for Aboriginal and Torres Strait Islander people over the 2011 to 2015 period, cases associated with the outbreak accounted for over half the total number of cases for Queensland, the Northern Territory and nationally. It is likely that a combination of increased syphilis transmission and active case finding during the outbreak contributed to this increase. However not all changes can be attributed to the outbreak, as rates also increased in jurisdictions unaffected by the outbreak including New South Wales and Victoria. From 2011 to 2015, in New South Wales the male to female rate ratio of infectious syphilis among Aboriginal and Torres Strait Islander people increased from 1:1 to 13:1 and in Victoria the rate ratio remained stable at 4:1, implying predominantly male to male transmission in these jurisdictions.
Over the last five years there has been no significant decrease in the rate of congenital syphilis for Aboriginal and Torres Strait Islander people and non-Indigenous persons. In 2015, the rate of congenital syphilis in Aboriginal and Torres Strait Islander people was 32 times higher than the rate in non-Indigenous populations. Additionally, a significant increase in the rate of infectious syphilis in Aboriginal and Torres Strait Islander women of childbearing age over the last five years indicates an increased risk of congenital syphilis in the future. For Aboriginal and Torres Strait Islander people, the majority of congenital syphilis cases over the last 10 years were reported from remote areas where healthcare is relatively inaccessible.21 To prevent future cases, we need to identify the gaps and inconsistencies in access to antenatal care, and antenatal detection and treatment to strengthen health systems. National clinical guidelines recommend syphilis testing at the first antenatal visit,22 yet there are no national data available on the uptake of syphilis screening in pregnancy.
Page 24 of 209
support for these services and also public health programs. In regards to the steady increase in syphilis observed in non-Indigenous males, mostly due to male-to male sex, new innovative programs may be required to control the infection, such as chemoprophyalaxis.23 Although there has been increased testing in MSM in the past five years, including opt-out and opt-in initiatives at clinical services,24 this has been insufficient to combat the rising rates of syphilis in this population.
The elimination of syphilis transmission and congenital syphilis cases are identified priorities on a global and national scale.25-26 It was once said that “drugs alone do not stop venereal disease.”27 This
is particularly true for syphilis; a disease that requires a comprehensive approach beyond therapeutic management for its control. Such an approach should involve health promotion and strengthening health services in areas of most need. Despite the increasing trends observed in this study for Aboriginal and Torres Strait Islander persons and non-Indigenous people, particularly over the last five years, it is important that the elimination of syphilis remains a national priority. The coordinating work of the MJSO Group is targeted towards ending the current outbreak.10 This presents a timely opportunity to capitalise on the momentum generated by the current syphilis outbreak response and focus resources and efforts towards elimination.
2.9 REFERENCES
1. Heymann DL. Control of Communicable Diseases Manual. 19th edn. Washington: American Public Health Association, USA; 2008.
2. Singh AE, Romanowski B. Syphilis: Review with emphasis on clinical, epidemiologic, and some biologic features. Clin Microbiol Rev 1999;12(2):187-209.
3. Newman L, Kamb M, Hawkes S, Gomez G, Say L, et al. Global estimates of syphilis in pregnancy and associated adverse outcomes: analysis of multinational antenatal surveillance data. PLoS Med 2013; 10(2): e1001396. doi: 10.1371/journal.pmed.1001396
4. Centers for Disease Control and Prevention. HIV prevention through early detection and treatment of other sexually transmitted diseases – United States. Recommendations of the Advisory Committee for HIV and STD prevention. MMWR Recomm Rep 1998; 47: 1-24.
http://www.cdc.gov/mmwr/preview/mmwrhtml/00054174.htm (accessed Mar 2016).
5. The World Health Organization. Sexually transmitted infections (STIs). [Online factsheet]: WHO Media Centre. 2013. Available at: http://www.who.int/mediacentre/factsheets/fs110/en/
(accessed Apr 2016).
Page 25 of 209
7. Simms I, Wallace L, Thomas DR, et al. Recent outbreaks of infectious syphilis, United Kingdom, January 2012 to April 2014. Euro Surveill 2014; 19: doi
http://dx.doi.org/10.2807/1560-7917.ES2014.19.24.20833 (accessed Mar 2016).
8. Centers for Disease Control and Prevention. 2014 Sexually Transmitted Diseases Surveillance: Syphilis. Atlanta, GA: US Department of Health and Human Services, November 2015.
hhttp://www.cdc.gov/std/stats14/syphilis.htm (accessed Mar 2016).
9. Wilson DP, Prestage G, Donovan B, Gray RT, Hoare A, McCann PD, et al. Phase A of the National Gay Men’s Syphilis Action Plan: modelling evidence and research on acceptability of interventions for controlling syphilis in Australia. Sydney: National Centre in HIV Epidemiology and Clinical Research 2009. Available at:
http://www.publish.csiro.au/index.cfm?paper=SH10145 (accessed Apr 2016).
10.Bright A, Dups J. Infectious and congenital syphilis notifications associated with an ongoing outbreak in Northern Australia. Commun Dis Intell 2015; 40: E7-10.
11.Communicable Diseases Network Australia. Infectious syphilis case definition. 2015. Available from: http://www.health.gov.au/internet/main/publishing.nsf/Content/cda-surveil-nndsscasedefs-cd_syphl2.htm (accessed Apr 2016)
12.Communicable Diseases Network Australia. Congenital syphilis case definition. 2015. Available at: http://www.health.gov.au/internet/main/publishing.nsf/Content/cda-surveil-nndsscasedefs-cd_consyph.htm (accessed Apr 2016)
13.Australian Bureau of Statistics. Australian Statistical Geography Standard (ASGS): Volume 5 – Remoteness Structure. Canberra: ABS, July 2011. (ABS Cat. No. 1270.0.55.005.)
14.Australian Bureau of Statistics, Standard Population for Use in Age-Standardisation – 30 June 2001: ABS, March 2003. (ABS Cat. No. 3101.0)
15.Australian Bureau of Statistics. Births, Australia, 2014. Canberra: ABS, 2015. (ABS Cat. No. 3301.0.)
16.Meyer Sauteur PM, Trük J, Bosshard PP, et al. Congenital syphilis in Switzerland: gone, forgotten, on the return. Swiss Med Wkly 2012; 141: doi: 10.4414/smw.2011.13325.
17.Australian Bureau of Statistics. Estimates of Aboriginal and Torres Strait Islander Australians, June 2011. Canberra: ABS, 2013. (ABS Cat. No. 3238.0.55.001.)
18.Australian Bureau of Statistics. ABS.Stat beta. ERP by SA2 and above (ASGS 2011), 1991 to 2015. Available at: http://stat.abs.gov.au/ (accessed Nov 2016)
Page 26 of 209
20.Guy RJ, Leslie DE, Simpson K, et al. Sustained increase in infectious syphilis notifications in Victoria. Med J Aust 2005; 183: 218.
21.Australian Government Australian Institute of Family Studies. Families in regional, rural and remote Australia. Facts Sheet 2011. Commonwealth of Australia.
https://aifs.gov.au/sites/default/files/publication-documents/fs201103.pdf (accessed Mar 2016). 22.Australian Health Ministers’ Advisory Council 2012, Clinical Practice Guidelines: Antenatal
Care – Module 1. Australian Government Department of Health and Ageing, Canberra.
http://www.health.gov.au/antenatal (accessed Aug 2016)
23.Wilson DP, Prestage GP, Gray RT, Hoare A, McCann P, Down I, et al. Chemoprophylaxis is likely to be acceptable and could mitigate syphilis epidemics among populations of gay men. Sex Transm Dis 2011;38(7):573–9. doi: 10.1097/OLQ.0b013e31820e64fd
24.Guy R, El-Hayek C, Fairley CK, Wand H, Carr A, McNulty A, et al. Opt-out and opt-in testing increases syphilis screening of HIV-positive men who have sex with men in Australia. PLoS One 2013;8:e71436. doi: 10.1371/journal.pone.0071436
25.Australian Government Department of Health. Fourth National Aboriginal and Torres Strait Islander Blood Borne Viruses and Sexually Transmissible Infections Strategy 2014-2017. Canberra: Commonwealth of Australia, 2014.
http://www.health.gov.au/internet/main/publishing.nsf/Content/4CBA8EFCE045DFA9CA257BF
00020A9D0/$File/ATSI-BBV-STI-Strategy2014-v3.pdf (accessed Mar 2016).
26.World Health Organization, Department of Reproductive Health and Research. The global elimination of congenital syphilis: rationale and strategy for action, 2007.
http://www.who.int/reproductivehealth/publications/rtis/9789241595858/en/ (accessed Mar 2016).
Page 27 of 209
2.10 APPENDICES
Appendix 2-1 Conference presentation at Australasian Sexual Health Conference (14 November 2016, Adelaide) and the 8th TEPHINET Bi-Regional Scientific Conference (28 November to 2
Page 34 of 209
CHAPTER 3
EVALUATION OF THE AUSTRALIAN SENTINEL
PRACTICE RESEARCH NETWORK (ASPREN)
Table of Contents
Page 35 of 209
Tables
Table 3-1. Comparison of key attributes of sentinel GP syndromic influenza surveillance
systems in Australia (ASPREN, SPNWA, and VicSPIN)... 43 Table 3-2. Membership options for ASPREN GP reporters ... 45 Table 3-3. List of attributes evaluated in stakeholder consultations, by stakeholder
group and consultation method ... 51 Table 3-4. Methods of quantifying system attributes by indicator used and data source ... 53 Table 3-5. Number of ASPREN GP reporters per year, 2011-2015 ... 60 Table 3-6. Swab testing data per year for ASPREN GPs (minus SPNWA), 2011-2015. ... 61 Table 3-7. Estimating predictive value positive for ASPREN data. Data are included for all
jurisdictions except for Western Australia. ... 64 Table 3-8. Predictive value positive within and outside of flu season ... 64 Table 3-9. Annual target versus actual numbers of GP reporters nationally and per
jurisdiction by remoteness classification, 2012-2015 ... 67 Table 3-10. Number (%) weeks of the year, overall and within and outside the flu
season, where representation was met or exceeded, 2015. ... 68
Figures
Figure 3-1. Influenza surveillance systems designed to capture disease at different levels
of clinical severity. Adapted from information from Franklin et al.12 ... 41 Figure 3-2. Syndromic data flow through ASPREN system ... 47 Figure 3-3. Virological data flow through ASPREN system ... 48 Figure 3-4. Proportion of active general practitioner reporters by week of year, 2015 ... 61 Figure 3-5. ASPREN GP representation by jurisdiction, 2013-1423 ... 66 Figure 3-6. Proportion by sex of ILI notifications and patients selected for sampling,
2015 ... 69 Figure 3-7. Proportion by jurisdiction of ILI notifications and patients selected for
sampling, 2015 ... 69 Figure 3-8. Proportion by age-group of total Australian population, ILI notifications and
Page 36 of 209
Appendices
Page 37 of 209
3.1 ROLE
The need for an updated evaluation of the Australian Sentinel Practice Research Network (ASPREN) was identified by the National Influenza Surveillance Committee (NISC), a sub-committee of the Communicable Diseases Network Australia (CDNA). I was the lead investigator and author in this evaluation. I worked with influenza epidemiologists and the Director of the Vaccine Preventable Diseases Surveillance Section at the Department of Health to list the national objectives of ASPREN and to identify key stakeholders of the system. Prior to this evaluation, the national objectives for the system were described in contract agreements but had not been clearly defined and listed in one place. I visited ASPREN administration and spent a week understanding the system and collecting relevant data for the evaluation. I formulated, developed, and administered the surveys used to collect stakeholder views of the system and extracted, cleaned, and analysed relevant influenza surveillance data from ASPREN and the National Notifiable Diseases Surveillance System (NNDSS). Christina Bareja, an influenza epidemiologist at the Department assisted with the extraction of ASPREN data. Once finalised, this evaluation was shared with ASPREN administration and general recommendations were presented to the National Influenza Surveillance Committee (NISC).
3.2 LESSONS LEARNT
At the beginning of this project I thought it was my job to both identify where the system needs improvement AND to fix these issues. However, I have learnt that the role of an evaluator is to clearly highlight where deficiencies are and what may be considered for system improvement rather than to solve the shortcomings. I have learnt that the most relevant recommendations are usually the most obvious and not to think too deeply about improvements as complex recommendations may not be the most practicable. For influenza specifically I have a new respect for the complexity of its epidemiology and the need for multiple sources of surveillance data gain an understanding of transmission and clinical severity. In Australia no one influenza surveillance system can tell the whole story and this is the same situation internationally. Most importantly I have learnt that the usefulness of a surveillance system really depends on having clear system objectives and agreed public health actions taken for defined surveillance signals.
3.3 PUBLIC HEALTH IMPLICATIONS
Page 38 of 209
trigger an investigation into alternative and epidemiologically meaningful measures of representation. At the request of NISC members, the ASPREN evaluation will be distributed to the committee and also to other interested stakeholders.
3.4 ABSTRACT
Objective: To evaluate the Australian Sentinel Practice Research Network (ASPREN) against the
objectives set for the system by the funding body, the Australian Government Department of Health.
Importance of study: Syndromic surveillance for influenza-like illness (ILI) is an important
component of national influenza surveillance as it acts as an indicator of influenza virus transmission activity and clinical severity of disease in the community. The results of this evaluation inform recommendations to improve the quality of data on which public health decisions are made.
Methods: The Centres for Disease Control and Prevention (CDC) guidelines for evaluating public
health surveillance systems were used to assess the usefulness of the current system and nine system attributes. Responses to annual general satisfaction surveys were collected by ASPREN administrators and were used to assess the acceptability of the system to general practitioners (GPs). Stakeholders were identified (N=14) and included representatives from the Commonwealth, state and territory epidemiologists, representatives from SPNWA, VicSPIN, the World Health Organization Collaborating Centre for Reference and Research on Influenza (WHO CC), and OzFoodNet. Stakeholders were surveyed to understand how they use ASPREN data and their perceptions of system performance. ASPREN syndromic and virological data for 2011-2015 were analysed to assess timeliness, representativeness, predictive value positive, sensitivity, and data quality.
Results: The data collected through ASPREN are recognised by stakeholders as complementing and
filling gaps in national influenza surveillance; principally as an early indicator of influenza transmission and clinical severity in the community, a source of data to ‘ground’ laboratory-confirmed notifications of influenza, and a valuable source of relatively un-biased specimens for influenza virological characterisation. ASPREN syndromic data were found to be timely and with a good predictive value for influenza infection. However, due to poor system performance in representation, simplicity, and sensitivity, there is a lack of confidence in the signals generated by short-term changes in ASPREN syndromic data.
Conclusion: Recommendations are made to improve the representativeness, simplicity, sensitivity,
Page 39 of 209
representativeness of primary care ILI surveillance systems is challenging but necessary for the collection of meaningful data.
3.5 INTRODUCTION
3.5.1 The public health importance of influenza in Australia
Influenza, or “flu”, is a disease caused by infection with influenza virus.1,2 In temperate climates,
annual epidemics of influenza occur during the winter months.2 Influenza viruses are classified into
types A, B, and C.1 Influenza virus types A and B are clinically important and can be further divided
into different virus subtypes and strains.1 In Australia, predictions are made as to the likely strains that
will circulate during seasonal epidemics. These predictions are based on information from previous seasons as well as current epidemics occurring in the northern hemisphere.2 Based on recommendations of the World Health Organization (WHO), seasonal influenza vaccinations are formulated and are available prior to the influenza season each year in Australia.2
Influenza A viruses have a segmented genome, giving the opportunity for ‘genetic shift’ whereby genetic material is exchanged between different virus strains creating novel strains. If such a novel strain is capable of person-to-person transmission, influenza virus pandemics may arise where the protective immunity of the population is minimal and increased morbidity and mortality rates occur.1 The most recent example of such a pandemic was the global circulation of a novel influenza virus subtype H1N1 which was first detected in Australia in 2009.1
Influenza is a common disease. In 2015 there were 100,558 laboratory confirmed cases of influenza in Australia which gave a crude national annual notification rate of 420 cases per 100,000 population.3 It is important to note that notification counts are an underestimate of the true influenza burden in the community, and do not capture those cases which do not present to health care, or present to healthcare but do not receive laboratory confirmation of infection.4 Commonly quoted community attack rates for seasonal influenza in Australia vary between 5% and 20% but may be as low as 1% in years of low activity.5
Infection with influenza virus may result in no apparent (asymptomatic) symptoms or disease of severe morbidity and mortality.6 The severity of disease depends upon the virulence of the strain, the degree
Page 40 of 209
(< 5 years of age), pregnant women, and those of any age who have existing health problems such as heart, lung, kidney, liver, immune, or metabolic disease.2,4 Mathematical modelling suggests there are on average 13,500 hospitalisations and over 3,000 deaths per year in Australians aged 50 years and over.7 The case fatality rate for seasonal influenza may vary between 0.14% and 1.4% given different estimates of attack rates.5 During pandemics, severe disease may occur irrespective of age and general
health status.8
Influenza is a costly disease. Using the costs associated with the use of healthcare services: general practitioner consultations and hospital admissions, it has been estimated that the annual cost to the Australian health care system due to influenza is $115 million.4 Higher financial burden may be felt
during pandemic situations. For example, during the 2009 H1N1 pandemic, the virus was capable of causing severe disease, especially in the young to middle aged, and the impact on intensive-care units (ICUs) was higher compared to seasonal flu.9 One study found that the total cost of treating patients in Australian and New Zealand ICUs during the winter of the pandemic was more than $65 million.10 These estimated costs do not consider the financial losses associated with absenteeism from the workforce. In 2008, 1.5% of employees were absent from work for more than three consecutive days due to influenza.2 During the 2009 pandemic, 57% of surveyed emergency nursing and medicine staff who became ill reported absenteeism of at least one day with an average time off work of 3.7 days, resulting in loss to the essential provision of health care.11
3.5.2 Influenza surveillance in Australia
According to the National Influenza Surveillance Scheme, the national objectives of influenza surveillance in Australia are to:11
1. Ensure the early detection of influenza epidemics; 2. Trigger public health prevention and control activities;
3. Characterise the epidemic, especially identification of risk groups and disease severity; 4. Estimate the impact of the epidemic;
5. Characterise the circulating viruses to inform vaccine virus selection and assess the effectiveness of antiviral medications; and
6. Ensure flexibility to enable adaptability for responding to additional surveillance requirements during a pandemic or particularly severe season.
Page 41 of 209 Figure 3-1. Influenza surveillance systems designed to capture disease at different levels of clinical severity. Adapted from information from Franklin et al.12
3.5.2.1 Laboratory surveillance for influenza in Australia
The primary and most standardised system for influenza surveillance in Australia is the National Notifiable Diseases Surveillance System (NNDSS). A national case definition is used for the reporting of laboratory-confirmed influenza infections.13 NNDSS notifications consist of patients presenting to primary care, emergency departments, or to hospital. For notifications of laboratory confirmed influenza, a field is available for all states and jurisdictions to record the mortality status of the case, where case follow up or linkage with morbidity collections has been undertaken. The completeness and timeliness of this field is poor and likely underestimates the true number of mortalities associated with influenza virus infection.12 Currently there are no denominator data for NNDSS notifications; the
magnitude of which are influenced by the amount of testing.
Page 42 of 209
and Medical Research (ICPMR) in Sydney, and Victorian Infectious Diseases Reference Laboratory (VIDRL) in Melbourne.12 NICs report both numerator and denominator data for influenza virus testing. The WHO Collaborating Centre for Reference and Research on Influenza (WHO CC) in Melbourne receives influenza virus samples from laboratories around Australia for virus identification and advanced antigenic and genetic analysis to monitor virus evolution and sensitivity to antiviral drugs.12
3.5.2.2 Sentinel surveillance at primary care centres in Australia
Using data collected from 2000 to 2006, each year it is estimated that on average, influenza infection is associated with over 300,000 general practitioner (GP) consultations.14 Surveillance of


![Figure 2-6 Infectious syphilis notifications for Aboriginal and Torres Strait Islander people, 2006-2010 [blue bar] & 2011-2015 [red bar]](https://thumb-us.123doks.com/thumbv2/123dok_us/1751320.128605/28.595.60.537.152.464/figure-infectious-syphilis-notifications-aboriginal-torres-strait-islander.webp)