Graphics for Information Retrieval
Mark D Dunlop and Ian G Ruthven
Computing Science Department University of Glasgow Glasgow G12 8QQ, Scotland
Abstract
Several research groups have addressed the problem of retrieving vector graphics. This work has, however, focused either on domain-dependent areas [1,2] or was based on very simple graphics languages. Here we take a fresh look at the issue of graphics retrieval in general and in particular at the tasks which retrieval systems must support. The paper presents a series of case studies which explored the needs of professionals in the hope that these needs can help direct future graphics IR research. Suggested modelling techniques for some of the graphic collections are also presented.
1.
Introduction
Historically information retrieval (IR) has concentrated on how to extract information from text. Although far from perfect, there are well-developed techniques for analysing the concepts present in a body of text and metrics for predicting the relevance of a document to a query. In a sense, documents only operate on one level, what a document is about is contained within the document and can be approximated by a set of significant terms drawn from the document text. A major advantage for text retrieval is that the standard means of interrogating a text collection is the same as that of describing the documents themselves, by using a set of words.
Retrieval of images and graphics is more complex – the notion of what a picture is about is much harder to extract because of the variety of ways in which an image can be described and the reliance of many of these ways both on human annotations and on knowing what type of retrieval the user would wish to perform. Pictures operate on more that one level, a picture of Mickey Mouse and Donald Duck, for example, can be described in many different ways: literally, as an image of two Disney characters, operationally as an image that contains areas of black, blue and white, conceptually it may be described as holiday snap or a 'happy picture'. The difficulty is in knowing which of these descriptions are most appropriate and which are most likely to be the attributes that a user will want to use to retrieve the image. Added to this is the problem of specificity – is it sufficient to index Mickey as a single item or should he be decomposed into body parts? This, again, is related to the form of query that is likely to take place on the system.
At a very crude level one can consider two forms of retrieval from collections of pictures:
• Recall based searches where the user is attempting to retrieve a particular picture (s)he knows is present in the
collection. In this form of retrieval it is highly likely that the coarse grain features of the image will be the keys to retrieval (main object shape, approximate location, colour and texture). These features are the ones which not only describe the target picture but separate it from the rest of the collection.
• Exploratory based searches are much closer to traditional searching in textual IR, but with a much poorer
definition of topicality. The features used to search for unknown images about a given topic are more likely to include semantic objects as the primary keys to retrieval and are more likely to target a class of images. This is, of course, a very crude categorisation and the content of the pictures and the nature of the user’s task and information need are likely to play a significant part on the form of retrieval which must be supported. With respect to picture content, there are essentially two approaches to storing pictures on computer systems:
Images which are stored in raster format. These are often digitised versions of existing images, such as photographs,
x-rays, etc. but are sometimes created with ‘painting’ programs (e.g. Apple's MacPaint and Adobe Photoshop). Images are essentially considered as a set of colour values on a grid of pixels but various storage and compression formats lead to many different standards (e.g. JPEG, GIF and TIFF).
Graphics which are typically computer-produced pictures that are stored as a set of geometric operations. This form
in use (e.g. Postscript, GKS and PICT1 [5]) . Graphics files can also be produced by processing scanned line
drawings.
The prime difference between graphics and images for retrieval is the level of knowledge one has of the content of the picture. Image files only contain colour values and approaches to indexing must be based mainly on course image features or on some form of user provided indexing. Graphic files, however, contain very detailed information about the structure of the picture and how basic objects are combined to produce higher level objects.
Attempting to model a full understanding of the content of pictures is ludicrous and, as has been shown for text retrieval, is almost certainly not required to perform IR. Information retrieval is not concerned with producing precise answers to queries but with providing possible matches to the user. In the absence of complete descriptions, alternative approaches must be sought to support image and graphics retrieval.
Once the idea of full understanding of graphics files is ruled out, the retrieval process has to establish other methods of describing these files. There are two main approaches to establishing these methods: derive models that are easy to implement and use them for retrieval or establish what forms of retrieval are likely on graphics so these can be used to develop a model to support these tasks. This paper explores the second route, it identifies a set of professions that make use of graphics in their work and may use a graphics retrieval system if available. The paper is presented as a series of case studies which were carried out to establish how graphics are used, what features of graphics are regarded as important in the selected domains and how potential users would interrogate a graphics retrieval system. This last point is important because the features that form the basis of a query need not be text, as in the familiar IR systems, and only by understanding users’ needs can graphics retrieval techniques be developed which will directly aid users.
As less work has been done in understanding graphics retrieval, and very little work has been done on general graphics retrieval systems, this work concentrates on graphics retrieval. This decision to target one form of picture is supported by the hypothesis that the requirements, and problems, of graphics and image retrieval will be different in nature as indicated previously. Furthermore, we will concentrate mostly on computer generated graphics files and not, say, photographs of line drawings.
2.
A Case Study Approach
In order to analyse the potential requirements of user groups on graphics retrieval systems a series of meetings were carried out with representatives of suitable professions. The professionals were informed in advance of the rough nature of our investigation and were then asked to describe how they use graphics. The interviewers then tried to ascertain how a retrieval system, of the kind similar to free text IR engines but operating on graphics, could be used to aid their work.
It was important to target both a wide range of professionals who would make use of graphics in their work, and also to investigate as many types of graphics as possible. We were interested in not only graphics that could be produced by commercial drawing packages but also those which come from other sources, e.g. hand-drawings or experimental results. As such the following case studies were carried out and are reported in this paper:
• Medical doctors use graphics for many purposes. During the case study we concentrated on electrocardiograms (ECGs) but also discussed many other forms of graphics doctors use. ECGs record the activity of the heart and are widely used both as a diagnostic tool - to indicate the presence of cardiac disease or irregularities in the heart - and as an indicator of other diseases. ECGs are especially interesting because, although they can be described as text or numbers, in practice doctors rely almost exclusively on the graphical representation. ECGs also typify the type of chart-like which is one of the main categories of graphics that an adequate model of graphics retrieval should be capable of addressing.
• Architects use graphic plans (blue prints) exclusively to explain and design a new building – very few buildings are designed in prose. As such a case study was carried out with an architect in order to establish how architects may use collections of plans to aid their work.
• Map users provide a connection with the field of geographical information systems and any model for general retrieval should be capable of dealing with many aspects of retrieval performed on GISs.
• Archaeologists have requirements to look at similar plans to architects but for different purposes. Archaeologists are concerned mainly with piecing together a coherent explanation for the finds at a particular site. As such, access to plans and documentation of other sites may be of great use.
• Forensic scientists were considered as a source of potential information on finger print matching and, possibly, scene of crime mapping information.
1 Apple’s PICT file format supports their QuickTime library of graphics operations. The format is a graphics / geometrical format
• In order to look at how statistical graphs are used we considered the results of psychology experiments. • Circuit board designers are faced with many problems of layout and organisation of components on boards.
As such we considered these designers to be potential users of graphics retrieval systems in the hope that providing access to previous designs would be of use.
• Finally we look at MacDraw files in an attempt to consider domain independent graphics retrieval.
It is not the intention of the paper to present a complete list of the functional requirements for graphics retrieval, that is simply not possible except for a chosen target domain, and is of little use on its own. Rather we sought to elicit the use of graphics, how graphics are viewed and the role the semantics as opposed to the structure of the image has for a professional user of graphics.
2.1. Medics
2.1.1. ECGs
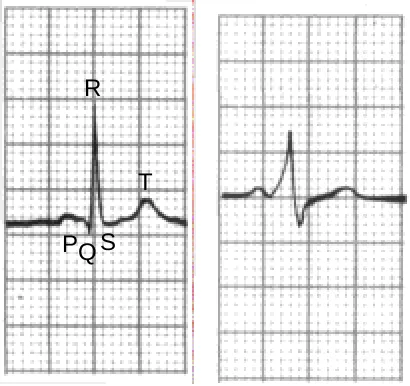
ECGs record the electrical activity of the heart and are usually taken at nine different sites around the patient’s body. At each site the recording equipment records a single beat of the heart and presents this as a graph (see Figure 1), a separate trace is also provided for several beats in order to analyse rhythmic and other longer term characteristics. The plots produced by the ECG equipment are used to diagnose heart problems are always stored in a patients records.
Each individual beat can be broken up into five main waves: the initial up bump P, the down peak Q, the main up peak R, a small down peak S and finally an upwards bump T. Analysis of the graph depends on both the length of these sections and the shape of the curve within each section. As an example the upstroke of the R wave is slurred in the right-hand image in figure 1 when compared to a normal ECG shown on the left. This slurred upstroke is characteristic of the disease Wolff Parkinson White Syndrome. Hampton [6] provides a fuller description of ECGs and common diseases which can be identified from their analysis.
In discussion the idea of an information retrieval system operating on these graphs was discussed. Although it was felt unlikely that medics would use such systems to directly access previous cases in a clinical situation, it would prove to be a valuable teaching aid to help train doctors on the analysis of such graphs. It was also felt that occasional use may be made when an unusual or undocumented ECG is recorded.
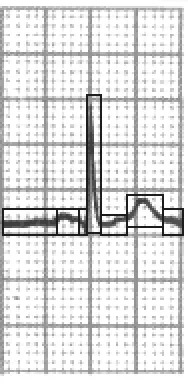
One other possible use of information retrieval is in simple diagnosis of conditions. Very simple approaches to diagnosis can be carried out by ECG machines and often result in some suggested diagnoses. These diagnoses are very basic. The ECGs shown in books are typical cases, but no two people will show exactly the same graph for a certain condition. Other factors such as severity of the condition, or previous heart disease may alter the trace. Information retrieval systems, using partial or fuzzy matching, can indicate those graphs which are most similar to the patient's graph. Current machines typically work by analysing the length of each section and do not consider the shape of the curve within each section. As such, they tend to be quite limited in their success. However, since they can split the curve up into sections this information could be similarly derived to be used for indexing the scans. Such an analysis may result in sections as follows:
PQ
R
[image:3.595.201.406.497.690.2]S
T
Figure 2: Segmented normal ECG.
The remaining form of indexing which is required is on the shape of individual segments of the curve, for example Wolff-Parkinson-White syndrome requires the shape to be indexed. To index the shape of individual segment curve the simplest approach would be to approximate the curve as a n-element polyline by splitting the curve segment into n equal length straight lines.
The polyline can then be represented as the angle between successive elements of the polyline. These angles could then be used as the index for an individual curve which could be combined with spatial information connecting segments to give an overall indexed definition of the curve which can be used for matching and retrieval.
Although this approach would have to be tested with a real retrieval system it does show that the form of retrieval which would interest medics can be modelled.
2.1.2. Sketches
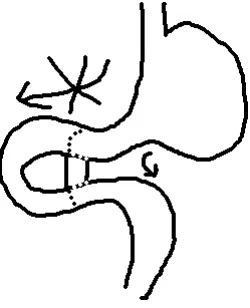
Medics also make extensive use of small sketches in medical notes. Figure 4 shows a typical sketch which explains the precise nature of an operation on a stomach. These sketches are often used to describe variations from standard procedures, and to indicate features that are difficult to describe verbally, for example locations of tumours.
Although these are normally line drawing they are more akin to images than graphics as the doctor is highly unlikely to use a computer drawing package to create the sketch. Indexing of such images could, however, be carried out after initial processing to identify the line drawing from a scanned image.
[image:4.595.164.446.498.592.2]Figure 4: Stomach operation sketch.
2.2. Architects
There a variety of users for a graphical retrieval system accessing collections of architectural plans and details: academics, architectural students, contractors, surveyors. Currently drawings are accessed by looking at titles, but this doesn't always give an indication about what is contained within the drawings or plan. As not all the detail about the graphic is encapsulated within the title, most users rely on heuristics or manual search to find graphics of interest. Architects use graphics in a number of ways to describe facets of a building: layouts of floors, cross-sections of buildings, details of parts of a building or features of buildings such as door-handles, windows or the materials used in the construction of a building. Common drawing conventions are used to specify types of features, e.g. how a cavity wall is represented, or the symbol for an electrical socket. Pattern is also used to distinguish between different materials: concrete appears on plans as a collection of different sized circles, various types of timber can have different markings to distinguish the wood used but are typically shown with wavy lines. Even though different companies and schools may use variations in some patterns there are widely used conventions to describe common features.
Certain features of plans make them suitable for graphical retrieval as opposed to retrieval by text descriptions. For example, parts of the drawing can indicate what the drawing is about - if it contains a wall then it is not a detail. Line weighting is another clue to the type of plan which is easily recognisable - different line weights are used to indicate differentiate between features of the plan, e.g. standard lines would indicate the layout of a floor and thick lines indicate that part of the building has been removed to show a feature.
As layouts and plans often follow a convention certain generic patterns can arise, e.g. L-shaped houses. Graphical retrieval can then be used to retrieve similar patterns or variations on a theme using a query-by-example approach. Lots of architectural drawings are done by CAD systems, these often use library routines which are not stored with the drawing but are called when the drawing is displayed. These common items could be used to provide initial building-blocks for a query.
Other types of retrieval on for example detailed drawings of features of a building would involve the user distinguishing between categories of details (windows, doors, etc.) and aspects of the details (materials used for window frames or door-handles, for example). This is one example where relevance feedback would seem particularly suitable. In this case, although the retrieval is likely to be primarily on the graphical component of the plans, common queries may involve associated text, e.g. 'Three bedroom house' or 'Underground garage' would need to make use of the text to be found in the plans. Similarly other features which would limit the scope of the user's search would require information that would not necessarily be in graphical form, e.g. age of building, architect or company responsible.
Scale is another interesting issue: instead of normalising or ignoring scale, as is commonly the case, we may want to use it; e.g. 'Give me something where X and Y are roughly in this proportion' or 'Give me something of this size'. This would disambiguate between two like symbols used on different scales (e.g. a screw and helicopter landing pad).
Architects plans seem to be a domain in which retrieval of graphics as opposed to plain text is preferable. The main attribute of these plans which make them amenable to graphical searching is that they are easily visualised and that the differences between them, the differences that make one variation on a style more relevant than another cannot always be easily expressed verbally. For example differences of proportion can give a different feel to a building without necessarily changing any other characteristic.
Figure 5: Two villages with churches on a loch side.
2.3. Map Users
Considering retrieval from high quality maps, e.g. the UK range of Ordnance Survey maps highlights a key difference between graphics and image retrieval. Figure 5 shows maps of two similar villages which we would hope would match reasonably well. With a general image retrieval system the indexing approach must record the likelihood of the symbol being a church. With a graphics map system, however, this is known without doubt since the symbol would be stored as the predefined church logo.
A graphical indexing of the two scenes in figure 5 would produce a village with a set of houses and a church (although the inclusion of the church in the village may be dubious for the right-hand map), a loch, a road and a hill (composed of many contour lines). In a similar manner to ECGs, spatial information concerning the objects can be used to generate some indexing information in a similar manner to how an image would be indexed (hill is south west of the village). The curve of the road must, however, be matched at the graphics level in order to cope with varying shapes of known objects.
2.4. Archaeologists
Archaeologists may be thought to have similar requirements to architects and map users. In the event, however, the main requirement established was not for a graphics retrieval system but for an image retrieval system. It is, however, interesting to compare the techniques required to support their needs with those of graphics retrieval.
Archaeologists are often faced with a small piece of artefact which is found at a site and the identification of this is one of their main information gathering approaches. As an example, most pottery carries a stamp on the bottom which identifies the maker of the article. This is not a modern development but an ancient technique which is often used to trace the movements of populations, individuals and their trade. A retrieval system which could store images of these stamps for a large area, e.g. the whole of Scotland, and which could be used to match a newly discovered stamp would greatly aid this part of archaeology.
Even though the impressions are all likely to be made by the same stamp, this is not a simple raster matching operation. Stamps are typically applied while the pottery is still elastic and before glazing, this results in many small deformations taking place during production. These can then be further compounded by time which results in stamps being chipped, cracked, broken and colours fading and merging. It is also very common to discover only a small fragment of a stamp. This form of image retrieval would almost certainly involve some form of query time processing to match two potential images. While much work could be done in supporting this form of searching, it is clearly outwith the area of graphics retrieval.
2.5. Circuit Board Designers
Even less success was found in discussion over circuit board design. Although circuits are very visual and their layout must take into account many visual properties, the layout of circuits is now down completely automatically by board design software. Each software package may design the same circuit or chip to have the same functionality but lay it out in a different fashion. The graphical view of a circuit that the designer sees is a representation of the components, not necessarily a faithful description of the actual spatial relationship of the components. There is little use in being able to access previous cases of design because it is the functional attributes of the circuit, which are typically stored in numerical record format, which are of interest.
2.6. Experimental Psychologist
Psychologists and other social scientists use graphs to compare and contrast experimental results. Simply plotting a series of points on a graph can give an indication of what type of relationship exists between two variables, e.g. normal distribution, bimodal distribution. The graphs can also shed light of the distribution of the data itself, e.g. indicating whether it is skewed or bi-modal.
The shape of a graph is determined not only by the points on the graph but by factors such as the scale of the graph, the type of graph and the position of the origin. Different views of the same data set can elicit different information and some argue manipulating the graphs can give new insights into the experiment and underlying assumptions.
The fact that different views on the same data can give such different interpretations means that there is actually very little need for retrieval of the graphs. What is important is the underlying data table and the use to which the data is being put.
As with circuit diagrams, experimental graphs are extremely useful in representing information but are unlikely to be the basis of a query themselves. Users are much more likely to base a query or a search on the what the graph describes, that is the experiment, the variables used in the experiment and the results of the experiment. This is another case in which a query involving graphics would likely to be a mixed graphics-text one, e.g. "show me all graphs about intelligence where there is a suggested correlation with another variable". Although, again, the ultimate goal of such a search is likely not to be the graph itself, but the text associated with the graph.
2.7. Forensic Scientists
Forensic scientists were initially considered for a case study as a profession which deals with many pictures to perform their work. However, in discussion it transpired that very little use if required for graphics retrieval but that considerable use could be made of image retrieval. As an example scenario consider forensic scientists or the police having access to an on-line collection of “mug shots” of ex-convicts. These images could then be matched with, say, still images extracted from bank security cameras in order to highlight potential suspects. As with archaeological artefacts many image transformation models would be required to stretch, shrink and rotate the images until an approximate match is found. It would also, however, be extremely powerful if a 3-D model could be developed from mug shots (which are often taken from both sides and the front). This model could then be used match against the best photograph from a video tape – no matter the angle the image was captured from.
2.8. Modelling of MacDraw
As a domain independent indexing problem, we considered retrieving general graphics as they would be created by a program such as MacDraw. This case study is based on the tools available in most object based drawing packages but refers particularly to those found in the drawing environment of ClarisWorks 2.0. This study also concentrates more on possible methods for indexing rather than user requirements.
2.8.1. Moronic Indexing
The simplest approach to indexing and retrieval would be to index graphics files based on the basic elements they contain. These can be reduced to four basic objects (polygon, arc, quadratic curve and rounded rectangle) with other objects being converted into these basic items (e.g. rectangles and lines as simple polygons). A file’s contents would then be modelled as a list of basic objects with attributes associated with each object (e.g. position on page and arc angle for an arc).
Although far removed from the semantic content of a graphic this is quite close in spirit to what occurs with traditional textual indexing and marks the base line for modelling.
2.8.2. Total Modelling
A highly detailed model (e.g. [8]) could be used to totally describe the layout and structure of the graphic (structure can be derived from grouping information). This would lead to a very rich description of the graphic, however this likely to be almost impossible to match as it will be far too specific. The matching routine would have to take into account a comparison between a rectangle of size 1x1cm at location 20x30 and an arc of 340° of size 1.5cm by 1cm at position 25x25. It would also have to compare this with arcs and polygons at completely different positions (to account for translation of similar image across the page) and for compound objects at the same location (or elsewhere!).
2.8.3. Segments
A possible approach would be to reduce the graphics primitives (arcs, polygons etc.) to line segments and index the object on these segments. This is similar in nature to the vowel-consonant-vowel triple approach being adopted by Glavitsch and Schauble [7] for speech retrieval.
The approach to indexing graphics can be viewed as a four layer approach with the retrieval engine at the top and the basic elements of the graphical language at the bottom (e.g. postscript or MacDraw’s PICT language). Between these are the indexable primitives / graphical model of the file and the indexing structures. Here we are considering using arcs, polygons, line segments etc. as the graphical model but many other approaches would also fit into this framework. This framework is being explored elsewhere in the FERMI project [8].
Indexing structures
Graphical model set of primitives
PS, PICT, GKS
IRS
3.
Example Graphical Representation
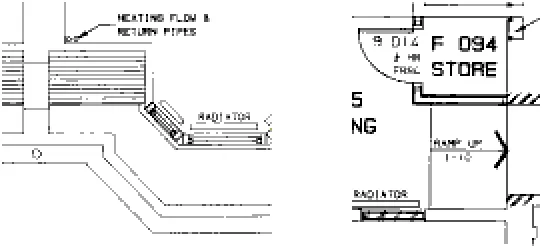
In this section we take the EMIR2 model, presented in [8] for image retrieval, and demonstrate how that model can be used to index graphical document collections. Figure 6 shows an extract from an architecture plan which is used as an example throughout this section.
The EMIR2 model represents a picture as a physical view and a set of high level picture elements2 which form
a logical view. The physical view is, essentially, the underlying representation of the drawing (fundamental objects’ location, colour, pattern, and size together with layering and grouping information).
The logical view is composed of a set of picture elements. Each picture element is represented with the following views:
symbolic view: a semantic description of the picture element. In the case of the architecture example, this could be a
specification of the part of the building which is contained in a picture element and could be stored in a formal representation or simply as a free text description. With picture elements being composed hierarchically, the element could be a whole building, a room within a building or a detail of a heating fixture. This information is lacking from the raw file structure and would have to be added for full indexing. However, the EMIR2 model does not require this to be done manually and could be done (semi-)automatically (e.g. Rabitti and Savino [9] presented a knowledge based system which could be used to predict the symbolic view form information held within the physical view).
structural view: the structural view records the semantic organisation of elements within a picture (e.g. an office
contains a room which contains a radiator and a store). This form of information could be extracted from the raw drawing representation by using a simple rule based system (possibly making use of grouping and layering information from the picture).
spatial view: the spatial view records the outline shape of objects and their approximate geometric relationships (e.g.
the radiator is west-of and close-to the ramp in figure 6b). This view provides a rough matching technique and is, essentially, an abstraction of information directly derivable from architect plans.
[image:8.595.170.441.543.667.2]
Figure 6: Sample architecture plan (two excerpts)
2 Mechkour refers to an image being composed of a group of ImageObjects, here we remove the direct reference to images and
perspective view: this view records a similar abstraction of information as the spatial view but records visual aspects
of the file (e.g. its colour, brightness and texture). Texture information could be used directly to model aspects such as the building material (architects typically use different hatch patterns for different woods, spotty patterns for concrete etc. – for example in figure 6 the large striped area represents angled roof space and the hatching around the store load bearing supports) of architecture plans (see figure 6).
These views allow many styles of query to be supported which can mix information from different views (e.g. find plans which use concrete for a short stretch of wall between a kitchen and bedroom).
4.
Conclusions
One of the major conclusions from this study is that retrieval of pure graphics is only worthwhile when the graphic is the key representation of the information. In the cases in which users claim graphical retrieval is of little use, the graphics appear to be very abstract representations or views onto underlying set of data. In these cases, although the professionals make extensive use of graphics, the graphics themselves are not the interesting feature nor the only way of representing the data and are not what they would choose to search upon. For example, experimental graphs are a quick and easy way to represent and test for relationships within data but what an experimenter is really interested is what causes a relationship. Similarly, a circuit designer may look at a graphical representation of a chip in order to visualise the logical layout, but she is unlikely to be interested in the particular physical layout. In cases like this where the graphic is a very abstract representation graphical retrieval is not going to be of much use per se, what may be of use is retrieval of the graphic with some associated text. Here the graphic may be used in a similar fashion to the normal use, that is to provide an easy means of assessing what has been retrieved.
This leads to the conclusion that the interpretation of graphics is much more dependent on the context in which they are used than for images. It may be the case that graphics are indeed content-limited in the sense that the graphic may require the supporting text to be of use. A common question that is asked of graphical material is 'what does it represent?'. The interpretation of images can also be affected by their context but most images can be described independently of any supporting text3. Indeed, collections of images are common but collections of some
types of graphics would be hard to imagine without additional text to describe them.
One important and common relationship in most graphics is spatial relationships; experimental graphs have a variety of terms for describing the distribution of data as viewed spatially. Map users and architects also have to describe spatial relationships between objects. One of the exceptions is circuit designers, who as already noted are dealing with much more abstract representations of the objects they are interested in.
Furthermore, although graphical retrieval can be performed by analysing lines [e.g. 2], it is much more likely that domain-specific systems are required. There are two reasons for this; firstly, in the areas we have looked at, collections of graphics tend to be very homogeneous. Secondly, in situations and professions where graphical retrieval is of use, the users already tend to have a well-developed vocabulary, either linguistic or graphical for describing their area of interest. Any system which would attempt to retrieve graphics would need to take into account this vocabulary and include special symbols such as keys. This is an additional feature which may separate image and graphics retrieval, in image retrieval as it is doubtful whether such a vocabulary exists for the wide range of potential image users.
Although this work was primarily intended to look at graphics retrieval some tentative conclusions may be made concerning images. Firstly our initial hypothesis that graphics and images will require different retrieval methods is supported by the results shown here. The cases we covered can be split into three categories:
• primary data graphics — graphics which are normally analysed and stored as the graphic and which are not typically visualised in another formats;
• secondary data graphics – graphics which are representations of underlying data (the graphic may be used for analysis but the underlying data is the fundamental information);
• images – non-structured rasters.
Primary data graphics for the specific domains covered here (i.e. ECGs and building plans) are the most promising general category of graphics for retrieval. The use of domain specific information and conventions for graphic construction looks like the key to producing useful retrieval systems on collections of graphics.
When graphics are used as the secondary data, in the domains we considered, it is more suitable to retrieve from the underlying data rather than the constructed graphic. The graphic may, however, still be used for rapid relevance assessment as part of the relevance feedback process.
From the initial thoughts on image retrieval it looks as if some run-time comparison of images will be required, whereas for graphics it may be possible to index the files (e.g. ECGs could be indexed by segment length
and short descriptions of the internal curve and architect plans by various methods suggested in section 3). In the areas we discussed where image matching would have been useful the level of image manipulation required to permit matching would be too high to allow an index of the image content to be created. Another problem with image retrieval is that the level of detail in images is also too low to permit semantic matching. This may be acceptable for queries based on users’ memory of pictures but is a major problem for more traditional IR-style topic retrieval.
In summary our case studies have shown that for graphics retrieval user involvement and work in a specific domains, where the graphics are the primary objects, may be the only way of developing satisfactory retrieval systems. However, with these constraints it looks likely that many useful applications could be found.
5.
Acknowledgements
This work was carried out as part of the European Union funded FERMI project (project number 8134). The work could not have been carried out with the help, time and understanding of the professional graphics users whom the case studies were based on.
6.
References
1 Kurlander, D., and Blair, E.A.. Graphical Search and Replace. Computer Graphics. vol 22(4): pp. 113 -120. August 1988
2 Lorenz, O., and Monagan, G. Retrieval of Line Drawings. Proceedings of The Third Annual Symposium on
Document Analysis and Information Retrieval. Alexis Park Hotel, Las Vegas, USA, April 1994.
3 Lorenz, O., and Monagan, G. Automatic Indexing for Storage and Retrieval of Line Drawings. Proceedings of
IS&T/SPIE's Symposium on Electronic Imaging Science & Technology .San Jose Convention Center, San
Jose, California, USA. Feb 1995.
4 Meghini, C. A Model for Image Bases and its Query Facility. Proceedings of ACM SIGIR 1995. Seattle, WA, USA. ACM. 1995
5 Mechkour, M.. A Conceptual Model for Graphics. Université Joseph Fourier Grenoble, Fermi technical report. 1995.
6 Hampton, J.R. The ECG in Practice (second edition), Churchill Livingston. 1992
7 Glavitsch, U., and Schäuble, P. Speech Retrieval in a Multimedia System, SIGMOD Record, vol 23(4) : pp 57-63, 1994.
8 Mechkour, M. A formal multifacet image model for information retrieval, Proceeding of MIRO workshop, Glasgow 1995
9 Rabitti, F., and Savino, P., Automatic image indexation and retrieval. Proceedings of the RIAO 91 conference
on Intelligent Text and Image Handling, Universitat Autònoma de Barcelona, Catalunya, Spain, pp. 864-884.