COUCIL OF
THE EUROPEA UIO
Brussels, 12 March 2009
7555/09
ADD 1
EER 84
COVER OTE
from:
Secretary-General of the European Commission,
signed by Mr Jordi AYET PUIGARNAU, Director
date of receipt:
11 March 2009
to:
Mr Javier SOLANA, Secretary-General/High Representative
Subject:
DG TREN Staff Working Document
- Report on Progress in Creating the Internal Gas and Electricity Market
Technical Annex to the Communication from the Commission to the Council
and the European Parliament
Delegations will find attached Commission document SEC(2009) 287.
________________________
E
EUROPEAN COMMISSION
Brussels, 11.3.2009
SEC(2009) 287
DG TRE STAFF WORKIG DOCUMET
Report on Progress in Creating the Internal Gas and Electricity Market
Technical Annex to the
Communication from the Commission to the Council and the European Parliament
COMMISSIO STAFF WORKIGPAPER
REPORT O PROGRESS I CREATIG THE ITERAL GAS AD
ELECTRICITY MARKET: TECHICAL AEX
BACKGROUD TO THIS REPORT
This summary technical report contains important background information relevant to the
main 2008 Communication on the implementation of the electricity and gas Directives
1. The
bulk of the information is based on the reports made by national regulators, which were
submitted in the second half of 2007. These individual reports have been published and can be
found on the website of the European Regulators’ Group for Electricity and Gas
(
www.ergeg.org
).
This report consists of comparative tables and graphs which, as in previous benchmarking
exercises, draw together key indicators submitted by regulators. In addition, the Commission
has this year conducted separate country reviews of Member States which are more forward
looking assessments of the prospects for competition.
2Since these comprise the main
evaluation work of the Commission, no commentary has been provided for the tables in this
document.
Most of the data used was submitted at the end of July 2008 and generally reflected the
position at that date. However, some data items, referring to the information in a particular
calendar year, will refer to the year 2007 as a whole. Where data is currently unavailable, this
appears in tables as follows: “NA” (not available) or in the case the data is not applicable for
the abbreviation: "NAP".
TABLE OF COTETS
1.
LEGAL IMPLEMETATIO... 5
Table 1.1 Market opening gas & electricity: Proportion of market open to competition . 5
2.
CUSTOMER DIMESIO ... 6
Table 2.1 Increase in Annual Switching Rate Electricity 2006/2007 (by volume) ... 6
Table 2.2 Increase in Annual Switching Rate Electricity 2006/2007 (by eligible point) .... 7
Table 2.3 Annual Switching Rate Gas 2006/2007 (by volume)... 8
Table 2.4 Switching rate Gas 2006/2007 (by metering point)... 9
Table 2.5 Existence of price controls ... 10
Figure 2.6 Eurobarometer survey FL243 on consumer perception on switching ... 11
Figure 2.7 Eurobarometer survey FL243 on consumer perception on change of
electricity prices ... 11
Figure 2.8 Eurobarometer survey FL243 on consumer perception on change of gas
prices ... 12
3.
ELECTRICITY MARKET IDICIATORS ... 13
Table 3.1 Degree of concentration... 13
Table 3.2 Wholesale Market Position Electricity – 2006/2007 ... 14
Table 3.3 Spot traded volumes as percentage of national electricity consumption ... 15
Table 3.4 Retail Market position Electricity – 2006/2007 ... 16
4.
GAS MARKET IDICIATORS... 17
Table 4.1 Market Structure in Import and Production of Gas ... 17
Table 4.2 Structure of Gas retail market ... 18
5.
PRICE DEVELOPMETS ... 19
Figure 5.1 Electricity prices for household consumers (2008 s01) in €/100kWh ... 19
Figure 5.2 Electricity prices for household consumers (2008 s01) in PPP ... 19
Figure 5.3 Electricity prices for industrial consumers (2008 s01)... 20
Figure 5.4 Gas prices for household consumers (2008 s01) in €/GJ... 20
Figure 5.5 Gas prices for household consumers (2008 s01) in PPP ... 21
Table 5.8 Increase in electricity prices for industrial consumers 2007 s02 – 2008 s1 ... 24
Table 5.9 Increase gas prices household consumers 2007 s02 – 2008 s1... 27
Figure 5.10 % increase gas household consumers... 28
Table 5.11 Increase in gas prices for industrial consumers 2007 s02 – 2008 s1... 29
Figure 5.12 Increase in gas prices for industrial consumers 2007 s02 – 2008 s01 ... 31
Table 5.13 Overview % increases of end prices 2007 s02 – 2008 s01 per Member State. 32
6.
ETWORK ACCESS ... 33
Table 6.1 etwork Access: Electricity 2007 ... 33
Table 6.2 Composition of electricity prices 2007 ... 35
Table 6.3 Access Conditions to Gas Transmission networks... 36
Table 6.4 Regulated companies and access charges: Gas ... 38
7.
UBUDLIG... 39
Table 7.1 Unbundling of etwork Operators: Electricity Transmission ... 39
Table 7.2 Unbundling of DSO in Electricity ... 40
Table 7.3 Unbundling of etwork Operators: Gas Transmission ... 41
Table 7.4 Unbundling of etwork Operators: Gas Distribution ... 42
8.
SUPPLY – DEMAD BALACE ... 43
Table 8.1 Electricity generation 2007 ... 43
Table 8.2 Gas Security of Supply ... 44
Table 8.3 Production of natural gas in EU and orway (2007) ... 45
1.
LEGAL
IMPLEMETATIO
Table 1.1 Market opening gas & electricity: Proportion of market open to competition
Eligible consumption ThW/ GWh by annual consumption in the country
% Market opening
Electricity Gas
2006 2007 2006 2007
Austria 100 100 100 100
Belgium 87,4 100 90,3 100
Bulgaria 60 100
Cyprus 3 30,8 31,8 NAP NAP
Czech Republic 100 100 69,2 100
Denmark 100 100 100 100
Estonia 13 13 95 100
Finland 100 100 0 0
France 69 100 73 100
Germany 100 100 100 100
Greece 70 90,1 70 73,5
Hungary 37,09 22,29 10,35 24,96
Ireland 100 100 100 100
Italy 73 100 100 100
Latvia 76 100 NAP 4 NAP
Lithuania 5 74 74 81 100
Luxembourg 84 100 79 100
Malta 6 NAP NAP NAP NAP
Netherlands 100 100 100 100
Poland 80 100 71 100
Portugal 100 100 0 42,9 7
Slovakia 80 100 72 100
Slovenia 75 100 90 100
Spain 100 100 100 100
Sweden 100 100 100 100
United Kingdom 100 100 100 100
3
No developed gas market. 4
Derogation until 2010. 5
Derogation until 2010. 6
2.
CUSTOMER
DIMESIO
Table 2.1 Increase in Annual Switching Rate Electricity 2006/2007 (by volume)
whole retail market large industry medium sized industry
small industry and households
2006 2007 ∆ 2006 2007 ∆ 2006 2007 ∆ 2006 2007 ∆
Austria NA NA 5,60% 7,30% 1,70% 1,80% 2,10% 0,30% 1,00% 1,50% 0,50%
Belgium NA NA NA NA NA NA NA NA
Bulgaria NA 48,60% NA 1,08% NA 0%
Cyprus 0% 0% 0% 0% 0% 0% 0% 0%
Czech Republic NA 0,80% 4% 6% 2% 3% 1,00% 0,10% 0,10%
Denmark 9,00% 13,70% 4,70% NA NA 15,20% 20,80% 5,60% 2,70% 6,40% 3,70%
Estonia 0% 0% NA 0% 0% 0% 0,00% 0% 0%
Finland NA NA NA NA NA NA NA NA
France NA NA NA NA NA NA NA NA
Germany 9,41% 10,03% 0,62% 14,15% 13,19% -0,96% 9,33% 9,71% 0,38% 2,55% 4,23% 1,68%
Greece NA 0% 0% 0% 0,00% 0% 0% 0,00% 0% 0% 0,00%
Hungary NA NA NA NA NA NA NA NA
Ireland NA NA NA NA NA NA NA NA
Italy NA 4,60% NA 1,20% NA 7,00% NA 4,00%
Latvia 0% 1% 0% 0% 0,00% 0% 2% 2,00% 0% 0% 0,00%
Lithuania 0% 0% 0% 0% 0,00% 0% 0% 0,00% 0% 0% 0,00%
Luxembourg NA 15% 10,90% 29,10% 18,20% 0,70% 0,40% -0,30% 0% 0,18% 0,18%
Malta
Norway NA NA NA NA NA NA NA NA
Poland 7,60% 7,80% 0,20% 15,84% 16,95% 1,11% 0,01% 0,13% 0,12% 0% 0,00% 0,00%
Portugal NA 7,20% 5,50% 0,00% -5,50% 55,70% 14,10% -41,60% 4,10% 5,20% 1,10%
Romania NA NA NA 6,22% NA 7,13% NAP % 0,93%
Slovak Republic NA 2% NA NA NA 0% 0% 0%
Slovenia 0,10% 3,60% 3,50% 0% 0% 0,00% 1,18% 6,50% 5,32% 1,46% 4,50% 3,04%
Spain 10% 10% 0,00% 9% 10% 1,00% 20% 22% 2,00% 5% 3% -2,00%
Sweden 9,20% 9,10% -0,10% 9,60% 8,70% -0,90% 9,60% 8,70% -0,90% 9,80% 10,40% 0,60%
Source: Regulators data
Table 2.2 Increase in Annual Switching Rate Electricity 2006/2007 (by eligible point)
whole retail market large industry medium sized industry
small industry and households
2006 2007 ∆ 2006 2007 ∆ 2006 2007 ∆ 2006 2007 ∆
Austria NA NA 7,60% 9,50% 1,90% 1,60% 2,10% 0,50% 1,00% 1,50% 0,50%
Belgium NA 10,10% 0% 1% 1,00% NA NA NA NA
Bulgaria NA 0,00% NA 35% NA 0,01% NA 0%
Cyprus 0% 0% 0% 0% 0,00% 0% 0% 0,00% 0% 0% 0,00%
Czech Republic NA 0,80% 4% 6% 2,00% 2% 3% 1,00% 0,20% 0,80% 0,60%
Denmark 1,40% 3,00% 1,60% NA % 11,50% 20,70% 9,20% 1,20% 2,80% 1,60%
Estonia 0% 0% 0,00% 10% 0% -10,00% 0% 0% 0,00% 0% 0% 0,00%
Finland 4,20% 4,00% -0,20% NA NA NA NA NA NA
France NA 0,40% NA 1,20% NA 0,03% NA 2,20%
Germany NA 3,36% NA 5,49% NA 4,65% NA 3,18%
Greece 0% 0% 0,00% NA NA NA NA NA NA
Hungary NA NA NA NA NA NA NA NA
Ireland NA NA NA NA NA NA NA 0,40%
Italy NA 1,90% NA 28,20% NA 22,60% NA 1,90%
Latvia 0% 1% 1,00% 0% 0% 0,00% 0% 3% 3,00% 0% 0% 0,00%
Lithuania 0% 0% 0,00% 0% 0% 0,00% 0% 0% 0,00% 0% 0% 0,00%
Luxembourg NA 0,20% 3,14% 11,44% 8,30% 0,10% 0,19% 0,09% 0% 0,19% 0,19%
Malta
Norway 11,80% 8,52% -3,28% NA NA 8,20% 7,57% -0,63% 11,90% 8,63% -3,27%
Poland NA NA 1,89% NA 0,24% NA 0,00% NA
Portugal 0,40% 2,20% 1,80% 13,20% 0% -13,20% 16,50% 3,90% -12,60% 0,40% 2,20% 1,80%
Romania NA NA NA 4,42% NA 3,15% NA 0,07%
Slovak Republic NA 2% 2% 2% 0,00% 0% 0% 0,00% 0% 0% 0,00%
Slovenia 2,20% 0,40% -1,80% 0% 0% 0,00% 4,70% 10,40% 5,70% 0,20% 0,40% 0,20%
Spain 3% 2% -1,00% 17% 18% 1,00% 8% 7% -1,00% 3% 2% -1,00%
Sweden 7,70% 10% 2,30% 8% 10,30% 2,30% 8% 10,30% 2,30% 7,80% 9,50% 1,70%
The Netherlands NA NA NA NA NA NA 5,60% 8,50% 2,90%
Table 2.3 Annual Switching Rate Gas 2006/2007 (by volume)
whole retail market large industry medium sized industry
small industry and households
2006 2007 ∆ 2006 2007 ∆ 2006 2007 ∆ 2006 2007 ∆
Austria NA NA 3,40% 4,40% 1,00% 1,10% 1,30% 0,20% 0,50% 0,50% 0,00%
Belgium NA NA NA NA NA NA NA NA
Bulgaria
Cyprus NA NA NA NA NA NA NA NA
Czech Republic NA NA NA NA NA NA NA NA
Denmark 22% 29% 7,00% NA NA NA 35% NA 4,00%
Estonia NA NA 0% 0% 0% 0% 0% NA
Finland NA NA NA NA NA NA NA NA
France NA NA NA NA NA NA NA NA
Germany 1,25% 3,79% 2,54% 2,82% 4,76% 1,94% 0,41% 3,88% 3,47% 0,04% 1,23% 1,19%
Greece 0% 0% 0% 0% 0% 0% 0% 0%
Hungary 3% 8,10% 5,10% 86% 88% 2,00% 40% 46% 6,00% 1% 4,80% 3,80%
Ireland NA NA NA NA NA NA NA NA
Italy NA NA 7% NA 4% 4,70% 0,70% 1% 1%
Latvia 0% 0% 0% 0% 0% 0% 0% 0%
Lithuania 0% 0% 0% 0% 0% 0% 0% 0%
Luxembourg NA NA 0% 0% 0% 0% 0% 0,00%
Malta
Norway
Poland 0% 0% 0% 0% 0% 0% 0% 0%
Portugal NA 0% NA NA NA NA NA NA
Romania NA NA NA NA NA NA NA NA
Slovak Republic NA NA 0% % 0% 0% 0% NA
Slovenia 0% 0% 0,00 0% 0% 0% 0% 0% 0%
Spain 25% 20% -5,00% 25% 20% -5,00% 25% 20% -5,00% 14% 15% 1,00%
Sweden NA NA NA NA NA NA NA NA
The Netherlands NA NA NA NA NA NA NA NA
United Kingdom NA NA NA NA NA NA NA NA
Table 2.4 Switching rate Gas 2006/2007 (by metering point)
whole retail market large industry medium sized industry
small industry and households
2006 2007 ∆ 2006 2007 ∆ 2006 2007 ∆ 2006 2007 ∆
Austria 0,50% 0,60% 0,10% 7,40% 3,80% -3,60% 0,50% 0,90% 0,40% 0,60% 0,50% -0,10%
Belgium NA 9,66% NA NA 5,50% NA 5,44% NA
Bulgaria
Cyprus NA NA NA NA NA NA NA NA
Czech Republic NA NA 0,10% 5,28% 5,18% 0,30% 0,11% -0,19% 0% 0%
Denmark 1,50% 0,90% -0,60% NA NA NA 14,00% NA 0,90%
Estonia NA NA 0% 0% 0,00% 0% 0% 0% NA
Finland NA NA NA NA NA NA NA NA
France NA NA NA NA NA NA NA 0,50%
Germany NA 1,01% NA 4,20% NA 0,85% NA 1,01%
Greece 0% 0% 0% 0% 0% 0% 0% 0%
Hungary NA NA NA NA NA NA NA NA
Ireland NA NA NA NA NA NA NA NA
Italy 1,60% 0,80% -0,80% 3,50% 5,40% 1,90% 3,30% 4,20% 0,90% 0,70% 0,70% 0,00%
Latvia 0% 0% 0% 0% 0% 0% 0% 0%
Lithuania 0% 0% 0% 0% 0% 0% 0% 0%
Luxembourg NA NA 0% 0% 0% 0% 0% 0,00%
Malta
Norway
Poland 0% 0% 0% 0% 0% 0% 0% 0%
Portugal NA 0,00% NA NA NA NA NA NA
Romania NA NA NA NA NA NA NA NA
Slovak Republic NA 0% 0% 0% 0% NA 0% NA
Slovenia 0% 0% 0% % 0% 0% 0,00% 0% 0% 0,00%
Spain 4% 5% 1,00% 25% 20% -5,00% 25% 20% -5,00% 7% 5% -2,00%
Sweden NA NA NA NA NA NA NA NA
The Netherlands NA NA NA NA NA NA 5,10% 8,30% 3,20%
United Kingdom NA NA NA NA NA NA 18,20% 18,40% 0,20%
Table 2.5 Existence of price controls
Electricity
Gas
Regulated tariffs - industrial users
Regulated tariffs - small commercial
users
Regulated tariffs - households
Regulated tariffs - industrial users
Regulated tariffs - small commercial
users
Regulated tariffs - households
Austria N N N N N N
Belgium N N Y N N Y
Bulgaria Y Y Y Y Y Y
Cyprus Y Y Y
Czech Rep. N N Y N Y Y
Denmark Y Y Y Y Y Y
Estonia Y Y Y N N Y
Finland N N Y
France Y Y Y Y Y Y
Germany N N N N N N
Greece Y Y Y
Hungary Y Y Y Y Y Y
Ireland Y Y Y Y Y Y
Italy Y Y Y N N Y
Latvia Y Y Y Y Y Y
Lithuania Y Y Y N Y Y
Luxembourg N N Y N N N
Malta Y Y Y
Netherlands N N N N N N
Norway N N N
Poland Y Y Y Y Y Y
Portugal Y Y Y Y Y Y
Romania Y Y Y Y Y Y
Slovakia N N Y N N Y
Slovenia N N Y N Y Y
Spain Y Y Y Y Y Y
Sweden N N N N N N
Figure 2.6 Eurobarometer survey FL243 on consumer perception on switching
8Electricity
Gas
(total)
Usage
100%
69%
Comparison of offers: very & fairly difficult
29%
28%
Consumers who switched
9%
7%
Consumers who got a cheaper price after
switching (low sample size!)
69%
69%
Did not switch (because): "current provider
offers the best value for money"
26%
27%
Did not switch (because): "no alternative local
provider"
19%
19%
Switching facilitators: cost free switching
27%
27%
Switching facilitators: "standardized
comparable offers from providers"
27%
26%
Switching facilitators: "a website that tells
which provider is the cheapest for you"
24%
24%
Recent changes in prices: increases
59%
64%
Figure 2.7 Eurobarometer survey FL243 on consumer perception on change of electricity
prices
Change in the price of the services in the last 12 months
Electricity supply provider
94 89
80 7 8 7 7 7 6 7 6 7 4
68 67 66 63 62 61 60
5 9 5 8 5 6 5 4 5 4 52 5 0 49 48 43 42
36 24
0 0
0 1
0 0 1 1
2 3 2
1 2 2 2 4
0 1 3
3 3 1 0 7 9
7 5 6 5 2 3 1 0 7
2 6 1 0 9 1 7 1 3 1 7
1 8 21 22 23 21 31
21 20 24 27 26 22 25
27 34 26 33 2 1 4 3 2 3
4 4 4
2 4 7 7 5 5 6 5
1 1 8 1 1 6 7
8 9 9 7
1 4 23
3 7 5
1 2
20 1 4 1 0 1 2 9 1 5 1 1 1 2
8 1 0 1 0 1 0 6 1 2 1 4 8 1 2 8 1 4 9 1 5 1 2 1 8 1 5
0 2 0 4 0 6 0 8 0 1 0 0
L
V
H
U PL
M T C Y B G R
O EL
P T C Z IT E E S K E S IE E U 2 7 L
T SI
F I L U F R U K B E D E N L A T S E D K DK/NA
Could not tell if the price of the service changed The price of the service remained the same They reduced the price
They increased the price
Q6. Which of the following has your present electricity supply provider done in the last 12 months?
Base: who use this service provider, % by country
Figure 2.8 Eurobarometer survey FL243 on consumer perception on change of gas prices
Change in the price of the services in the last 12 months
Gas supply provider
94 88
82 80 7 8 7 5 7 4 7 4 7 3 7 0 67 66 64
63 62 62 62 5 9 5 6
5 2 52 5 0 48 48 46
29 26 1 4
0 0
0 1
2 1 2
0 3 6
1 2 3 3 2 3 2
2 5
1 9 1 3 3
5
6 2
1
1 8
4 1 3 9 1 1 1 6
7 1 4 1 4 1 5 1 9 1 9 22 21 20 23 23
1 9 21
27
33 32
1 7 26
1 4 33
22
1 1 4
4
5 5 3
2 2 6
7 3 5 5 6 8 8 5 1 0
1 2 7 5 7 1 1 1 0 9 28 24
3 3 1 0 2 6
9 5
1 7 7
4 1 0 1 0 8 8 8 6 5 1 0 1 0
1 5 6 1 2 9 21 1 3
41 1 2 39 0 2 0 4 0 6 0 8 0 1 0 0
H
U LV
C
Y PL
L
T
B
G PT
R
O CZ
E E L U IT E U 2 7 F
R ES
D
E SK IE
B
E SI
U K M T A T E L N L S E D
K FI
DK/NA
Could not tell if the price of the service changed The price of the service remained the same They reduced the price
They increased the price
Q6. Which of the following has your present gas supply provider done in the last 12 months?
3.
ELECTRICITY
MARKET
IDICIATORS
Table 3.1 Degree of concentration
Electricity (generation)
Very highly concentrated
[HHI above 5000]
BE, DK, EE, FR, GR, IE, LV, LX, ML, PT, SK, SL
Highly concentrated
[HHI 1800-5000]
CZ, DE, ES, IT, LT
Moderately concentrated
[HHI 750-1800]
AT, CY, FI, HU, PL, UK, NL, SW
Source: regulators’ submissions, DG TREN calculations
Table 3.2 Wholesale Market Position Electricity – 2006/2007
Number of companies with more than 5 % share
of generation capacity (%)
Share of 3 biggest
companies (%) HHI
2006 2007
E
2006 2007E
2006 2007E
Austria 5 5 0 52,2 52 -0,2 1575 NA
Belgium 2 2 0 93 99,9 6,9 6500 8390 1890
Bulgaria 6 6 0 56,4 56,4 0 NA NA
Cyprus 1 1 0 100 100 0 0
Czech Republic 1 1 0 73,54 76,85 3,31 NA NA
Denmark 2 2 0 75 75 0 NA NA
Estonia 1 1 0 99 99 0 NAP NAP
Finland 4 4 0 67 68 1 NA NA
France 1 1 0 93 93 0 7589 6960 -629
Germany 5 4 -1 68,52 85,4 16,88 NA NA
Greece 1 1 0 99 NA NA 1000
Hungary 6 5 -1 67 67 0 1825 2119 294
Ireland 4 72 4773
Italy 5 5 0 66,3 61,2 -5,1 2265 2126 -139
Latvia 1 1 0 95 93 -2 8110 8110 0
Lithuania 3 3 0 84 84 0 3285 3160 -125
Luxembourg 3 3 0 74,8 80 5,2 4020 5843 1823
Malta
Norway 5 6 1 43,7 40 -3,7 1997 NA
Poland 6 5 -1 62,8 50,9 -11,9 1789 1312,7 -476,3
Portugal 3 2 -1 75 72,5 -2,5 4612 4472 -140
Romania 5 5 0 65,1 63,7 -1,4 1890 1813 -77
Slovak Republic 1 1 0 84,8 85,2 0,4 7207 NA
Slovenia 3 3 0 89,8 92,7 2,9 5224 7208 1984
Spain 4 5 1 60,3 76 15,7 1843 2269 426
Sweden 3 3 0 79 78 -1 880 NA
The Netherlands 4 6 2 62 61 -1 1604 1592 -12
United Kingdom 6 8 2 37,5 41 3,5 938 986 48
Table 3.3 Spot traded volumes as percentage of national electricity consumption
Sorted by 2007 % volume of consumption
Source: Regulators data
∆ Calculation by DG TREN
Notes:
BE: In 2007, 7,6 TWh was traded on Belpex DAM (which is about 8,5% of the Belgian consumption). The bought volume amounts to 6,8 TWh, whereas the sold volume is 4,9 TWh. These figures differ because Belpex DAM is coupled with Powernext and APX.
BG: There is no power exchange - spot in Bulgaria.
DK: Total trade on Nord Pool in physical spot market in 2004: 167 TWh. Denmark contributes with 19,2 TWh corresponding to 11,5% of the total. Total trade on Nord Pool in physical spot market in 2005: 176 TWh. Denmark contributes with 25,7 TWh corresponding to 14,6% of the total. Total trade on Nord Pool in physical spot market in 2006: 250 TWh. Denmark contributes with 34,4 TWh corresponding to 13,8% of the total. Total trade on Nord Pool in physical spot market in 2007: 291 TWh. Denmark contributes with 35,4 TWh corresponding to 12,2% of the total.
FI: Not relevant due to Nordic markets. FR: Source: Powernext Day-ahead.
DE: 2006: Day-ahead spot market for the market area of Germany/Austria; 2007: Day-ahead spot market for the market area of Germany/ Austria 117,93 TWh; market area Switzerland 4,33 TWh; source: EEX.
GR: Calculated as the sum of generated energy plus imports. HU: There is no power exchange in Hungary.
IE: The Single Electricity Market for the island of Ireland is a gross mandatory pool, therefore all energy goes through the pool. The market started on the 1st November 2007 and the above figure represents energy for 2 months.
LU: No power exchange in Luxembourg.
PT: Only the period 2008/07/01-2008/12/31; Includes day-ahead and intraday demand.
ES: Besides, in 2006, 104 TWh were negotiated in bilateral contracts out of the PX spot market, and 59 TWh were cleared at the PX over the counter. The amount of bilateral contracts negotiated out of the PX (104 TWh) was a temporary consequence of the (already revoked) Royal Decree Law 3/2006 (see National Report 2007).
SE: The values show the total purchased volume in the Swedish Elspot Bid Area. consumption
(TWh)
electr traded (PX
- spot) TWh volume % of consumption
Number of traders active at PX
2006 2007 2006 2007 2006 2007 ∆ 2006 2007 ∆
Greece 54,6 55,25 56,1 58,4 102,75 105,70 2,88 24 27 3
Denmark 35,8 35,7 34,4 35,4 96,09 99,16 3,20 NA 9 NAP
Sweden 157,8 157,4 110,8 134,3 70,22 85,32 21,52 NA 150 NAP
Spain 268 276,3 139,1 221,2 51,90 80,06 54,25 22 25 3
Italy 337,5 339,9 196,5 221,3 58,22 65,11 11,83 80 89 9
Finland 90 90,3 37,8 41,4 42,00 45,85 9,16 NAP NAP NAP
Portugal 49,2 50,05 0 21,839 0,00 43,63 NAP NA 2 NAP
Lithuania 8,9 9,1 1,68 2 18,88 21,98 16,43 5 5 0
Germany 567 569,2 88,46 122,26 15,60 21,48 37,68 161 192 31
The
Netherlands 112 112 19,2 20,7 17,14 18,48 7,81 NA NA NAP
Romania 53,02 54,126 4,106 5,043 7,74 9,32 20,31 NA 99 NAP
France 478,4 480,3 29,6 44,2 6,19 9,20 48,73 74 68 -6
Belgium 89,9 90,109 0,532 7,6 0,59 8,43 1325,26 NA 24 NAP
UK 352,82 350,08 15,26 16,5 4,33 4,71 8,97 51 60 9
Austria 61,952 61,744 1,67 2,3 2,70 3,73 38,19 37 40 3
Poland 149,8 154,2 1,67 2,46 1,11 1,60 43,10 NA NA NAP
Table 3.4 Retail Market position Electricity – 2006/2007
Number of independent suppliers (%)
Companies with market share over 5% (%)
Market share of three largest companies in whole retail market (%)
2006 2007
E
2006 2007E
2006 2007E
Austria 3 3 0 7 7 0 80 80 0
Belgium 18 18 0 3 4 1 NA NA
Bulgaria 4 4 0 3 3 0 97,5 97,5 0
Cyprus 0 0 0 1 1 0 100 100 0
Czech Republic 285 282 -3 3 3 0 NA 99
Denmark 5 9 4 8 7 -1 NA NA
Estonia 3 3 0 1 1 0 99 99 0
Finland 5 5 0 4 4 0 40 40 0
France 17 18 1 1 1 0 NA 94
Germany NA NA 3 3 0 45,7 46,1 0,4
Greece 24 25 1 1 1 0 100 100 0
Hungary 11 12 1 4 4 0 85,57 87,18 1,61
Ireland 7 7 0 4 4 0 85 85 0
Italy 213 NA 4 3 -1 26,9 60 33,1
Latvia 8 8 0 1 1 0 100 97 -3
Lithuania 17 18 1 1 1 0 100 100 0
Luxembourg 2 3 1 4 3 -1 NA 93
Malta
Norway 5 5 0 5 5 0 35,7 31,2 -4,5
Poland 21 27 6 6 6 0 NA 44,9
Portugal 3 3 0 3 2 -1 98,5 99,6 1,1
Romania 140 117 -23 5 5 0 43 44 1
Slovak Republic 140 151 11 3 3 0 NA 35
Slovenia 8 14 6 6 7 1 71 68 -3
Spain 12 24 12 5 4 -1 67,5 83,9 16,4
Sweden 10 10 0 3 3 0 49,8 NA
The Netherlands 20 22 2 4 4 0 NA NA
United Kingdom 16 21 5 6 6 0 NA NA
4.
GAS
MARKET
IDICIATORS
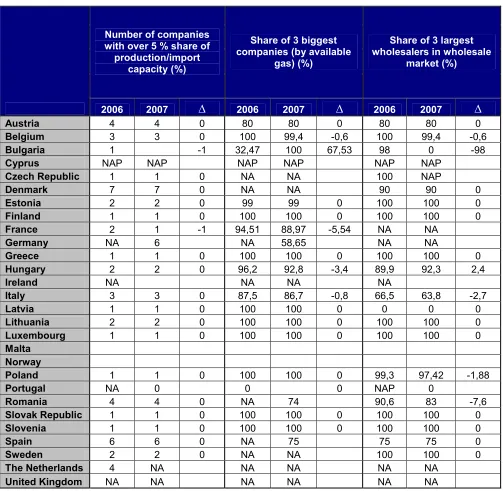
Table 4.1 Market Structure in Import and Production of Gas
Number of companies with over 5 % share of
production/import capacity (%)
Share of 3 biggest companies (by available
gas) (%)
Share of 3 largest wholesalers in wholesale
market (%)
2006 2007
E
2006 2007E
2006 2007E
Austria 4 4 0 80 80 0 80 80 0
Belgium 3 3 0 100 99,4 -0,6 100 99,4 -0,6
Bulgaria 1 -1 32,47 100 67,53 98 0 -98
Cyprus NAP NAP NAP NAP NAP NAP
Czech Republic 1 1 0 NA NA 100 NAP
Denmark 7 7 0 NA NA 90 90 0
Estonia 2 2 0 99 99 0 100 100 0
Finland 1 1 0 100 100 0 100 100 0
France 2 1 -1 94,51 88,97 -5,54 NA NA
Germany NA 6 NA 58,65 NA NA
Greece 1 1 0 100 100 0 100 100 0
Hungary 2 2 0 96,2 92,8 -3,4 89,9 92,3 2,4
Ireland NA NA NA NA
Italy 3 3 0 87,5 86,7 -0,8 66,5 63,8 -2,7
Latvia 1 1 0 100 100 0 0 0 0
Lithuania 2 2 0 100 100 0 100 100 0
Luxembourg 1 1 0 100 100 0 100 100 0
Malta
Norway
Poland 1 1 0 100 100 0 99,3 97,42 -1,88
Portugal NA 0 0 0 NAP 0
Romania 4 4 0 NA 74 90,6 83 -7,6
Slovak Republic 1 1 0 100 100 0 100 100 0
Slovenia 1 1 0 100 100 0 100 100 0
Spain 6 6 0 NA 75 75 75 0
Sweden 2 2 0 NA NA 100 100 0
The Netherlands 4 NA NA NA NA NA
United Kingdom NA NA NA NA NA NA
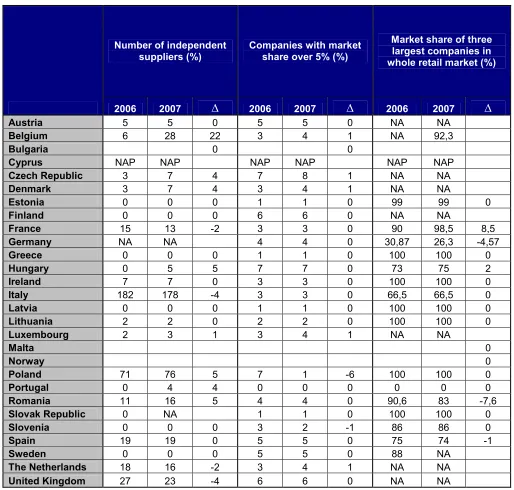
Table 4.2 Structure of Gas retail market
Number of independent suppliers (%)
Companies with market share over 5% (%)
Market share of three largest companies in whole retail market (%)
2006 2007
E
2006 2007E
2006 2007E
Austria 5 5 0 5 5 0 NA NA
Belgium 6 28 22 3 4 1 NA 92,3
Bulgaria 0 0
Cyprus NAP NAP NAP NAP NAP NAP
Czech Republic 3 7 4 7 8 1 NA NA
Denmark 3 7 4 3 4 1 NA NA
Estonia 0 0 0 1 1 0 99 99 0
Finland 0 0 0 6 6 0 NA NA
France 15 13 -2 3 3 0 90 98,5 8,5
Germany NA NA 4 4 0 30,87 26,3 -4,57
Greece 0 0 0 1 1 0 100 100 0
Hungary 0 5 5 7 7 0 73 75 2
Ireland 7 7 0 3 3 0 100 100 0
Italy 182 178 -4 3 3 0 66,5 66,5 0
Latvia 0 0 0 1 1 0 100 100 0
Lithuania 2 2 0 2 2 0 100 100 0
Luxembourg 2 3 1 3 4 1 NA NA
Malta 0
Norway 0
Poland 71 76 5 7 1 -6 100 100 0
Portugal 0 4 4 0 0 0 0 0 0
Romania 11 16 5 4 4 0 90,6 83 -7,6
Slovak Republic 0 NA 1 1 0 100 100 0
Slovenia 0 0 0 3 2 -1 86 86 0
Spain 19 19 0 5 5 0 75 74 -1
Sweden 0 0 0 5 5 0 88 NA
The Netherlands 18 16 -2 3 4 1 NA NA
United Kingdom 27 23 -4 6 6 0 NA NA
5.
PRICE
DEVELOPMETS
Figure 5.1 Electricity prices for household consumers (2008 s01) in €/100kWh
90 5 10 15 20 25 30
B G EE LV LT HR M T EL RO SI FR FI P L CZ ES SK UK P T HU LU EU27 NO SE EA 15 NL IE A T CY B E DE DK
in
€
/
1
0
0
k
W
h
Without tax Other taxes VAT
Source: Eurostat
Figure 5.2 Electricity prices for household consumers (2008 s01) in PPP
0 5 10 15 20 25 30
FI FR NO EE EL LV UK LT MT LU SI SE HR ES IE NL BG AT PT BE RO CZ PL DK CY DE SK HU
in
P
P
S
/
1
0
0
k
W
h
Electricity prices in PPS
[image:20.595.61.507.441.693.2]Figure 5.3 Electricity prices for industrial consumers (2008 s01)
100 2 4 6 8 10 12 14 16
BG EE FI FR LV SE HR NO LT EL PL RO P T DK SI ES UK NL EU27 LU EA 15 DE A T B E CZ HU SK M T IE CY
in
€
/
1
0
0
k
W
h
Without tax Non recoverable taxes
[image:21.595.60.514.405.698.2]Source: Eurostat
Figure 5.4 Gas prices for household consumers (2008 s01) in €/GJ
110 5 10 15 20 25 30
HR LV LT RO EE BG UK HU PL SK CZ FR IE EU27 SI ES BE LU PT IT EA15 DE NL AT SE
in
€
p
e
r
G
J
Without tax Other taxes VAT
Source: Eurostat
Figure 5.5 Gas prices for household consumers (2008 s01) in PPP
0 5 10 15 20 25
UK HR LV IE FR EE LT BE LU RO IT HU PL DE ES CZ NL SK SI PT AT BG SE
in
P
P
S
p
e
r
G
J
Gas prices in PPS
Figure 5.6 Gas prices for industrial consumers (2008 s01)
120 2 4 6 8 10 12 14 16
BG HR EE ES UK RO FI LV PL PT LT CZ BE FR SK IT EU27 NL HU EA15 SI IE LU DE SE
in
€
p
e
r
G
J
Without tax Non recoverable taxes
Source: Eurostat
[image:22.595.58.526.333.701.2]Table 5.7 Increase electricity price household consumers 2007 s02 – 2008 s1
(Prices in €/kWh, end prices without taxes) – sorted by " %
Band DC : 2 500 kWh < Consumption < 5 000 kWh
Band DD : 5 000 kWh < Consumption < 15 000 kWh
2007s02 2008s01 ∆ % 2007s02 2008s01 ∆ %
Poland 0,1069 0,0965 -9,73 Portugal 0,1422 0,1264 -11,11 Ireland 0,169 0,1559 -7,75 Romania 0,0961 0,087 -9,47 Romania 0,0954 0,0885 -7,23 Ireland 0,1527 0,1385 -9,30 Portugal 0,1486 0,141 -5,11 Spain 0,1058 0,1021 -3,50 Spain 0,1152 0,1124 -2,43 Estonia 0,0626 0,0607 -3,04 Estonia 0,0652 0,0639 -1,99 Lithuania 0,0701 0,0685 -2,28 Bulgaria 0,0603 0,0593 -1,66 Germany 0,1187 0,1176 -0,93 Netherlands 0,129 0,127 -1,55 Bulgaria 0,0593 0,0588 -0,84 United Kingdom 0,1411 0,1394 -1,20 France 0,0792 0,0792 0,00 Lithuania 0,0737 0,0729 -1,09 Luxembourg 0,1306 0,1306 0,00 France 0,0914 0,0914 0,00 Malta 0,1246 0,1246 0,00 Luxembourg 0,1421 0,1421 0,00 Austria 0,1175 0,118 0,43 Malta 0,0945 0,0945 0,00 Netherlands 0,119 0,12 0,84 Austria 0,1255 0,1271 1,27 Euro area 0,1097 0,1108 1,00 Germany 0,1279 0,1299 1,56 United Kingdom 0,1277 0,129 1,02 European Union 0,1189 0,1211 1,85 Sweden 0,0899 0,0913 1,56 Euro area 0,1196 0,1219 1,92 European Union 0,108 0,1101 1,94 Slovakia 0,1152 0,1194 3,65 Greece 0,11 0,1139 3,55 Finland 0,0868 0,0915 5,41 Finland 0,0739 0,0779 5,41 Slovenia 0,0861 0,0911 5,81 Slovenia 0,0798 0,0849 6,39 Greece 0,09 0,0957 6,33 Poland 0,0793 0,0852 7,44 Sweden 0,1013 0,1085 7,11 Slovakia 0,0922 0,1002 8,68 Cyprus 0,1348 0,1528 13,35 Cyprus 0,1352 0,1533 13,39 Latvia 0,0694 0,0802 15,56 Latvia 0,0686 0,0782 13,99 Belgium 0,1286 0,15 16,64 Belgium 0,1129 0,133 17,80 Denmark 0,1027 0,1203 17,14 Denmark 0,087 0,1036 19,08 Czech Republic 0,0895 0,106 18,44 Czech Republic 0,0719 0,0869 20,86 Hungary 0,0957 0,1277 33,44 Hungary 0,0987 0,1271 28,77
-15 -10 -5 0 5 10 15 20 25 30 35 40
pl ie ro pt es ee bg nl uk lt fr lu mt at de EU sk fi si gr se cy lv be dk cz hu
DC
DD
Table 5.8 Increase in electricity prices for industrial consumers 2007 s02 – 2008 s1
(Prices in €/kWh, end prices without taxes) – sorted by " %
Band IC : 500 MWh < Consumption < 2 000 MWh
Band ID : 2 000 MWh < Consumption < 20 000 MWh
2007s02 2008s01 ∆ % 2007s02 2008s01 ∆ %
United Kingdom 0,1033 0,0937 -9,29 United Kingdom 0,0906 0,0844 -6,84 Poland 0,0843 0,0814 -3,44 Bulgaria 0,0501 0,0491 -2,00 Romania 0,0908 0,0886 -2,42 Romania 0,079 0,0783 -0,89 Bulgaria 0,0562 0,0557 -0,89 Estonia 0,0435 0,0432 -0,69 Estonia 0,0518 0,0514 -0,77 Malta 0,0917 0,0918 0,11 Luxembourg 0,0999 0,0999 0,00 Spain 0,0794 0,0799 0,63 Malta 0,1221 0,1221 0,00 Cyprus 0,1261 0,1295 2,70 Netherlands 0,086 0,086 0,00 Denmark 0,0761 0,0783 2,89 Spain 0,0912 0,0915 0,33 Slovenia 0,0709 0,0742 4,65 Denmark 0,0765 0,0785 2,61 Sweden 0,0577 0,0614 6,41 Cyprus 0,1369 0,1405 2,63 European Union 0,0759 0,0809 6,59 Slovenia 0,0872 0,0904 3,67 Euro area 0,0758 0,0818 7,92 Germany 0,0894 0,0929 3,91 Germany 0,0776 0,0839 8,12 European Union 0,0865 0,0900 4,05 Finland 0,0538 0,0584 8,55 Ireland 0,1235 0,1302 5,43 Netherlands 0,079 0,086 8,86 Sweden 0,0651 0,0688 5,68 Greece 0,0673 0,0737 9,51 Euro area 0,0856 0,0909 6,19 Ireland 0,1086 0,1201 10,59 Finland 0,0563 0,0614 9,06 France 0,0468 0,0522 11,54 Greece 0,0789 0,0861 9,13 Lithuania 0,0627 0,0701 11,80 Latvia 0,0594 0,066 11,11 Hungary 0,0862 0,0977 13,34 Lithuania 0,0744 0,0829 11,42 Slovakia 0,0952 0,1083 13,76 France 0,0524 0,059 12,60 Belgium 0,0748 0,0856 14,44 Hungary 0,0997 0,1124 12,74 Portugal 0,0698 0,0807 15,62 Slovakia 0,1048 0,1197 14,22 Latvia 0,0499 0,0585 17,23 Portugal 0,0779 0,0895 14,89 Austria 0,0655 0,0768 17,25 Czech Republic 0,0946 0,1095 15,75 Czech Republic 0,0778 0,0913 17,35 Belgium 0,0853 0,0988 15,83 Poland 0,0626 0,0768 22,68 Austria 0,0774 0,0897 15,89
" % sorted on IC
-15
-10
-5
0
5
10
15
20
25
uk pl ro bg ee mt nl es dk cy si de EU ie se fi gr lv lt fr hu sk pt cz be at
IC
ID
Band IE : 20 000 MWh < Consumption < 70 000 MWh
Band IF : 70 000 MWh < Consumption < 150 000 MWh
2007s02 2008s01 ∆ % 2007s02 2008s01 ∆ %
Netherlands 0,08 0,075 -6,25 Bulgaria 0,0383 0,0348 -9,14 Bulgaria 0,0424 0,0404 -4,72 Slovenia 0,0645 0,0624 -3,26 United Kingdom 0,086 0,083 -3,49 Estonia 0,0332 0,0336 1,20 Malta 0,0581 0,0581 0,00 Austria 0,0599 0,0612 2,17 Slovenia 0,0616 0,0619 0,49 Denmark 0,0708 0,0734 3,67 Spain 0,0662 0,0682 3,02 United Kingdom 0,0824 0,0857 4,00 Denmark 0,0708 0,0734 3,67 Cyprus 0,1129 0,1201 6,38 Sweden 0,0521 0,0549 5,37 Germany 0,0722 0,0776 7,48 Austria 0,0653 0,0691 5,82 Spain 0,0528 0,0568 7,58 Estonia 0,0332 0,0353 6,33 Romania 0,0572 0,0617 7,87 Greece 0,0606 0,0654 7,92 Greece 0,0599 0,0649 8,35 European Union 0,0659 0,0711 7,89 Euro area 0,0617 0,0672 8,91 Euro area 0,065 0,0704 8,31 Sweden 0,0508 0,0555 9,25 Cyprus 0,1099 0,1196 8,83 European Union 0,0625 0,0685 9,60 Ireland 0,1094 0,1191 8,87 Netherlands 0,076 0,085 11,84 Germany 0,0724 0,0791 9,25 Lithuania 0,0556 0,063 13,31 Romania 0,0638 0,0699 9,56 France 0,0433 0,0502 15,94 Belgium 0,0662 0,0727 9,82 Finland 0,0417 0,0486 16,55 Slovakia 0,0848 0,0968 14,15 Belgium 0,0569 0,0666 17,05 France 0,0468 0,0536 14,53 Slovakia 0,0734 0,0881 20,03 Latvia 0,0447 0,052 16,33 Latvia 0,043 0,0519 20,70 Hungary 0,0723 0,0871 20,47 Portugal 0,0497 0,0605 21,73 Portugal 0,0562 0,0681 21,17 Czech Republic 0,0668 0,0825 23,50 Czech Republic 0,0668 0,081 21,26 Hungary 0,059 0,0758 28,47 Lithuania 0,0548 0,0668 21,90 Poland 0,0435 0,0611 40,46 Finland 0,0405 0,0502 23,95
Poland 0,047 0,0669 42,34
Source: Eurostat
Table 5.9 Increase gas prices household consumers 2007 s02 – 2008 s1
(Prices in €/Gigajoules, end prices without taxes) – sorted by ∆ %
Band D1 : Consumption < 20 GJ Band D2 : 20 GJ < Consumption < 200 GJ Band D3 : Consumption > 200 GJ
2007s02 2008s01 ∆ % 2007s02 2008s01 ∆ % 2007s02 2008s01 ∆ %
Ireland 26,5500 16,7600 -36,87 Ireland 14,8400 13,2900 -10,44 Romania 6,3162 5,9542 -5,73
Romania 6,3416 5,9454 -6,25 Romania 6,3128 5,9497 -5,75 Slovakia 9,5449 9,3427 -2,12
France 22,7400 22,1000 -2,81 Portugal 17,2663 16,5390 -4,21 Ireland 12,7800 12,6800 -0,78
Portugal 22,0424 21,4470 -2,70 Spain 13,9210 13,7770 -1,03 Sweden 14,1642 14,0684 -0,68
Sweden 18,5946 18,1747 -2,26 France 12,1800 12,2900 0,90 Spain 11,3850 11,4740 0,78
Italy 14,2640 13,9480 -2,22 Netherlands 11,7300 12,0090 2,38 Germany 11,9000 12,0900 1,60
Estonia 9,0856 8,9441 -1,56 Sweden 14,3798 14,7723 2,73 Netherlands 11,1810 11,4300 2,23
Netherlands 18,0770 18,2720 1,08 Slovakia 9,6748 9,9898 3,26 Euro area 11,1000 11,5439 4,00
Spain 16,6520 16,9400 1,73 Poland 9,1348 9,4774 3,75 France 10,6800 11,1200 4,12
European Union 15,3500 16,1292 5,08 European Union 11,1100 11,7139 5 Italy 10,1920 10,6650 4,64
Euro area 17,9200 18,5646 3,60 Germany 12,6800 13,3200 5,05 Portugal 14,1428 14,8560 5,04
Bulgaria 7,0968 7,4957 5,62 Euro area 12,1400 12,7896 5,35 Hungary 8,7367 9,2439 5,81
Poland 11,7421 12,6079 7,37 United Kingdom 9,4392 9,9662 5,58 Poland 8,3776 8,9132 6,39
Hungary 8,7996 9,5277 8,27 Hungary 8,8488 9,3641 5,82 European Union 10,1000 10,8458 7,38
United Kingdom 10,2289 11,1702 9,20 Italy 11,1380 12,0310 8,02 Slovenia 10,4400 11,2800 8,05
Slovenia 13,6700 14,9700 9,51 Bulgaria 7,4803 8,2012 9,64 Bulgaria 7,5979 8,3188 9,49
Germany 17,7200 19,6300 10,78 Slovenia 10,9900 12,1400 10,46 Latvia 7,2894 8,2462 13,13
Belgium 17,4400 19,4000 11,24 Latvia 7,3322 8,2749 12,86 Luxembourg 9,7800 11,5800 18,40
Latvia 7,8182 8,7616 12,07 Belgium 11,1400 13,0100 16,79 United Kingdom 8,1667 9,8036 20,04
Slovakia 18,9651 21,7052 14,45 Estonia 6,1748 7,3897 19,68 Estonia 6,1417 7,4274 20,93
Luxembourg 13,4900 15,8100 17,20 Czech Republic 8,4540 10,2536 21,29 Belgium 9,9700 12,2300 22,67
Czech Republic 12,6985 15,3379 20,79 Austria 12,3800 16,8100 35,78 Czech Republic 8,2922 10,2627 23,76
Austria 15,6700 20,1800 28,78 Lithuania 5,5245 7,7517 40,31 Austria 10,6800 13,6700 28,00
Lithuania 8,4740 11,9980 41,59 Luxembourg 9,7800 15,8100 61,66 Lithuania 4,8674 7,5519 55,15
Source: Eurostat
Figure 5.10 % increase gas household consumers
Sorted on D1
-60
-40
-20
0
20
40
60
80
ie ro fr pt se it ee nl es EU bg pl hu uk si de be lv sk lu cz at lt
D1
D2
D3
Table 5.11 Increase in gas prices for industrial consumers 2007 s02 – 2008 s1
(Prices in €/Gigajoules, end prices without taxes) – sorted by ∆ %
Band I1 : Consumption < 1 000 GJ
Band I2 : 1 000 GJ < Consumption < 10 000 GJ
Band I3 : 10 000 GJ < Consumption < 100 000 GJ
2007s02 2008s01 ∆ % 2007s02 2008s01 ∆ % 2007s02 2008s01 ∆ %
Romania 6,2820 5,9252 -5,68 Netherlands 9,8980 9,3760 -5,27 Netherlands 8,5130 8,1240 -4,57
France 11,4300 10,9000 -4,64 Romania 6,2656 5,9383 -5,22 Romania 6,4765 6,2327 -3,76
Ireland 12,5700 12,4400 -1,03 United Kingdom 8,5010 8,4525 -0,57 Latvia 7,7039 7,9026 2,58
United Kingdom 10,5420 10,5172 -0,24 Ireland 10,8300 10,8800 0,46 Portugal 8,1989 8,6900 5,99
Slovenia 11,2900 11,3900 0,89 Latvia 8,1041 8,1603 0,69 United Kingdom 6,8078 7,2911 7,10
Netherlands 10,9980 11,1850 1,70 Portugal 10,7838 11,0790 2,74 Spain 7,0740 7,6410 8,02
Spain 8,8440 9,1980 4,00 Slovenia 10,4500 10,7900 3,25 France 8,3400 9,0300 8,27
Poland 9,2210 9,6145 4,27 France 9,6100 9,9700 3,75 European Union 7,9600 8,7919 10,45
European Union 10,2300 10,8027 5,60 European Union 9 9,8392 8,12 Euro area 8,3500 9,2270 10,50
Euro area 10,5300 11,1460 5,85 Poland 8,4125 9,1280 8,51 Italy 7,8540 8,7740 11,71
Italy 9,3780 10,1390 8,11 Italy 9,3780 10,1920 8,68 Hungary 8,3506 9,3808 12,34
Slovakia 9,6829 10,5218 8,66 Euro area 9,46 10,3018 8,90 Ireland 9,7200 11,0500 13,68
Germany 11,8200 12,9200 9,31 Spain 7,3090 8,0340 9,92 Bulgaria 5,0159 5,7163 13,96
Latvia 7,2751 8,2033 12,76 Belgium 9,5000 10,6700 12,32 Germany 9,8600 11,2800 14,40
Bulgaria 5,5220 6,2430 13,06 Sweden 12,3856 14,1004 13,85 Slovenia 8,0500 9,3300 15,90
Sweden 14,0456 15,9776 13,76 Bulgaria 5,2817 6,0333 14,23 Poland 7,2150 8,3633 15,92
Portugal 12,7432 14,5860 14,46 Luxembourg 9,7800 11,3000 15,54 Belgium 7,7000 8,9800 16,62
Belgium 10,7600 12,6500 17,57 Slovakia 8,1519 9,4388 15,79 Sweden 10,6932 12,4898 16,80
Luxembourg 9,7800 11,5800 18,40 Germany 10,5400 12,2700 16,41 Slovakia 7,9429 9,2788 16,82
Czech Republic 8,0114 9,8667 23,16 Hungary 8,9082 10,6429 19,47 Finland 6,3000 7,4000 17,46
Hungary 9,6427 11,9263 23,68 Czech Republic 7,3497 9,0054 22,53 Luxembourg 9,2400 11,3000 22,29
Lithuania 7,0953 8,8922 25,33 Lithuania 6,7894 8,7971 29,57 Czech Republic 6,8169 8,5375 25,24
Estonia 5,8367 7,3969 26,73 Estonia 5,3766 7,3785 37,23 Lithuania 6,7598 8,7871 29,99
Estonia 5,0359 6,7774 34,58
Source: Eurostat
Band I4 : 100 000 GJ < Consumption < 1 000 000 GJ
Band I5 : 1 000 000 GJ < Consumption < 4 000 000 GJ
2007s02 2008s01 ∆ % 2007s02 2008s01 ∆ %
Romania 6,2618 5,7951 -7,45 Romania 5,8633 5,3363 -8,99
Netherlands 7,6370 7,8580 2,89 Latvia 7,2179 7,1152 -1,42
Latvia 7,4037 7,7881 5,19 Hungary 7,0790 7,1677 1,25
Hungary 6,8995 7,2884 5,64 Netherlands 7,1530 7,8090 9,17
Spain 6,6970 7,1370 6,57 Finland 5,7000 6,5000 14,04
France 7,2900 7,9200 8,64 France 6,8400 7,8600 14,91
Portugal 5,8430 6,5940 12,85 Portugal 5,4540 6,3230 15,93
Finland 6,2000 7,0000 12,90 Italy 6,9610 8,1690 17,35
European Union 6,9600 7,9091 13,64 Slovakia 7,0468 8,2814 17,52
Euro area 7,2600 8,2324 13,39 Poland 5,7945 6,8424 18,08
Italy 7,2240 8,2740 14,53 Bulgaria 4,4994 5,3226 18,30
Ireland 6,9100 8,0500 16,50 Spain 5,5350 6,6030 19,30
Slovakia 7,3624 8,5997 16,81 Belgium 7,1200 8,8100 23,74
Bulgaria 4,5710 5,4044 18,23 Germany 6,2700 7,7800 24,08
Poland 6,2805 7,4267 18,25 Czech Republic 6,1482 7,7089 25,38
United Kingdom 5,8912 6,9814 18,51 United Kingdom 5,2254 6,7362 28,91
Germany 7,7600 9,2700 19,46 Estonia 4,7103 6,1165 29,85
Sweden 9,3566 11,1992 19,69 Lithuania 5,2985 7,2647 37,11
Belgium 7,1100 8,6500 21,66
Czech Republic 6,3746 7,8922 23,81
Slovenia 6,7900 8,4100 23,86
Estonia 4,8171 6,1716 28,12
Figure 5.12 Increase in gas prices for industrial consumers 2007 s02 – 2008 s01
Sorted on I3
-10
-5
0
5
10
15
20
25
30
35
40
nl
ro
lv
pt
uk
es
fr
EU
it
hu
ie
bg
de
si
pl
be
se
sk
cz
lt
ee
I1
I2
I3
I4
Table 5.13 Overview % increases of end prices 2007 s02 – 2008 s01 per Member State
Household consumers Industrial consumers
electricity gas electricity gas
DC DD D1 D2 D3 IC ID I1 I2 I3 I4
Austria 1,27 0,43 28,78 35,78 28,00 Austria 15,89 17,25 na na na na
Belgium 16,64 17,80 11,24 16,79 22,67 Belgium 15,83 14,44 17,57 12,32 16,62 21,66
Bulgaria -1,66 -0,84 5,62 9,64 9,49 Bulgaria -0,89 -2,00 13,06 14,23 13,96 18,23
Czech Republic 18,44 20,86 20,79 21,29 23,76 Czech Republic 15,75 17,35 23,16 22,53 25,24 23,81
Cyprus 13,35 13,39 na na na Cyprus 2,63 2,70 na na na na
Denmark 17,14 19,08 na na na Denmark 2,61 2,89 na na na na
Estonia -1,99 -3,04 -1,56 19,68 20,93 Estonia -0,77 -0,69 26,73 37,23 34,58 28,12
Finland 5,41 5,41 na na na Finland 9,06 8,55 na na 17,46 12,90
France 0,00 0,00 -2,81 0,90 4,12 France 12,60 11,54 -4,64 3,75 8,27 8,64
Germany 1,56 -0,93 10,78 5,05 1,60 Germany 3,91 8,12 9,31 16,41 14,40 19,46
Greece 6,33 3,55 na na na Greece 9,13 9,51 na na na na
Hungary 33,44 28,77 8,27 5,82 5,81 Hungary 12,74 13,34 23,68 19,47 12,34 5,64
Ireland -7,75 -9,30 -36,87 -10,44 -0,78 Ireland 5,43 10,59 -1,03 0,46 13,68 16,50
Italy na na -2,22 8,02 4,64 Italy na na 8,11 8,68 11,71 14,53
Latvia 15,56 13,99 12,07 12,86 13,13 Latvia 11,11 17,23 12,76 0,69 2,58 5,19
Lithuania -1,09 -2,28 41,59 40,31 55,15 Lithuania 11,42 11,80 25,33 29,57 29,99 37,40
Luxemburg 0,00 0,00 17,20 61,66 18,40 Luxemburg 0,00 na 18,40 15,54 22,29 na
Malta 0,00 0,00 na na na Malta 0,00 0,11 na na na na
Netherlands -1,55 0,84 1,08 2,38 2,23 Netherlands 0,00 8,86 1,70 -5,27 -4,57 2,89
Poland -9,73 7,44 7,37 3,75 6,39 Poland -3,44 22,68 4,27 8,51 15,92 18,25
Portugal -5,11 -11,11 -2,70 -4,21 5,04 Portugal 14,89 15,62 14,46 2,74 5,99 12,85
Romania -7,23 -9,47 -6,25 -5,75 -5,73 Romania -2,42 -0,89 -5,68 -5,22 -3,76 -7,45
Slovakia 3,65 8,68 14,45 3,26 -2,12 Slovakia 14,22 13,76 8,66 15,79 16,82 16,81
Slovenia 5,81 6,39 9,51 10,46 8,05 Slovenia 3,67 4,65 0,89 3,25 15,90 23,86
Spain -2,43 -3,50 1,73 -1,03 0,78 Spain 0,33 0,63 4,00 9,92 8,02 6,57
Sweden 7,11 1,56 -2,26 2,73 -0,68 Sweden 5,68 6,41 13,76 13,85 16,80 19,69
UK -1,20 1,02 9,20 5,58 20,04 UK -9,29 -6,84 -0,24 -0,57 7,10 18,51
6.
ETWORK
ACCESS
Table 6.1 etwork Access: Electricity 2007
Number of regulated transmission companies Number of regulated distribution companies Approx network tariff large users €/MWh Approx network tariff low voltage commercial €/MWh Approx network tariff low voltage household €/MWh
Austria 3 130 10,2 48,4 50,7
Belgium 1 26 9 62 49
Bulgaria 4
Cyprus 1 1 34,94 34,94 49,39
Czech Rep. 1 3 1,576 44,85 40,86
Denmark 2 101 12,1 27,2 47,2
Estonia 1 40 12,99 28,27 39,21
Finland 1 89 4,1 23,2 39,2
France 1 148 12,6 40,2 41,9
Germany 4 855 15,1 54 62,8
Greece 1 1 3,75 22,5 4,21
Hungary 1 6 9,23 54,56 38,89
Ireland 1 1 NA NAP NAP
Italy 11 163 13,95 50,85 84,45
Latvia 1 10 3 20 40
Lithuania 1 2 25,98 56,62 56,62
Luxembourg 1 9 7,68 28,96 73,76
Malta NA NA NA NA NA
Netherlands 1 8 NA NA 44,44
Norway 1 159 13,7 24,1 72,3
Poland 1 18 17,69 70,66 48,43
Portugal 3 13 4,08 38,71 39,47
Romania 30 NA 48,04 59,06
Slovakia 1 3 42,4 42,4 42,4
Slovenia 1 1 8,98 55,82 44,04
Spain 1 329 3,8 28,2 31,6
Sweden 1 175 7,64 28,54 48,81
UK 1 18 NA NA 32,94
Source: Regulators data
(ote:
1. Regulated transmission companies regulated: Charges are estimated excluding all taxes and levies. Both transmission and distribution charges are included,
2. Large users:
Denmark: TSO owned by network companies were handed over to the state as part of a broader mutual agreement and merged into a national TSO-Energienet.dk also covering gas
German: as of 12 June2008
Hungary: Legally there are 6 DSO, but considering the DSO ownership structure, there are just 3 proprietary groups
[image:34.595.74.519.120.555.2]Luxembourg: Based on the law, the TSO "Sotel reseau et Cie S.e.s.c." is considered being an "industrial system operator"
Portugal: Mainland of Portugal and Islands of Azores and Madeira
3. Low voltage commercial:
CZ: costumers on VHV level
Germany: As of 1 of April
Portugal: from September to December the value was 1,99 €/MWh
Romania: data for the second semester
Table 6.2 Composition of electricity prices 2007
HOUSEHOLDS
Composition of the household prices in € per 100 kWh Share in price without tax (%)
Total
price Energy&supply
Network
costs Taxes&levies Energy&supply
Network costs
Poland 13,80 3,59 7,10 3,10 33,6 66,4
Romania 11,41 3,46 6,08 1,87 36,3 63,7
Denmark 24,01 4,16 6,16 13,69 40,3 59,7
Lithuania 8,70 3,13 4,16 1,41 43,0 57,0
Luxemburg 15,91 6,15 8,06 1,70 43,3 56,7
Estonia 7,86 2,88 3,64 1,34 44,1 55,9
Slovakia 13,70 5,55 5,97 2,18 48,2 51,8
Sweden 16,13 5,11 5,03 5,99 50,4 49,6
Germany 21,05 6,61 6,18 8,26 51,7 48,3
Latvia 7,29 3,59 3,34 0,35 51,8 48,2
Belgium 16,83 7,01 5,85 3,97 54,5 45,5
Finland 11,49 4,75 3,92 2,82 54,8 45,2
Czech
Republic 10,63 5,00 3,95 1,68 55,9 44,1
Bulgaria 7,21 3,37 2,66 1,18 55,9 44,1
Hungary 12,96 5,69 3,87 3,40 59,5 40,5
Malta 9,93 7,23 2,20 0,50 76,7 23,3
Table 6.3 Access Conditions to Gas Transmission networks
Transmission Tariff model Congestion management Capacity allocation mechanism Balancing model appliedAustria 3 NAP 5 2,3
Belgium 1,2,3 1,2,3,4,5,6,7,8 1,2,3,4,5 1,2,3
Bulgaria
Cyprus NAP NAP NAP NAP
Czech Rep. 2,3 2,6,7 3 2
Denmark entry-exit uncoupled UIOLI; secondary market, Interruptible capacity
First come first served, pro rata
TSO uses
storage for balancing-TSO contracts
sources of
balancing gas
Estonia 1 - 1 NAP
Finland 3 NAP NAP 2
France entry-exit uncoupled,2
Auction, pro rata, UIOLI;
secondary market,
Interruptible capacity
First come first served, auction, pro rata, capacity
goes with
costumers
TSO buys
balancing gas on the regular gas market,
TSO uses
storage for balancing
Germany 2 6,7 1 NA
Greece NAP 5 1 2
Hungary 1 1+2+5+6 1+2+3 1+2+3
Ireland 2 6 1 2
Italy 2 2,6,7 3 3
Latvia 1 NAP NAP -
Lithuania NAP 7 1 1
Luxembourg 1 NAP 1 1
Malta
Netherlands 2 5,7 1 2
Norway
Poland 3 2,5,6,7,8 1 2,3
Portugal 3 1,8 1,5 3
Romania 1
In order to settle the congestions, the approved but unused capacity may make up the object of a) voluntary return to the TSO
b) capacity transfer facility CTF
c) mandatory transfer from one network user to another by the TSO
1 3
Slovakia 2 TSO 5,6,7
DSO 2,6,8 1 1,2,3
Slovenia One single
UK uncoupled
Capacity by back UIOLI
Secondary market Interruptible capacity
Auction, first
come first
based,
Capacity goes
with the
costumer,
2.87
Source: Regulators’ submissions
Note:
Tariff model (1- entry exit coupled, 2- entry exit uncoupled, 3- point-to point);
Congestion management (1- auction, 2-pro rata, 3- lottery 4- capacity by back, 5- UIOLI, 6- secondary market, 7- Interruptible capacity, 8- use it or sale it).;
Capacity allocation mechanism (1- first come first served, 2- auction, 3- pro rata, 4- allocation on deadline, 5- capacity goes with the costumer);
Table 6.4 Regulated companies and access charges: Gas
Number of
regulated transmission companies
Number of
regulated distribution companies
Approx network tariff
large users
(standard consumer I4=annual consumption of 418.6 GJ (€kWh))
Approx
network tariff
medium commercial (standard consumption I 1=annual consumption
of 0,4186TJ
(€kWh))
Approx network tariff small
commercial/ household (standard consumer
D3= annual
consumption of 83, 7 GJ)
Austria 7 20 NAP 0,8678 1,2933
Belgium 1 18 0,13 0,95 1,3
Bulgaria - - NAP NAP -
Cyprus NAP NAP NA NAP NAP
Czech Rep. 1 69 0,236 0,4932 0,5685
Denmark 1 4 0,38 1,39 1,39
Estonia 1 27 0,151 0,151 0,537
Finland 1 32 0,68 NA NA
France 2 23 0,101 0,938 0,132
Germany 20 697 0,17 0,93 0,118
Greece 1 4 0,41 1,44 1,51
Hungary 1 10 0,348 0,725 0,791
Ireland 1 1 NAP NAP NAP
Italy 2 338 0,1673 0,7863 1,0452
Latvia 1 1 0,51 1 1
Lithuania 1 6 0,384 0,659 0659
Luxembourg 1 4 0,117 0,462 0,738
Malta NAP NAP NAP NAP NAP
The Netherlands 1 12 NA NA 0,85
Norway NAP NAP NAP NAP NAP
Poland 1 7 0,3878 0,0886 1,0781
Portugal 1 11 NA NA NA
Romania 1 36 NA NA NA
Slovakia 1 48 0,36 0,0912 2,86
Slovenia 1 17 0,2031 NA 1,4070
Spain 8 22 0,2629 0,132 2,3050
Sweden 3 5 0,36 NA 2,18
UK 1 8 NA NA 0,76
Source: Regulators data
Note:
1. Categories of users: Large users – prices for standard consumer I4 = annual consumption of 418,6 TJ; medium commercial – prices for standard consumer I1 = annual consumption of 0,4186 TJ; small commercial and households – prices for standard consumer D3 = annual consumption of 83,7 GJ.
2. Italy: number of regulated transmission companies: 3 other companies own small regional network stretches.
3. Sweden: no large users.
7.
UBUDLIG
Table 7.1 Unbundling of etwork Operators: Electricity Transmission
Unbundling implemented? TSO with network assets
Ownership unbundling
Public Ownership
Private ownership
with without
Austria 0 51 49 1 2
Belgium 0 35,55 64,45 1 0
Bulgaria 0 100 0 0 0
Denmark 1 100 0 1 0
Finland 1 12 88 1 0
France 0 84,8 15,2 1 0
Germany 0 0 100 4 0
Greece 0 51 49 1 1
Ireland 1 100 0 1 0
Italy 1 30 70 11 0
Luxembourg 0 32,8 67,2 0 1
Netherlands 1 100 0 NA NA
Portugal 1 51 49 1 0
Spain 1 20 80 1 0
Sweden 1 100 0 1 0
UK 1 0 100 1 0
Norway 1 100 0 1 0
Estonia 0 100 0 1 0
Latvia 0 0 100 0 1
Lithuania 1 96,6 3,4 1 0
Poland 1 100 0 0 1
Czech Rep. 1 100 0 1 0
Romania 1 100 0 1 0
Slovakia 1 100 0 1 0
Hungary 0 0,01 99,09 1 NAP
Slovenia 1 100 0 1 0
Cyprus 0 100 0 0 1
Malta - - - - -
Total
Compliance / 28 16
Table 7.2 Unbundling of DSO in Electricity
DSO ELECTRICITY
UMBER OF DSOS
UMBER OF DSOS LEGALLY
UBUDLED
APPLICATIO OF 100.000 CUSTOMER EXEMPTIO
UMBER OF DSOS WITH LESS THA
100.000 CUSTOMERS
AUSTRIA 130 11 YES 119
BELGIUM 26 26 (O 14
BULGARIA 4 4 (O 1
CYPRUS 1 0 YES 0
CZECH REPUBLIC 280 3 YES 277
DEMARK 101 101 (O 96
ESTOIA 40 1 YES 39
FILAD 89 50 (O 83
FRACE 148 0 YES 143
GERMAY 855 150 YES 779
GREECE 1 0 (O 0
HUGARY 6 6 (O 0
IRELAD 1 0 (O 0
ITALY 163 (AP13 YES 152
LATVIA 10 1 YES 9
LITHUAIA 7 2 YES 5
LUXEMBOURG 9 2 YES 8
ORWAY 15914 55 YES 152
POLAD 18 14 YES 4
PORTUGAL 13 11 YES 10
ROMAIA 30 7 YES 22
SLOVAK REPUBLIC 154 3 YES 151
SLOVEIA 1 1 (O 0
SPAI 329 329 YES 323
SWEDE 175 175 YES 158
THE ETHERLADS 8 8 (O 5
UITED KIGDOM 18 18 (O 4
Sources: CEER Data base /(ational reports
Table 7.3 Unbundling of etwork Operators: Gas Transmission
GAS TSOSUMBER OF TSOS UMBER OF TSOS
OWERSHIP UBUDLED
AUSTRIA 7 0
BELGIUM 1 0
BULGARIA 1 0
CYPRUS (AP (AP
CZECH REPUBLIC 1 0
DEMARK 1 1
ESTOIA 1 0
FILAD 1 0
FRACE 2 0
GERMAY 20 1
GREECE 1 0
HUGARY 1 1
IRELAD 1 0
ITALY 215 1
LATVIA 1 0
LITHUAIA 1 0
LUXEMBOURG 1 0
MALTA
POLAD 1 1
PORTUGAL 1 1
ROMAIA 1 1
SLOVAK REPUBLIC 1 0
SLOVEIA 1 0
SPAI 8 1
SWEDE 3 2
THE ETHERLADS 1 1
UITED KIGDOM 1 1
Sources: CEER Data base /(ational reports
Table 7.4 Unbundling of etwork Operators: Gas Distribution
GAS DSOS
UMBER OF DSOS
UMBER OF DSOS LEGALLY
UBUDLED
APPLICATIO OF 100.000 CUSTOMER EXEMPTIO
UMBER OF DSOS WITH LESS THA
100.000 CUSTOMERS
AUSTRIA 20 8 YES 14
BELGIUM 18 18 (O 9
BULGARIA 40 0 YES 40
CYPRUS (AP (AP YES
CZECH REPUBLIC 69 8 YES 61
DEMARK 4 4 (O 2
ESTOIA 27 1 YES 27
FILAD 32 0 YES 32
FRACE 23 0 YES 20
GERMAY 697 145 YES 668
GREECE 4 0 (O 1
HUGARY 10 5 YES 5
IRELAD 1 0 (O 0
ITALY 338 338 YES 264
LATVIA 1 0 (O 0
LITHUAIA 6 0 YES 5
LUXEMBOURG 4 0 YES 4
MALTA
POLAD 7 6 YES 1
PORTUGAL 11 11 YES 7
ROMAIA 36 36 YES 34
SLOVAK REPUBLIC 48 1 YES 47
SLOVEIA 17 0 YES 17
SPAI 22 22 (O 16
SWEDE 5 5 YES 5
THE ETHERLADS 12 12 (O 7
UITED KIGDOM 8 5 (O 0
8.
SUPPLY
–
DEMAD
BALACE
Table 8.1 Electricity generation 2007
MW annual final demand
including losses without pumped storage
Peak load Maximum net
generating capacity
Total net generation volume
Austria 61,744 10,477 19,400 63741
Belgium 90,109 14,040 16,363 84,792
Bulgaria
Cyprus 4,851 1,056 1,129 4,584
Czech R 72,04 11,056 17,561 81412,7
Denmark 35,7 6,4 12,7 37400
Estonia 8,534 1,537 2,057 10954
Finland 90,3 14,9 13,3 77700
France 480,3 89 115,5 544700
Germany 569,2 78,5 143,3 597300
Greece 55,25 10,610 11,871 56300
Hungary 37,25 6,602 6,872 37220,11
Ireland 6,8
Italy 339,9 56,8 79,4 301299
Lithuania 9,1 2,5 2,684 12,2
Luxembourg 6,413 1,086 0,584 3157
Malta 121,5
Netherlands 112 NA 21 99349000
Norway 125,8 21,450 30,303 137400
Poland 154,2 24,6 26,90 159528
Portugal 50,05 9,11 14,041 43,102
Romania 18,4 61390
Slovakia 29,632 8,681 7,508 27,907
Slovenia 13,864 2,060 3,006 13636
Spain 276,3 44,78 90,72 286588
Sweden 157,4 24,5 34,07 145087
UK 350,08 606 78,4 354000
Source: Regulators data
1. Total generation capacity: maximum net generating capacity. IEA definition: the national maximum generating capacity is defined as the sum of all individual plants´ maximum net capacity available during a period of at least 15 hours per day. Net capacity is without auxiliary services.
2. Slovak Republic: Total generation capacity includes auxiliary services, which represent ca. 1 GW.
3. Sweden: Total generation capacity figures refer to total installed capacity.
Table 8.2 Gas Security of Supply
Total consumption in 2007 TWh/yr
National
production per year TWh/yr
Austria 88,2 20,3
Belgium 189,3 0,0
Bulgaria
Czech Republic 91,3 1,0
Denmark 40,0 90,0
Estonia 9,4 0,0
Finland 45,0 0,0
France 498,5 10,9
Germany 991,2 166,5
Greece 42,6 0,0
Hungary 124,3 24,3
Ireland 4858,0 NA
Italy 898,4 102,6
Latvia 1,7 0,0
Lituania 33,1 0,0
Luxembourg 15,0 0,0
Netherlands 400,0 709,0
Poland 152,3 47,5
Portugal 48,9 0,0
Romania NAP NAP
Slovak Republic 59,8 1,3
Slovenia 11,8 0,0
Spain 108,0 1,4
Sweden 11,7 0,0
United Kingdom 100,0 73,0
Cyprus NAP NA
Malta NA NA
Norway NA NA
Source: Regulators data
Figures are only indicative and do not fully match due to inconsistent statistical approaches
Note:
1. Total consumption: Gross inland consumption = production + imports – exports + storage variations.