Int. J. Electrochem. Sci., 14 (2019) 2187 – 2207, doi: 10.20964/2019.03.15
International Journal of
ELECTROCHEMICAL
SCIENCE
www.electrochemsci.org
Corrosion Protection of Stainless Steel 201 in Acidic Media
using Novel Hydrazine Derivatives as Corrosion Inhibitors
A. S. Fouda1,*, S. A. Abd El-Maksoud2, A. El-Hossiany3, A. Ibrahim1
1 Department of Chemistry, Faculty of Science, El-Mansoura University, El-Mansoura-35516, Egypt, 2 Department of Chemistry, Faculty of Science, Port Said University, Egypt
3 Chemist, Delta Fertilizers Company in Talkha, Egypt *E-mail: asfouda@hotmail.com, asfouda@mans.edu.eg
Received: 3 November 2018 / Accepted: 25 December 2018 / Published: 7 February 2019
This study aimed at the application of hydrazine derivatives (HZD) in acid media as corrosion inhibitors of stainless steel 201 (SS201). In the chemical and electrochemical technique, SS201 is the constructional material widely used. The various factors, which influence the corrosion inhibition efficiency of different HZD have been discussed. Different techniques were used to evaluate the corrosion inhibition. Atomic force microscopy (AFM) and FTIR were utilized to study the surface morphology of SS201which revealed that the inhibitors produce a thin film adsorbed on the surface of SS201.
Keywords: SS201, Hydrazine derivatives, HCl, Corrosion inhibition, AFM, FTIR 1. INTRODUCTION
containing donor atoms like S, O and N. Inhibitors including triple or double bonds performance had a significant role in simplifying the adsorption of these compounds. A bond can be designed among the cloud π-electron and/or the electron pair of the donor atoms and the surface of metal, thus lowering the corrosive attack in an acidic solution [6-14], and utilized as corrosion protection and those including "N" have frequently mentioned to in the literature [15], pyrrole and its derivatives [16], Distyryl [17], 1,3-Thiazolidin-5-one [18], Pyrazolone [19], Pyrazolocarbothioamide [20]. The choices of these HZD have aimed to: a) They have high molecular sizes b) have high solubility in water, and c) have many donating atoms, which they can adsorb on the SS201 surface.
The scope of this paper is to study the inhibitory influence of HZD on the corrosion of SS 201 in 1.0 N HCl solutions utilizing mass loss (ML), potentiodynamic polarization (PP), electrochemical impedance spectroscopy (EIS) and electrochemical frequency modulation (EFM) tests. Surface morphology characterized by AFM and FT-IR analysis.
2. EXPERIMENTAL
2.1 Materials and solution
[image:2.596.79.519.571.756.2]The chemical composition of SS201 presents in this research is C 0.15%, Mn 5.5-7.5%, P 0.06%, Si 1%, Cr 16-18% and the reminder of the weight percentage is Fe. The specimens were mechanically cut into about 2 cm × 2 cm×0.2 cm dimensions with for Mass loss, and 1cm× 1cm× 0.2 cm for electrochemical measurement techniques.These specimens were polished with sand paper 1000,1500 and 2000 to a metallic shine, degreased with absolute ethanol washed with bidistilled water and finally dried as previously. The hydrochloric acid was diluted to 1.0 M HCl as a corrosive medium. The inhibitors used with different concentrations ranged from (1 x10⁻⁶ - 21 x10-6M). 10-3 M stock solutions from the studied inhibitors were prepared by dissolving the convenient weights of the HZD in bidistilled water; the other concentrations of HZD (1 x10⁻⁶ - 21 x10-6M) were prepared by dilution with bidistilled water. All the materials used were of AR grade and used as received. The structure formulas of the examined inhibitors were given in Table 1.
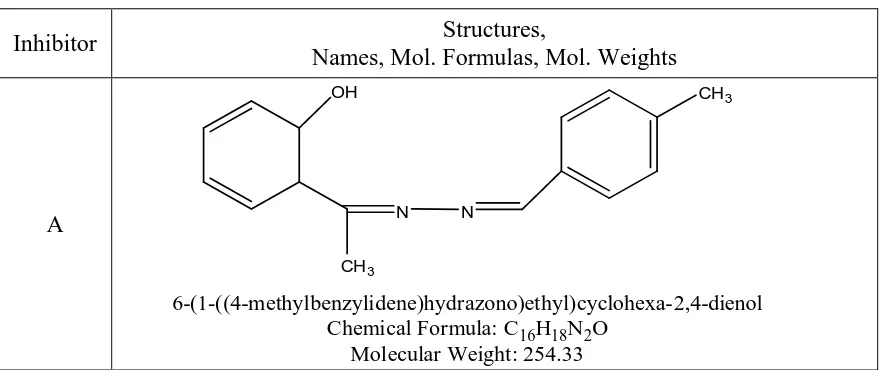
Table 1. Chemical structures of the prepared hydrazine derivatives
Inhibitor Structures,
Names, Mol. Formulas, Mol. Weights
A N N
OH
CH3
CH3
6-(1-((4-methylbenzylidene)hydrazono)ethyl)cyclohexa-2,4-dienol Chemical Formula: C16H18N2O
B
N N
OH CH3
6-(((4-methylbenzylidene)hydrazono)methyl)cyclohexa-2,4-dienol Chemical Formula: C15H16N2O
Molecular Weight: 240.30
C
N N
CH3
CH3
1-(4-methylbenzylidene)-2-((4-methylcyclohexa-2,4-dienyl)methylene)hydrazine Chemical Formula: C16H18N2
Molecular Weight: 238.33
2.2 ML tests
The pretreated SS type 201 coins were dipped in 100 ml solution of 1.0 M HCl with and without different doses of HZD at 25-45oC for 3h. The range of HZD concentrations in test solutions has selected
to be (1 x10⁻⁶ - 21 x10-6M). After indicated time the SS specimens had removed from corrosive solution, rinsed with bidistilled water, dried and weighted.
2.3 Electrochemical measurements
The behavior of HZD as inhibitors for corrosion of SS201 in 1.0 M HCl was further examined by PP and EIS. All electrochemical experiments were performed at 25oC using three-electrode cell setup consists of (SCE) saturated calomel electrode utilized as reference electrode, (Pt) platinum wire was utilized as counter electrode and SS430 as (WE) working electrode. The WE was prepared as follows at first one side of SS201 sheet (10 ml x 10 ml x 20 ml) has fused to a Cu wire for connection electrical. Subsequently, the Cu wire which attached to SS201 sheet was inserted into a glass tube and then fixed by epoxy resin to make the size of SS201 visible to the test solutions is 1 cm2. Prior to measurements the sample was pretreated as mentioned before and the potential of electrode was permitted to stabilize for half hour in order to reach a steady state. For PP test the potential was initiated from -500 to 500 mV vs OCP with rate of scan 0.5 mVs-1. EIS tests were done in a range of frequency from 0.1 Hz to 10-5 Hz with amplitude of 10 mV peak to peak under open circuit condition. However, polarization resistances Rp, were estimated from the altered among the intercepts of low- and high-frequency with the actual axis
2.4 Surface examination
Coins utilized for surface analysis were immersed in 1.0 M HCl in without and with 21 x10-6M
of HZD solutions for 15 h. After this immersion time, the coins were removed, rinsed with bidistilled water many times to remove any residue and dried. The investigation was done by (AFM). FTIR analyses were tested for SS201 surface before and after immersion 15 h in 21 x10-6M of HZD and then compared to the spectra of HZD. Fourier transforms infra-red spectroscopy was utilized to investigate the film formed on the surface of SS201 by Thermo Fisher Nicolet IS10, USA in the spectral range of 400 – 4000 cm−1.
2.5 Theoretical investigation
The quantum chemical parameter was found by M S D Mol [23] 4 4 0 which using efficient density theory DFT. The chemically quantum , EHOMO (the highest occupied molecular orbital), ELUMO
(the lowest unoccupied molecular orbital), dipole moments (µ), energy gaping (ΔE), Hardness (η), Softness (σ),Ionization potentials (I), Electronegativity (X) of the created compound (I) were discussed.
3. RESULT AND DISCUSSION
3.1. ML measurements
Table (2) displays the mass loss values; (CR) corrosion rate, (%IE) inhibition efficiency, and (θ) surface of SS 201 coating in 1.0 M HCl in the absence and presence of different concentration of HZD which can be measure through the next equation (1).
%𝜂 = 𝜃 × 100 = (1 −∆𝑊𝑢
∆𝑊𝑖) 100 (1)
Where ΔWu and ΔWi are the ML’s per unit area with and without the HZD, respectively. The
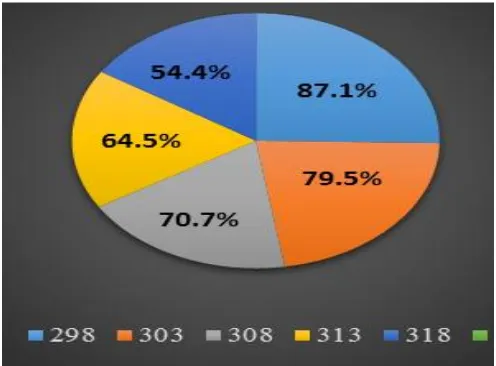
addition of HZD accompanied by decreasing in ML and CR while, raising in %IE and θ. This ensures that efficiency of HZD as (%IE) at an optimum concentration 21x10-6 reach 87.1%. Fig (1) shows ML vs. time diagram of SS201 with and without various concentrations of HZD at 25◦C. Alike plots done for other temperatures (not display).
20 40 60 80 100 120 140 160 180
0 1
2 Blank
Weight
loss
,mg cm
-2
Time (min) 1 x 10 -6 5 x 10 -6 9 x 10 -6 13 x 10 -6 17 x 10 -6 21 x 10 -6
30 60 90 120 150 180 0
[image:5.596.178.415.69.270.2]2 4 6 8
Figure 1. ML &time diagrams of SS201 in 1.0 M HCl with and without various concentrations of the investigated compound (I) at 25°C
Table 2. CR and inhibition percent of SS201 in absence and existence of various concentrations of the studied HZD after 120 min immersion at 25oC
Comp I II III
Conc., x
106 M Ɵ % IE Ɵ % IE Ɵ % IE
1 0.773 77.3 0.762 76.2 0.735 73.5
5 0.794 79.4 0.779 77.9 0.763 76.3
9 0.808 80.8 0.797 79.7 0.782 78.2
13 0.829 82.9 0.814 81.4 0.803 80.3
17 0.845 84.5 0.839 83.9 0.821 82.1
[image:5.596.109.488.368.609.2]
Figure 2. Effect of temperature on the %IE of SS201 in presence of 21x10-6 M of compound (I)
3.2 Adsorption isotherm
Adsorption isotherms are commonly used to recognize the mechanism of protection on the metal surface [24]. The excellent fit was obeyed by Langmuir, which is signified in Fig (3) for HZD using equation (2):
𝐶
𝜃=
1
𝐾𝑎𝑑𝑠+ 𝐶 (2)
Where C is the inhibitor concentration in the bulk of electrolyte (Mol L–1) and Kads is the
equilibrium constant of adsorption and ΔGo
ads is the free energy and can be calculated by:
𝐾𝑎𝑑𝑠= 1
55.5 𝑒𝑥𝑝 [∆𝐺 °
𝑎𝑑𝑠] / 𝑅𝑇] (3)
Where 55.5 is the molar concentration of water in the solution in M-1, R is the constant gas, T is the absolute temperature. Thermodynamic parameters obtained from adsorption of the inhibitors on SS 201 surface in 1.0 M HCl at different temperatures was record in the Table (3). It was established that ΔG°ads has –ve values among 19.5 to 22.1 kJ mol-1 indicating that the HZD adsorption on SS 201 in 1.0
M HCl solution is a spontaneous process belong to physisorption mechanism [25] .
The standard enthalpy ΔH°ads and entropy ΔS°ads obtained from adsorption can be measured
using next eqs.(4) and (5)
𝐿𝑛 𝐾𝑎𝑑𝑠 = [−𝛥𝐻𝑎𝑑𝑠 /𝑅𝑇] + 𝑐𝑜𝑛𝑠𝑡 (4) 𝛥𝑆𝑎𝑑𝑠= (𝛥𝐻𝑎𝑑𝑠− 𝛥𝐺𝑎𝑑𝑠)/𝑇 (5)
The value of ΔH°ads was evaluated from the slope of the lines of Ln K versus1/T see Fig (4). The
–ve sign value of ΔH°ads indicates that the process of adsorption is exothermic, and the –ve sign value
of ΔS°ads means that adsorption occurs spontaneously [26]. The investigated compounds have good
inhibition efficiency as obtained from the values of Kads where the high values of Kads indicate there is
strong electrical interaction between the adsorbed HZD molecules and the double-layer exist at the phase boundary. On the other hand, the small values of Kads indicate that the interactions between the adsorbed
0.000000 0.000005 0.000010 0.000015 0.000020 0.000025
0.000000 0.000005 0.000010 0.000015 0.000020 0.000025 0.000030 0.000035 0.000040
Concentration,(g/L)
C/
25 oC,R2 =0.99
30 o
C,R2
=0.99
35 o
C,R2
=0.99
40 o
C,R2
=0.99
45 o
C,R2
=0.99
[image:7.596.185.406.74.234.2]Figure 3. Plots fitting of corrosion value for SS201 in 1.0 M HCl with and without various concentrations of investigated compound (I)
Table 3. Adsorption parameters for HZD in 1.0 M HCl obtained from Langmuir at various temperatures
Comp Temp., K
-∆G°ads
kJ mol-1
-∆H◦ads
kJ mol-1
-∆S◦ads
J mol-K-1
I
298 22.1
50
98
303 21.8 96
308 21.1 93
313 20.9 91
318 20.3 90
II
298 21.9
47
78
303 21.1 73
308 20.7 72
313 20.1 71
318 19.9 70
III
298 21.1
45
76
303 20.8 72
308 20.2 67
313 19.8 64
[image:7.596.154.444.334.718.2]
Figure 4. Ln K versus1/T plots for SS201 in 1.0 M HCl of the investigated compound (I)
3.3 Kinetic and thermodynamic parameters
The corrosion rate dependence on temperature can represent by Arrhenius equation: kcorr = A exp (-E*a/RT) (6)
Where A is the pre-exponential factor and Ea* is the energy of activation for the corrosion process.
Enthalpy and entropy of activation (ΔH*, ΔS*) for the corrosion process were measured from the transition state equation:
kcorr = RT/Nh Exp(-∆H*/RT)Exp(-∆S*/R) (7)
Where N is the Avogadro's number and h is the Planck’s constant.
Arrhenius plots (log (kcorr) of SS201 with and without various concentrations of HZD against
1/T) is presented in Fig (5). Ea* can be measured from the slope of these lines, while ΔH* and ΔS* can
be obtained through the intercept and slope of plots of log (kcorr/T) vs. (1/T) as shown in Fig (6). The
data of Ea*, ΔH*, and ΔS* are recorded in the Table (4)
3.15 3.20 3.25 3.30 3.35 -2.2
-2.0 -1.8 -1.6 -1.4 -1.2 -1.0 -0.8
blank 1 M HCl 1 x 10⁻⁶ 5 x 10⁻⁶ 9 x 10⁻⁶ 13 x 10 -6 17 x 10-6 21 x10-6
Lo
g
kcorr
, m
g cm
-1 min
-1
1/T K-1
Figure 5. Arrhenius plots of log( kcorr ) vs 1/T of SS201 corrosionin 1.0.MHCl with and without various
[image:8.596.194.400.548.710.2]
3.15 3.20 3.25 3.30 3.35
-4.8 -4.6 -4.4 -4.2 -4.0 -3.8 -3.6 -3.4
Blank R2=98
1x10⁻⁶ M R2=98
5x10⁻⁶ M R2=99
9x10⁻⁶ M R2=98
13x10-6 M R2=97 17x10-6 M R2=99
21x10-6 M R2=98
Log
( k
corr
/
T
) , m
g cm
-1 min -1 K
-1
[image:9.596.182.413.70.253.2]1000 / T K-1
Figure 6. log kcorr/T vs 1/T plots for SS201 corrosion with and without the various concentrations of
compound (I) in 1.0 M HCl
From Table (4) the Ea* for inhibiting solution is greater than that for the uninhibited solution,
indicating that SS201 dissolution decreases in the existence of HZD [28]. The higher Ea* data lead to the
minor kcorr, this is due to of the formation of an adsorbed a film on SS201 surface by HZD [29] . The -ve
values of ΔS* meaning that there is a decrease in disorder occur during progression of transition from
reactants to the activated complex [30].
Table 4. Activation parameter for SS201 corrosion with and without various concentrations of investigated HZD in 1.0 M HCl
Comp Conc., x 106 M
Ea*,
kJ mol-1
∆H*,
kJ mol-1
-∆S*, J mol-1K-1
Blank 0.0 33.4 13.4 166.1
I
1 70.79 27.6 51.9
5 74.12 30.1 41.6
9 75.45 31.1 40.6
13 77.61 32.5 34.4
17 82.78 34.8 18.1
21 86.14 35.2 8.9
II
1 70.1 26.5 53.1
5 72.8 28.8 47.5
9 74.8 30.8 45.3
13 76.4 32.1 38.8
17 79.7 33.4 24.6
21 82.5 34.7 10.7
III 1 69.5 24.2 55.7
5 71.5 27.5 51.1
9 73.2 29.8 48.6
13 75.8 31.4 41.8
17 78.7 32.4 27.1
[image:9.596.113.485.440.748.2]
3.4 Electrochemical measurement
3.4.1 Potentiodynamic polarization (PP) technique
-1.0 -0.8 -0.6 -0.4 -0.2 0.0 0.2 1E-6
1E-5 1E-4 0.001 0.01 0.1
Blank 1x10⁻⁶
M 5x10⁻⁶ M
9x10⁻⁶
M 13x10-6
M 17x10-6
M 21x10-6
M
log
icorr
, A cm
-2
[image:10.596.187.408.131.302.2]E , mV ( vs. SCE )
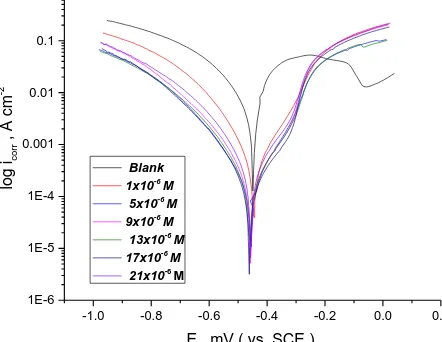
Figure 7. PP plots of dissolution of SS201 in 1.0 M HCl without and with different concentrations of inhibitor (I)
Table 5. The influence of inhibitor doses of investigated HZD on PP parameters (Ecorr), (icorr), (βa& βc),
% IE, and (Ѳ) for corrosion SS201 at 25oC
Comp Conc.,
x106 M
icorr,
μA cm-2
- Ecorr,
mV vs SCE
βa
mV dec-1
βc
mV dec-1
C.R
mpy Ɵ
% IE
Blank 0.0 5310 448 120.3 152 25.4 ---- ----
I
1 1251 445 116 146 21 0.764 76.4
5 1110 458 120 141 13.8 0.791 79.1
9 989 456 128 140 10.1 0.814 81.4
13 897 460 118 154 9.7 0.831 83.1
17 730 461 116 165 8.1 0.863 86.3
21 570 452 121 155 7.8 0.892 89.2
II
1 1361 49 111 163 22.2 0.744 74.4
5 1217 450 112 144 20.7 0.771 77.1
9 989 451 124 156 19.6 0.814 81.4
13 918 456 101 150 17.3 0.827 82.7
17 776 461 98 148 13 0.854 85.4
21 689 468 94 157 9.7 0.870 87.0
III
1 1640 470 113 149 24.3 0.691 69.1
5 1310 469 125 147 21.8 0.753 75.3
9 1100 461 111 156 20.7 0.793 79.3
13 890 460 116 164 18.7 0.832 83.2
17 839 459 103 144 16.1 0.842 84.2
[image:10.596.63.535.388.733.2]
Anodic and cathodic polarization curves were obtained in 1M HCl solutionwith and without various concentrations of HZD at 298 oK. In Fig (7) Tafel curves for compound (I) is presented. The
area among line obtained from cathodic and anodic curves come to be wider by adding the inhibitor to the free solution (HCl) [31]. It is clear from the Tafel polarization curves that the presence of investigated compounds to the corrosive media shifts both cathodic and anodic lines to lower values of icorr and hence,
there is a decrease in the kcorr. The parameters obtained from PP diagrams are recorded in Table (5).The
(%IE) can be calculated using the (icorr) values determined by Tafel extrapolationas follows:
%IE = [1-(icorr/iocorr)] x 100 (6)
where iocorr and icorr are the current densities of uninhibited and inhibited solution, respectively.
A slight change was observed on Tafel slopes (βa and βc) upon the addition of investigated
compounds confirming that the mechanism of the corrosion process was maintained even with the existence of the tested compounds. It is generally, known that HZD can be ordered as mixed kind if the shift of Ecorr in the presence of HZD is less than 85 mV with respect to the absence of the HZD [32]. In
our research, the higher shift in Ecorr was 27 mV which lead to that these compounds are mixed kind
inhibitors
3.4.2 EIS method
EIS was known as a great method for the corrosion analysis [33]. Fig (8-9) displays the Nyquist and Bode plots obtained at OCP both with and without raising the concentration of HZD at 25°C. Similar curves for another inhibitor was obtained but not display. The increase in the area of the loop by examining compound, which displayed that a barrier has formed progressively on the surface of SS201, improve in the capacitive loop area Fig (8) expands, at a constant inhibitor dose, obey the order: I > II > III compounds. Bode diagrams Fig (9), indicated that the total impedance improves with raising HZD inhibitor dose, also Bode diagrams displayed correlating among the continuous improvement in the phase angle move and the rise of adsorbed HZD compound on the surface of SS201. The Nyquist diagrams don't produce perfect semicircles as predictable from the EIS theory due to the dispersion of a frequency [34] in addition to inhomogeneity of SS surface. The double layer capacitance (Cdl) and %η
are calculated from the following equations:
1
2𝜋𝑓𝑚𝑎𝑥𝑅𝑐𝑡 (7)
Where, fmax refers to the maximum frequency at which the imaginary constituent of the
impedance (Zim) is higher.
%η =𝑅𝑐𝑡−𝑅𝑐𝑡𝑜
𝑅𝑐𝑡 (8)
Where, Rct and Roct are the resistances in absence and presence of inhibitor
EIS values recorded in Table (6) showed that Rct values increased by raising the concentration
of the inhibitors and this lead to improvements in % IEEIS, which agrees with the obtained data from PP.
Actually, the existence of inhibitors improves the values of Rct and decreases both the Cdl and icorr values,
-20 0 20 40 60 80 100 120 140 160 180 200 220
0 10 20 30 40 50 60 70 80 90 100 Blank 1x10⁻⁶ M 5x10⁻⁶ M 9x10⁻⁶ M 13x10-6 M 17x10-6 M 21x10-6 M Zima g , o h m cm -2
Zreal, ohm cm-2 0 5 10 15 20 25
0 2 4 6 8 10 Zima g Zreal
Figure 8. EIS Nyquist diagrams for SS201 in1.0 M HCl without and with various concentrations of compound (I)
0.01 0.1 1 10 100 1000 10000 100000 1000000
1 10 100
Blank
1x10⁻⁶ M
5x10⁻⁶ M
9x10⁻⁶ M
13x10-6 M
17x10-6 M
21x10-6 M
lo g Z mo d , o hm cm -2
log F, Hz
-70 -60 -50 -40 -30 -20 -10 0 Zph , d eg
[image:12.596.177.418.72.275.2] [image:12.596.157.438.323.527.2]Figure 9. EIS Bode diagrams of SS201 in 1 M HCl with and without different concentrations of compound (I)
Table 6. EIS data of SS201 corrosion in 1 M HCl with various concentrations of HZD at 25°C Comp Conc., x
106 M
Rct,
Ω cm2
Cdl,
µFcm−2 θ %IE
Blank 0 23 393
I
1 98 134 0.765 76.5
5 111 122 0.793 79.3
9 132 118 0.826 82.6
13 151 112 0.848 84.8
17 172 105 0.866 86.6
21 198 97 0.884 88.4
[image:12.596.147.449.608.767.2] [image:12.596.149.449.608.767.2]
II
5 105 127 0.781 78.1
9 126 116 0.817 81.7
13 135 114 0.830 83.0
17 159 111 0.855 85.5
21 180 101 0.872 87.2
III
1 76 142 0.697 69.7
5 80 132 0.713 71.3
9 102 123 0.775 77.5
13 138 118 0.833 83.3
17 145 115 0.841 84.1
21 167 110 0.862 86.2
Figure 10. Equivalent circuit utilized to fit the EIS data
3.4.3 EFM method
0.0 0.2 0.4 0.6 0.8 1.0 1.2 1.4 1.6 1E-9 1E-8 1E-7 1E-6 1E-5 1E-4 1E-3
0.0 0.2 0.4 0.6 0.8 1.0 1.2 1.4 1.6 1E-9 1E-8 1E-7 1E-6 1E-5 1E-4 1E-3
0.0 0.2 0.4 0.6 0.8 1.0 1.2 1.4 1.6 1E-9 1E-8 1E-7 1E-6 1E-5 1E-4 1E-3
0.0 0.2 0.4 0.6 0.8 1.0 1.2 1.4 1.6 1E-8 1E-7 1E-6 1E-5 1E-4 1E-3
0.0 0.2 0.4 0.6 0.8 1.0 1.2 1.4 1.6 1E-8 1E-7 1E-6 1E-5 1E-4 1E-3
0.0 0.2 0.4 0.6 0.8 1.0 1.2 1.4 1.6 1E-9 1E-8 1E-7 1E-6 1E-5 1E-4 1E-3
0.0 0.2 0.4 0.6 0.8 1.0 1.2 1.4 1.6 1E-8 1E-7 1E-6 1E-5 1E-4 1E-3 Cu rr e n t( A) Frequency(Hz) 1X10⁻⁶ M Cu rr e n t( A) Frequency(Hz) 5X10⁻⁶ M Cu rr e n t( A) Frequency(Hz)
9X10⁻⁶ M
Cu rr e n t( A) Frequency(Hz)
13X10-6 M
Cu rr e n t( A) Frequency(Hz) 17X10-6 M Cu rr e n t( A) Frequency(Hz)
21X10-6 M
[image:13.596.149.450.70.228.2]C ur re nt (A ) Frequency(Hz) Blank
Figure 11. EFM data for SS201 dissolution in 1 M HCl with and without various concentrations of compound (I) at 25°C
[image:13.596.146.449.437.652.2]
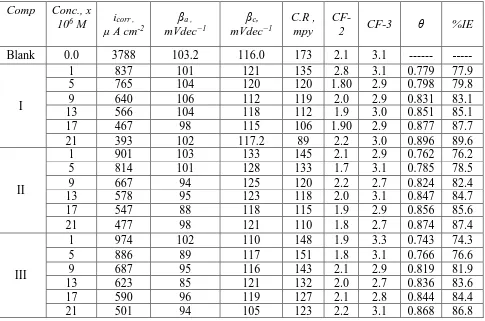
CF-3) and (βc and βa). EFM data were recorded in Table (7). The obtained values in Table (7) clearly
indicated that the adding of any one of HZD tested compounds in the acidic solution lowers icorr, indicates
that these compounds prevent the corrosion of SS201 among adsorption. The %IEEFM improves by
raising the inhibitor concentration and was calculated from Eq. (6). The %IEEFM obtained from this test
[image:14.596.67.552.226.547.2]is in the order: I > II > III at all concentrations. The IE obtained from EFM technique is similar to those calculated by ML, PP and EIS techniques.
Table 7. Parameters obtained from EFM for SS201 dissolution in 1 M HCl with and without various concentrations of investigated HZD at 25°C
Comp Conc., x
106 M icorr , µ A cm-2
βa ,
mVdec−1
βc,
mVdec−1
C.R , mpy
CF-2 CF-3 θ %IE
Blank 0.0 3788 103.2 116.0 173 2.1 3.1 --- ---
I
1 837 101 121 135 2.8 3.1 0.779 77.9
5 765 104 120 120 1.80 2.9 0.798 79.8
9 640 106 112 119 2.0 2.9 0.831 83.1
13 566 104 118 112 1.9 3.0 0.851 85.1
17 467 98 115 106 1.90 2.9 0.877 87.7
21 393 102 117.2 89 2.2 3.0 0.896 89.6
II
1 901 103 133 145 2.1 2.9 0.762 76.2
5 814 101 128 133 1.7 3.1 0.785 78.5
9 667 94 125 120 2.2 2.7 0.824 82.4
13 578 95 123 118 2.0 3.1 0.847 84.7
17 547 88 118 115 1.9 2.9 0.856 85.6
21 477 98 121 110 1.8 2.7 0.874 87.4
III
1 974 102 110 148 1.9 3.3 0.743 74.3
5 886 89 117 151 1.8 3.1 0.766 76.6
9 687 95 116 143 2.1 2.9 0.819 81.9
13 623 85 121 132 2.0 2.7 0.836 83.6
17 590 96 119 127 2.1 2.8 0.844 84.4
21 501 94 105 123 2.2 3.1 0.868 86.8
3.5 Surface Examinations 3.5.1 AFM examination
(a)Blank (b)Comp. (I)
[image:15.596.114.484.71.477.2](c)Comp. (II) (d)Comp. (III)
[image:15.596.165.437.588.667.2]Figure 12. (a) 3D AFM image of SS201 immersed 1.0 M HCl for 1day, (b) 3D AFM image of SS201 immersed in 1.0 M HCl+21x10-6M of compound (I) for 1 day, (c) 3D AFM image of SS201 immersed in 1.0 M HCl+21x10-6M of compound (II) for 1 day, (d) 3D AFM image of SS201 immersed in 1.0 M HCl+21x10-6M of compound (III) for 1 day.
Table 8. AFM parameters of investigated hydrazine derivatives (I, II and III) at 25oC Sample Roughness average (Sa), nm
Blank 512
I 203
II 221
III 291
3.5.2 FTIR analysis
3500 3000 2500 2000 1500 1000 500
86 88 90 92 94 96 98 100
(a)Free Inhhibitor (b)Inhhibitor + metal
80 90 100 110
% Trans
mitt
an
ce
% Trans
mitt
an
ce
Wavenumber (cm-1)
a
[image:16.596.143.451.100.297.2]b
Figure 13. FTIR spectra of inhibitor (I) stock solution (black line) and a layer of inhibitor (I) adsorbed on SS 201 surface (red)
Functional groups and characterizing covalent bonding knowledge had been identified by FT-IR which is an influential analytical device [44]. The fingerprint spectra of the HZD (I) and the SS 201 surface after inundation in 1.0N HCl + 21x10-6 to (I) for 180 min has achieved and compared to each
other. (The same diagrams have achieved in the presence of the other OC, (not shown). FTIR spectroscopy demonstrations, exciting features, for example, power peak to noise ratio, great selectivity and little quantity of sample needed for the examination. Fig (13a and 13b) signify the IR spectrum of HZD and the film produced on the SS201. The FTIR of pure HZD had shown Fig (13a) The -OH- frequency seems at 3407 cm-1, the C=O seems at 1646 cm-1, Aromatic ring seems at 744 cm-1,the –SH frequency seems at 2101 cm-1. The FTIR of the film coated on the SS201 is displayed in Fig (13b). The
-OH is stretching frequency moves from 3407 cm-1 to 3416 cm-1. The –SH is stretching moves from 2101 cm-1 to 2093 cm-1.
3.6. Quantum chemical and statistical parameters
Quantum chemical factors, expecting the relationship of molecular structure for inhibitors (A) particles and its action against corrosion and corrosion of SS201, the important influence directly on an electronic interfering metal SS201 / inhibitor solution, were given in Table (9). The HOMO and LUMO the distributions of electron concentrations of the new surfactants that signify in Fig (14). Higher EHOMO
of elements with electrons providing (lager adsorption) had an affinity to donate unoccupied d-orbital by electrons. Low ELUMO lead particles have a propensity to abstract electrons. (ΔE =ELUMO- EHOMO)
moment (μ) denotes the covalent bonding of the polarities of the surfactants, reliant on the distributions of electrons cloudy. Also, (η) and (σ) are very vital factors for determining the stability's and reactivity's molecules. The hard molecules have large (ΔE) of the materials, and soft and smooth molecules have small (ΔE).
Com
p. HOMO LUMO
Mulliken Charges
I
II
[image:17.596.108.489.154.497.2]III
Figure 14. HOMO and LUMO electronic densities distributions of compounds (I, II and III) in the liquid phase.
Table 9. Quantum chemical parameters for compounds (I, II and III) in liquid phase.
Dm
ol3
parameter Comp.(I) Comp.(II) Comp.(III)
EHOMO(eV) -9.08 -8.97 -8.92
ELUMO (eV) -0.6 -0.46 -0.35
E (eV) 8.480 8.510 8.570
(eV) 4.240 4.255 4.285
(eV-1) 0.236 0.235 0.233
Pi (eV) -4.840 -4.715 -4.635
(eV) 4.840 4.715 4.635
[image:17.596.73.524.592.741.2]
The soft molecule is more active and lowers pitting due to easily donate for electrons to acceptors. In solution, the inhibitors act as a Lewis base (donor) but SS201 (vacant d- orbital) work as a Lewis acid (acceptor). The SS201 atoms are the soft acids then soft base inhibitor are more efficient in corrosive solution.
3.7. The mechanism of inhibition
Studying the effect of inhibition performance for the corrosion of SS201 in 1.0 M HCl, as destructive media, was investigated by using the HZD derivatives. The inhibition process base on many factors such as concentration, the numbers of active sites for their charges densities, molecular mass and their stability in its environments [47]. Actually, the electrons and charge quantities of heteroatoms (N, O, and S atom) which give the tendency to decrease or inhibit the corrosion of the metal surface. The inhibition process depends on the interface of the compounds (I, II, III) on the SS201, depress in active sites of the metal surface and reduce the dissolution. Surface-activities of inhibitors (HZD), organic compounds, can be used as inhibitors, due to large tendency to be adsorbed on the SS201 of the adsorption film of the HZD particles [48].
The sequence of IE is at I > II > III. This order of the lowering in the IE of the tested compounds can be accounted for in terms of the polar effect. I > II > III, this may be due to: the greater molecular size of (I) then (II) and (III), the existence of the number of –CH3 and –OH group in the molecules
(HZD) which adsorbed and form film on the SS201 by blocking the active site and reduce the dissolution SS201 in high concentration of HZD than lower as shown below.
[image:18.596.78.515.452.693.2]
Table 10. Some organic compound as corrosion inhibitors by other authors for steel in HCl and in this study
Inhibitor Structure sample IE% Referenc
es
Ethyl-2-(m-tolyldiazenyl) acetate
SS 316L 71 49
(E)-3-oxo-2-(phenyldiazenyl)
pentanenitrile
SS 316L 70 49
1,8-Octanediamine SS 304 58 50
4-Hydroxy
coumarin Mild steel 61 51
Cetylpyridinium
chloride Carbon steel 81 52
HZD present work SS 201 89.6 This
study
4. CONCLUSIONS
The investigated hydrazine derivatives (I, II, III) is the best inhibitor for corrosion of SS201 in 1.0N HCl. From all experiments, the inhibition increase with raising HZD concentration and decrease with an elevation of temperature. Adsorption of HZD on SS201 surface obeys Langmuir isotherm. From thermodynamic value addition of HZD extract increase activation energy the negative data of (ΔGoads),
and ΔH°ads indicate that adsorption spontaneous and exothermic. Potentiodynamic polarization technique suggests that HZD can use as an additive in anodic and cathodic protection.
References
1. M.G. Fontana, Corrosion Engineering, New York, Mc Graw-Hill, (1967)226. 2. Q. Yang, J.L. Luo, Electrochim Acta, 46(2001)851.
3. E. A. Abd El Meguid, N.A. Mahmoud, S.S. Abd El Rehim, Mater Chem. Phys., 63(1)(2000)67. 4. M.A. Ameer, A.M. Fekry and F. El-Taib Heakel, Electrochim Acta, 50(1) (2004)43.
5. S.S. El-Agamy, W.A. Badway, J Appl. Electrochem., 34(11) (2004)1153.
6. V.V. Torres, R.S. Amado, C.F. de Sa, T.L. Fernandez, C.A.S. Riehl, A.G. Torres, E. D’Elia, Corros. Sci., 53(2011) 2385.
7. E.-S.M. Sherif, A.A. Almajid, J. Appl. Electrochem., 40(2010)1555..
8. K.Shalabi, A.S.Fouda, G.Y.Elewady A.Elaskalany, Protection of Metals and Phys. Chem. Surfs., 50(3)(2014)420
9. E.-S.M. Sherif, R.M. Erasmus, J.D. Comins, J. Coll. Interface Sci., 309(2007)470.
and Phys. Chem. Surfs., 50(2)(2014)254
11.E.S.M. Sherif, R.M. Erasmus, J.D. Comins, Journal of Colloid and Interface Science, 306(2007) 96.
12.E. S. M. Sherif, R. M. Erasmus, J. D. Comins, J. Appl. Electrochem., 39(2009)83. 13.E. Machnikova, K. H. Whitmire, N. Hackerman, Electrochim. Acta., 53(2008)6024. 14.E. S. M. Sherif, R. M. Erasmus, J. D. Comins, Corros. Sci., 50(2008) 3439.
15.M. Abdallah1, M.M. Salem, B. A. AL Jahdaly, M.I. Awad, E. Helal, A.S. Fouda, Int. J. Electrochem. Sci., 12(2017)4543.
16.A. S. Fouda, T. Fayed, M. A. Elmorsi, M. Elsayed, J Bio Tribo Corros., 3(33) (2017)1. 17.M. A. Deyab, A. S. Fouda, M. M. Osmana, S. Abdel-Fattaha, RSC Adv., 7(2017)45232. 18.A. S. Fouda, F.M. El-Taweel, M. Elgamil, Int. J. Electrochem. Sci., 12(2017)11397.
19.D. A. Jones, Principles and Prevention of Corrosion, second ed., Prentice Hall, Upper Saddle River, NJ, (1983).
20.F. M. Donahuce, K. Noor, J. Electrochem. Soc., 112(1965)886. 21.Gamry Echem Analyst Manual, (2003).
22.N. O. eddy, E. E. Ebenso, Int. J. Electrochem. Sci., 5(2010)731. 23.B. Delley, Journal of Chemical Physics,113(2000)7756.
24.E. Kamis, F. Bellucci, R. M. Latanision, E. S. El-Ashry, Corrosion, 47 (1991) 677. 25.M. A. Amin, S. S. Abd El-Rehim, M. M. El-Naggar, H. T. Abd El-Fattah, J. Mater. Sci.,
44(2009)6258.
26.E. E. Oguzie, Mater. Chem. Phys., 99(2006)441.
27.A. Popova, E. Sokolova, S. Raicheva, M. Christov, Corros. Sci., 45(2003)33.
28.A. S. Fouda, H. A. Mostafa, G. Y. Elewady, M. A. El-Hashemy, Chemical Engineering Communications, 195(8)(2008)934.
29.M. Kendig, S. Jeanjaquet, J. Electrochem. Soc., 149(2002)B47.
30.M. E. Nicho, H. Hu, J. G. Gonzalez-Rodriguez, V. M. Salinas, J. Appl. Electrochem., 36(2)(2006)153.
31.A.S. Fouda, A.M. El- Defrawy, M.W. El-Sherbeni, J. of Electrochemical Science and Technology, 39(2) (2012)1.
32.A.S. Fouda, A.A. Al-Sarawy, E.E. El-Katori, Desalination, 201(2006)1. 33.S. Martinez, M. Metikos-Hukovic, J. Appl. Electrochem., 33(2003)1137.
34.R. W. Bosch, J. Hubrecht, W. F. Bogaerts, B. C. Syrett, Corrosion, 57(2001)60. 35.K. F. Khaled, Electrochim. Acta, 53(2008)3484.
36.K. F. Khaled, Int. J. Electrochem. Sci., 3(2008)462.
37.D. A. Jones, Principles and Prevention of Corrosion, second ed., Prentice Hall, Upper Saddle River, NJ, (1983).
38.A. S. Fouda, Y. M.Abdallah, D. Nabil, IJIRSET, 3(2014)12965. 39.Y. Y. Enriadi, N. J. Gunawarman, BCES, 14(2014)15.
40.H. O. Curkovic, K. Marusic, E. Stupnisek-Lisac, J. Telegdi, Chem. Biochem. Eng. Q ., 23(1)(2009)61.
41.S. B. Pralhibha, P. Kotteeswaran, V. Bheema Raju, IOSRJAC, 2(2012)45.
42.S.K. Rajappa, T. V. Venkatesh, International Journal of Innovative Research in Science, Engineering and Technology,5(3)(2016)3917
43. C.R. Jahromi, and K. Dehghanian, Int. J. Current Res.,9(1)(2017)44630.
44.F. Bensajjay, S. Alehyen, M. El Achouri, S. Kertit, Anti-Corros Meth Mater, 50 (2003)402. 45.J. Zhang, X.L. Gong, H. H. Yu, M. Du, Corros. Sci., 53(10)(2011)3324.
46.M. K. Awad, M. S. Metwally, S. A. Soliman, A. A. El-Zomrawy, M.A. bedair, Journal of Industrial and Engineering Chemistry, 20(3)(2014)796.
49.A.S. Fouda, M. A. Diab, and S. Fathy, Int. J. Electrochem. Sci., 12 (2017)347. 50.A.S. Fouda, H.A. Mostafa, G.Y. Elewady, M.A. El-hashemy, Chem. Eng. Commun.,
195(2008)934.
51.S.R. Krishnamurthy, M.H.N. Parameswaran, ISRN Corros., (2013)1.