Int. J. Electrochem. Sci., 11 (2016) 189 - 199
International Journal of
ELECTROCHEMICAL
SCIENCE
www.electrochemsci.org
Synthesis and Lithium Storage Performance of Mesoporous
Co
3O
4Microrods Derived From Co-based Metal-Organic
Framework
Fang Zhang*, Dan-Dan Qi, Xiao-Gang Zhang
College of Material Science and Technology, Nanjing University of Aeronautics and Astronautics, Nanjing, Jiangsu 210016, China
Jiangsu Key Laboratory of Materials and Technology for Energy Conversion, Nanjing, Jiangsu 210016, China
*
E-mail: [email protected]
Received: 12 August 2015 / Accepted: 16 October 2015 / Published: 1 December 2015
Herein we reported the synthesis and lithium storage performance of mesoporous Co3O4 microrod from a Co-based metal-organic framework (MOF). Firstly, Co-based MOF with rod-shape was synthesized by a solvothermal method. Secondly, porous Co3O4 microrod was synthesized through high-temperature thermolysis of Co-based MOF in the air. Pure phase structure and microrod morphology are investigated through XRD and SEM/TEM analysis. The rod with a length of 1~2 µm and a width of about 100 nm, respectively, was composed of clustered Co3O4 nanoparticles with sizes in the range of 20-30 nm. The porous Co3O4 material with micro/nanostructure shows superior lithium storage performance. The capacity of Co3O4 electrode retained 762 mAh g-1 after 100 cycles at a rate of 0.1 A g-1. Even when cycled at a current density of 3 A g-1, a comparable capacity of 450 mAh g-1 could be achieved. The improved electrochemical performance might be attributed to the 1D porous micro-/nanostructure, which provides a shorter transfer path for Li+ and the alleviation of the mechanical stress induced by volume change during repeated charge-discharge cycles.
Keywords: oxides; nanostructures; heat treatment; electrochemical properties
1. INTRODUCTION
the transitional metal oxide family, is considered to be a promising candidate to substitute conventional graphite anode for the next generation LIBs due to its high theoretical capacity (892 mAh g-1), ease of fabrication and environmental benignity [3-5]. Upon a charge-discharge process, however, the Co3O4 substitute suffers from large volume variation and subsequently particle break, which may lead to capacity fading and poor cycling performance. Additionally, the lower conductivity of Co3O4 also causes an added performance degradation, especially to be cycled at a higher current density [6-7]. To address this problem, one effective way is to synthesize micro/nano hierarchical structures composed of nanoparticles, which can combine with the advantages of both nanoparticles and micrometer-sized assemblies [8-10]. Among them, porous microrods assembled by nanoparticles can provide short diffusion paths for electron/ion transfer, which is favorable to the enhancement of Li storage performance. Particularly, porous micro-/nanostructures can not only benefit to prevent the pulverization of active materials, but also can buffer the volume change in the process of charging and discharging.
Recently, some coordination polymers with metal-organic frameworks (CPs, also named MOFs) have been selected to generate porous nanostructural materials. For example, highly porous carbon for supercapacitors was synthesized by using a Zn-based MOFs as sacrificial templates and carbon precursors [11-12]. Very recently, spindle-like mesoporous -Fe2O3 for high-rate lithium batteries was prepared by a two-step calcination of a Fe-MOF (MIL-88) [13]; porous Co3O4 hollow dodecahedra with excellent lithium storage performance has been fabricated through controllable calcination of a Co-based MOF [14]. The advantage of MOF as template or precursor is that they can offer unique metal-organic framework architecture, regular shape and porosity. To date, Co3O4 with porous micro/nanostructures such as hollow spheres, nanoneedles, nanosheets and some other specific morphology have been synthesized through various methods [15-18]. However, there has been limited success in finding a facile and reliable method for the synthesis of Co3O4 porous microrods with high specific capacity and high rate performance.
Herein, we report a synthesis of Co3O4 porous microrods composed of uniform nanoparticles from Co-based MOFs. Firstly, rod-like Co-MOF crystal formulated as [(CH3)2NH2][Co3(BTC)(HCOO)4(H2O)]·H2O (BTC=1,3,5-benzenetricarboxylate) was synthesized by a solvothermal method based on reported works [19]. Secondly, mesoporous Co3O4 microrods were successfully prepared from the Co-based MOF through a one-step solid-state calcination procedure. This strategy is facile and reproducible. More importantly, when tested as anode material, the porous Co3O4 microrod exhibits improved electrochemical performance.
2. EXPERIMENTAL SECTION
All chemicals are commercially available and used without further purification.
2.1 Synthesis of Co-based MOF crystal
mixed solvents including 10 mL H2O and 5 mL DMF and magnetically stirred for 0.5 h. The solution was then transferred to a 30 mL Teflon-lined stainless steel autoclave, which was heated gradually to 120 oC at a rate of 10 oC h-1 and maintained at this temperature for 5 days. After cooling down to room temperature at a rate of 2 oC h-1, the product was collected by centrifugation, washed with distilled water and DMF three times, then dried in a vacuum oven at 60 oC for 12 h.
2.2 Preparation of porous Co3O4 microrod
The resultant Co-based MOF powder was placed in a tube furnace under air gas flow, heated to 550 oC with a heating rate of 4 oC min-1, and maintained at this temperature for 2 h. After calcination, the furnace cooled to room temperature naturally. Finally, the black power of Co3O4 microrods was obtained.
2.3 Characterization
The crystal phase of the synthesized samples was characterized with an X-ray powder diffractometer (Bruker D8 advance) with Cu Kα radiation (λ = 1.5406 Å). The thermogravimetry (TG) analysis was performed on a thermogravimetry analyzer (NETZSCH STA 409) under an air flow at 10 o
C min-1 from 50 to 800 oC. An X-ray photoelectron spectrum was taken on an Amicus X-ray photoelectron spectrometer using an Al Kα X-ray as excitation source and choosing C 1s (284.6 eV) as the reference line. The morphology and composition of the samples was studied by a field emission scanning electron microscope (FESEM, Hitachi S4800) and transmission electron microscopy with an accelerating voltage of 200 kV (TEM, JEOL JEM-2100), respectively. Energy-dispersive spectroscopy (EDS) analysis was taken by the energy dispersive X-ray spectrophotometre attached to the Hitachi S4800. The nitrogen adsorption/desorption isotherm were measured with an ASAP 2010 (Micromeritics Instruments) surface area and pore size analyzer.
2.4 Electrochemical Measurements
3. RESULTS AND DISCUSSION
The schematic illustration for the synthesis of porous Co3O4 microrods is shown in Scheme. 1. First, the Co-MOF with rod-like morphology was synthesized by coordination of Co2+ with H3BTC under the solvothermal condition. A subsequent one-step thermal conversion process of the prepared Co-MOF precursor directly results in the formation of porous Co3O4 microrods.
[image:4.596.123.472.386.674.2]Scheme 1. Schematic illustration for the synthesis of porous Co3O4 microrods based on Co-based MOF
[image:5.596.117.473.463.611.2]
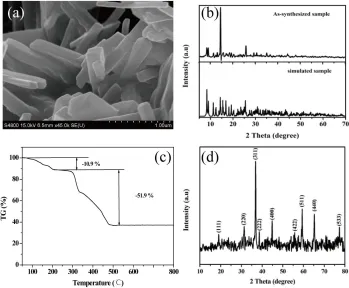
The formation of a rod-like Co-MOF was confirmed by the FESEM and PXRD, as shown in Fig. 1. The size and morphological features of as-prepared Co-MOF were investigated by field-emission scanning electron mircoscopy (FESEM). It can be clearly seen from Fig. 1(a) that the as-synthesized Co-MOF predominantly consists of uniform microrods with their typical size in the range of 1-2 m in length and 100-300 nm in width. Fig. 1(b) presents the power XRD pattern of the Co-based MOF and its simulated results, which was obtained with data analysis tool Mercury Co-based on the crystallographic data of CCDC No. 724747. All the diffraction peaks of the synthesized Co-based MOF in the 2θ range of 5-70° match well with the simulated pattern. This result indicates that the Co-MOF synthesized here is identical with reported work [19]. The thermal stability of the as-synthesized Co-MOF was investigated by thermogravimetric analysis (TGA) under temperatures ranging from 50 to 800 oC (Fig. 1(c)). The resulting TGA curve was comprised of two main thermal events: firstly, the initial weight loss of about 10.9 % up to 220 oC mainly due to the elimination of free (CH3)2NH2 and water molecules. The observed values match well with the calculated value (10.48%). Secondly, the weight loss of about 51.6 % occurred from 220 oC to 500 oC, which is attributed to the decomposition of metal-organic framework and the formation of Co3O4. On the basis of performed TGA results, the resultant Co3O4 materials could be synthesized by one-step calcination process for the as-synthesized Co-MOF at 550 oC. To verify the crystal structure and phase purity of the decomposed product, its powder XRD pattern was examined and the result was shown in Fig. 1(d). All the diffraction peaks can be indexed to a pure phase spinel Co3O4 with a face-centered cubic structure (JCPDS card No. 43-1003, space group: Fd3m, lattice constant a = 8.084 Å). No other peaks of impurities were observed, suggesting that the product is of high purity.
Figure 2. Co 2p (a) and wide scan (b) XPS spectra of Co3O4 microrod
to characteristic peaks of C 1s, O 1s, Co 2p2/3, and Co 2p1/2. The major peak of O 1s observed in Fig. (2b) is 530.2 eV, which also corresponds to the standard Co3O4 spectra.
Fig. 3(a) and 3(b) shows the panoramic view of obtained Co3O4 products from different magnified FESEM images. It demonstrates that the microrod shape of precursor does not change after calcination. The Co3O4 products still retain the rod-like morphology of the Co-MOF crystals. However, the size is reduced due to the removal of organic moieties during the pyrolysis process. Additionally, the images reveal that the surfaces of Co3O4 nanorods are extraordinary rough compared to the precursor because of the large amount of weight loss. Meanwhile, the energy dispersive spectroscopy (EDS) analysis results shown in Fig. 3(c) suggest that only Co and O components are present (Au, C and Si came from the conductive glue and the substrate of silicon chip). More details of the microstructure are investigated by TEM images (Figure 3(d) and 3(e)).
[image:6.596.167.441.270.723.2]
The results indicate that the Co3O4 microrods are composed of numerous nanoparticles with a size in the range of 20-30 nm. The microrods have rough surfaces and form porous networks due to the interconnection of nanoparticles, which are in accordance with the SEM observation. The length of each rod is estimated to be 1~2 µm with a diameter of approximately 200 nm. Both the small nanoparticles and the pores are critical to the enhanced electrochemical performance of this material, and will be further discussed later. It is common that carbonaceous species in the MOF structure transform to amorphous carbon in the process of thermal treatment, which may as well contribute to the electrochemical performance. For the inspection of carbon residual in the Co3O4 microrod, high-resolution TEM images (Fig. 3(f) and 3(g)) were taken near the rod edge of Co3O4 samples. It can be seen that there is no obvious amorphous carbon layer was found in the sample. Furthermore, selected area electron diffraction (SAED) pattern for the sample reveals good crystallinity nature of Co3O4 nanostructure (Fig. 3(h)). The results further confirm the as-synthesized product is pure cobalt oxide.
Figure 4. Nitrogenadsorption/desorption isotherms of Co3O4 nanorods and corresponding BJH size distribution plots (inset)
[image:7.596.139.447.308.546.2]
To explore the advantages of the porous Co3O4 microrods, we studied their electrochemical properties as anode material for LIBs. Firstly, we performed the initial three consecutive cyclic voltammetry (CV) curves of the Co3O4 electrode at a scan rate of 0.1 mV s-1, as shown in Fig. 5(a). In the first cathodic scan, there was an intense reduction peak located at 0.9 V, corresponding to the initial reduction of Co3O4 to metallic Co accompanying the formation of amorphous Li2O. Additionally, another weak peak appears at about 1.2 V, which is due to the formation of solid electrolyte interphase (SEI) film and the associated electrolyte decomposition [20-22]. Meanwhile, in the first anodic scan, a broad peak was located at about 2.1 V, which is ascribed to the oxidation of metallic Co to Co3O4 and the decomposition of Li2O. From the second cycle, the reduction peak shifts to a higher potential of about 1.13 V, while there is not much deviation in the oxidation peak position. The well-overlapped curves of the successive cycles indicate a good reversibility of electrochemical reactions. The reversible electrochemical reaction can be summarized as follows:
Co3O4 + 8Li+ + 8e- ⇄4Li2O + 3Co (1)
[image:8.596.126.465.469.719.2]Fig. 5(b) shows the initial three charge-discharge voltage curves at a current density of 100 mA g-1 with a voltage of 0.01-3.0 V, which is consistent with typical charge-discharge voltage curves of Co3O4. The initial discharge and charge capacities are found to be 1307.8 and 1031 mAh g-1, respectively, leading to a relative low irreversible capacity loss of 21.2%. The irreversible capacity loss of 276.8 mAh g-1 is noted during the first cycle, which parallels CV measurements. The columbic efficiency of first cycle is 78.8%, which is higher than those recently reported by others [18,23-24]. The phenomenon of irreversible capacity loss is normal for the conversion type anode materials and the reasons are mainly ascribed to irreversible Li consummation originating from inevitable formation of SEI film at the electrolyte interface and decomposition of electrolytes [25-26].
The discharge capacity versus cycle number of the Co3O4 electrode at a current density of 100 mA g-1 is shown in Fig. 5(c). The initial discharge capacity is 1347.4 mAh g-1. During the subsequent 10 cycles, the capacity of the electrode experiences a gradual rise, which could be attributed to the reversible formation of a gel-like layer by electrolyte decomposition at low potentials or further lithium storage as a result of interface reaction in the process of activation and stabilization of the electrode [27-28]. After these cycles, the capacity gradually levels off and keeps much more stable. The columbic efficiency can be steadily maintained at 95%. At the end of 100 cycles, a stable capacity of about 762 mAh g-1 can be retained, which is much higher than that of the commercial graphite anodes (372 mAh g-1) and those of reported Co3O4 nanostructures [29-31]. The improved reversible specific capacity and the superior cycle performance of the Co3O4 electrode may be attributed to the mesoporous micro-/nanostructure of Co3O4 nanorods, since their interior space can alleviate the mechanical stress induced by the volume change during the electrochemical reaction, thus leading to a high efficiency of the lithiation and delithiation process.
In addition to high specific capacity and excellent cyclability, the rate capability is also one of the most important factors for practical application of electrode materials. Fig. 5(d) compares the rate capabilities (at various densities from 0.1 A g-1 to 3 A g-1) of the Co3O4 electrode. It can be found that the discharge and charge capacities remain stable and decrease regularly with an increased rate. This decrease could be mainly attributed to less participation of the active material as only the surface of the active material is involved in the electrochemical reaction [32]. The discharge reversible capacities at 0.1, 0.2, 0.5 and 1 A·g-1
are about 1307.8, 1016.2, 920.9 and 800.9 mAh g-1, respectively. Even at a high current density of 3 A g-1, the discharge capacity of 450 mAh g-1 was still retained, implying the excellent rate capability of the Co3O4 electrode. Interestingly, when the current density is decreased from 3 A g-1 to 0.1 A g-1, the discharge capacity can be recovered to about 1009.7 mAh g-1, which reveals that the porous Co3O4 microrod electrode has excellent electrochemical reversibility and structural stability.
We believe that the excellent electrochemical performance is strongly related to the unique micro-/nanostructure of porous Co3O4 microrods with a variety of favorable features. First, the 1D structure of Co3O4 microrods ensures fast electronic transport and provides shorter pathways for Li+ ions insertion/extraction, which enhances the reaction kinetics of Co3O4 at different rates. Second, nanocrystals could provide more grain boundaries for lithium insertion, which is favorable to obtain an ultrahigh reversible capacity [33]. Third, the porous structures could enhance the contact area between the electrode and electrolyte, allowing better penetration of the electrolyte, and accommodate the large volume change induced by lithium insertion/extraction, thereby enhancing the cycling stability.
4. CONCLUSION
performance when used as anode materials for LIBs. It delivers a reversible capacity of 762 mAh g-1 at a current density of 100 mA g-1 after 100 cycles; the cycling reversible capacity can keep 450 mAh g-1 even at a high current density of 3 A g-1. Significantly, the facile solid-state thermolysis route from MOF precursor can be easily extended to other porous metal oxides materials with well-defined morphologies and structures, which may hold great promise for the construction of advanced electrodes in energy storage and conversion.
ACKNOWLEDGEMENTS
This work was supported by the Natural Science Foundation of Jiangsu Province under grant No. BK200740 and a Project Funded by the Priority Academic Program Development of Jiangsu Higher Education Institutions.
References
1. J.M. Tarascon and M. Armand, Nature, 414 (2001)359
2. A.S. Arico, P. Bruce, J.M. Tarascon and W. Vanschalkwijk, Nat. Mater., 4 (2005)366 3. P. Poizot, S. Laruelle, S. Grugeon, L. Dupont and J.M. Tarascon, Nature, 407 (2000) 496 4. H. Huang, W.J. Zhu, X.Y. Tao, Y. Xia, Z.Y. Yu, J.W. Fang, Y.P. Gan and W.K. Zhang, ACS
Appl. Mater. Interfaces, 4 (2012)5974
5. G. Binotto, D. Larcher, A.S. Prakash, Urbina R. Herrera, M.S. Hegde and J.M. Tarascon, Chem. Mater., 19 (2007) 3032
6. Y.G. Li, B. Tan and Y.Y. Wu, Nano Lett., 8 (2008) 265
7. J. Chen, X.H. Xia, J.P. Tu, Q.Q. Xiong, Y.X. Yu, X.L. Wang and C.D. Gu, J. Mater. Chem., 22 (2012) 15056
8. F. Fang, L. Bai, Y.G. Liu, S.B. Cheng and H.Y. Sun, Mater. Lett., 125 (2014) 103
9. Z.S. Wu, W.C. Ren, L. Wen, L.B. Gao, J.P. Zhao, Z.P. Chen, G.M. Zhou, F. Li and H.M. Cheng, ACS nano, 4 (2010) 3187
10. X.H. Xia, J.P. Tu, Y.J. Mai, X.L. Wang, C.D. Gu and X.B. Zhao, J. Mater. Chem., 21 (2011) 9319 11. B Liu, H. Shioyama, T. Akita and Q. Xu, J. Am. Chem. Soc., 130 (2008) 5390
12. S.J. Yang, T. Kim, J.H. Im, Y.S. Kim, K. Lee, H. Jung and C.R. Park, Chem. Mater., 24 (2012) 464
13. X Xu, R Cao, S Jeong and J Cho, Nano Lett., 12 (2012) 4988
14. R.B. Wu, X.K. Qian, X.H. Rui, H. Liu, B. Yadian, K. Zhou, J. Wei, Q.Y. Yan, X.Q. Feng, Y. Long, L.Y. Wang and Y.Z. Huang, Small, 10 (2014) 1932
15. X. Wang, X.L. Wu, Y.G. Guo, Y.T. Zhong, X.Q. Cao, Y. Ma and J.N. Yao, Adv. Funct. Mater., 20 (2010) 1680
16. X.W. Lou, D. Deng, J.Y. Lee and L.A. Archer, J. Mater. Chem., 18 (2008) 4397
17. C.Z. Yuan, L. Yang, L.R. Hou, L.F. Shen, X.G. Zhang and X.W. Lou, Energy Environ. Sci., 5 (2012) 7883
18. X.W. Lou, D. Deng, J.Y. Lee and L.A. Archer, Adv. Mater., 20 (2008) 258
19. Y. Fu, J. Su, S.H. Yang, G.B. Li, F.H. Liao, M. Xiong and J.H. Lin, Inorg. Chim. Acta, 363 (2010) 645
20. X.Y. Yao, X. Xin, Y.M. Zhang, J. Wang, Z.P. Liu and X.X. Xu, J. Alloys. Compd., 521 (2012) 95 21. Y. Liu, C.H. Mi, L.H. Su and X.G. Zhang, Electrochim. Acta, 53 (2008) 2507
22. W.Y. Li, L.N. Xu and J. Chen, Adv. Funct. Mater., 15 (2005) 851
24. P.P. Su, S.C. Liao, F. Rong, F.Q. Wang, J. Chen, C. Li and Q.H. Yang, J. Mater. Chem. A, 2 (2014) 17408
25. J.H. Liu, J.S. Chen, X. Wei, X.W. Lou and X.W. Liu, Adv. Mater., 23 (2011) 998 26. H.B. Wu, J.S. Chen, H.H. Hng and X.W. Lou, Nanoscale, 4 (2012) 2526
27. Y. Yu, C.H. Chen, J.L. Shui, S. Xie, Angew. Chem. Int. Ed., 44 (2005) 7085
28. K.M. Shaju, F. Jiao, A. Debart and P.G. Bruce, Phys. Chem. Chem. Phys., 9 (2007) 1837 29. Y. Wang, H. Xia, L. Lu and J.Y. Lin, ACS Nano, 4 (2010) 1425
30. Y.G. Li, B. Tan and Y.Y. Wu, Nano Lett., 8 (2008) 265
31. J. Zheng, J. Liu, D.P. Lv, Q. Kuang, Z.Y. Jiang, Z.X. Xie, R.B. Huang and L.S. Zheng, J. Solid State Chem., 183 (2010) 600
32. K. Zaghib, J.B. Goodenough, A. Mauger and C. Julien, J. Power Sources, 194 (2009) 1021 33. W.J. Yu, P.X. Hou, F. Li, J. Liu, J. Mater. Chem., 22 (2012) 13756