Int. J. Electrochem. Sci., 14 (2019) 6045 – 6064, doi: 10.20964/2019.07.65
International Journal of
ELECTROCHEMICAL
SCIENCE
www.electrochemsci.org
Evolution of the Corrosion-inhibiting Efficiency of Novel
Hydrazine Derivatives against Corrosion of Stainless Steel 201
in Acidic Medium
A. S. Fouda1,*, S. A. Abd El-Maksoud2, A. El-Hossiany3, A. Ibrahim1
1 Department of Chemistry, Faculty of Science, El-Mansoura University, El-Mansoura-35516, Egypt, 2 Department of Chemistry, Faculty of Science, Port Said University, Port Said, Egypt.
3 Delta Fertilizers Company in Talkha, Egypt *E-mail: asfouda@hotmail.com
Received: 4 March 2019 / Accepted: 5 May 2019 / Published: 10 June 2019
The corrosion inhibition effectiveness of some hydrazine derivatives (HD) as corrosion inhibitors for stainless steel (SS 201) in 1.0 M HCl had confirmed using chemical and electrochemical methods. The studies were achieve at various temperatures (25-45oC). The thermodynamic parameters were determined. HD have been found to be more effective corrosion inhibitors at lower temperatures. Adsorption isotherm was determined and was found to follow Langmuir’s adsorption isotherm. Inhibition efficiencies at different HD concentrations were determined using chemical and electrochemical techniques. Polarization data revealed that these HD act as mixed-kind inhibitors. Morphology of the surface was examined utilizing Fourier transform infrared (FTIR) and atomic force microscopy (AFM). The obtained inhibition efficiency from different techniques were in a high agreement, confirming the validity of the used all techniques for stainless steel corrosion in hydrochloric acid medium.
Keywords: Corrosion inhibition, Adsorption, SS 201, HCl, AFM, FTIR
1. INTRODUCTION
inhibitor molecules and metal surfaces. In this concern, organic compounds corrosion inhibitors have been assumed to be suitable as ecofriendly in inhibiting severe corrosion attack which caused due to hetro atom existence with the metal surface, hence, retarding the redox reactions that takes place, as it shown greater inhibition that linked to the presence of electron donor atoms (heteroatoms) such as N,S,O,….etc that containing lone pair of electrons or containing other clouds of Л electrons in aromatic rings, long carbon chain length as well as triple bond in their molecular structures that shared with the active sites on the SS 201 surface during these redox reactions [5, 6]
Organic compounds are outstanding for their productivities as corrosion protection and those including "N" have frequently mentioned to in the literature [7-9], imines [10], dioxan-water mixtures [11], quaternary ammonium, salts based on 2-acetylallylchloride [12], 2-mercapto benzimidazole [13], Ethoxylated fatty alcohols[14], Schiff base compounds [15], pyrrole and its derivatives [16], Pyrazolo carbothioamide [17], 1,3-Thiazolidin-5-one [18], Pyrazolone [19], Distyryl [20]. The current study reports the performance of HD. The objective of this study is to examine the inhibiting behavior of some hydrazine derivatives on the corrosion of SS 201 in 1.0M HCl utilizing chemical and electrochemical tests. The surface morphology of SS 201was also analyzed.
2. MATERIALS AND TECHNIQUES 2.1 Materials and Solutions
The metal sample conformation in weight % is: Si 1, C 0.15, Cr 16-18, Ni 3.5-5.5, N 0.25, S 0.03, P 0.06, Mn 5.5-7.5 and Fe the rest
2.2 Inhibitor
[image:2.596.43.570.565.740.2]The inhibitors were prepared in the research laboratory according to an earlier designated investigation method, characterization of these inhibitors was done using, NMR, IR spectra and elemental analysis. The structural formula of the studied inhibitors is recorded in Table 1.
Table 1. Chemical assemblies of the studied organic compounds
Inhibitor Structures,
Names
Mol. Formulas, Mol. Weights
A N N
CH3 CH3
1-(1-(cyclohexa-2,4-dienyl)ethylidene)-2-(1-phenylethylidene)hydrazine
C16H18N2
B
N N
1-benzylidene-2-(cyclohexa-2,4-dienylmethylene)hydrazine
C14H14N2
210.27
2.3. Chemicals and Solutions
SS 201 specimens were used. The corrosive solution used is HCl 37%. Solutions of 1.0 M HCl were prepared by dilution with distilled water. The HD stock solution 10-3 M was used to prepare (1 x10⁻⁶ - 21 x10-6 M).The HD inhibitors that used as a part of this research have listed in Table1.
2.4. Methods
2.4.1. Mass Loss (ML) Technique
For ML measurements, the metal coupons were cut into (2×2×0.2 cm) x 2 pieces, and were polished utilizing various grades of emery papers up to 1200 grit size. The pieces were cleaned by acetone and bidistilled water, dried utilizing filter papers, and then weighed. Seven pieces of SS 201 were hanging in test solutions without and with organic compounds utilizing suitable glass hooks. After definite interval time, the pieces were taken out from the solutions, rinsed, dried, and weighed again. The ML for each piece was then taken. The % IE of HD and surface coverage of SS 201 (θ) from ML tests were determined utilizing the next equation:
% IE = θ x 100 = [(Wº − W) ∕ Wº] ×100 (1) Where W is the ML of the metal with HD and Wois the ML of the metal without HD.
2.4.2 Potentiodynamic Polarization (PP) Technique
(PP) is a useful method because it gives more information about the corrosion mechanism and the factors affecting the corrosion process and inhibition behavior of the inhibitors. This is done by measuring the potential- current characteristics of the metal/ solution system. The potential range was (-1.0 to - 0.6V vs. SCE) at OCP with a scan rate 1 mVs-1.
2.4.3. EIS Tests
This technique was done by AC signs of 5 mV peak to peak amplitude and at frequency range of 105 Hz to 0.1 Hz. The (% IE) and θ were founded from eq. (2) [23]:
% IE = 100 x θ = 100 x [( Rct – R°ct )/ Rct] (2)
Where R°ct is the charge transfer resistance with HD and Rc is the charge transfer resistance
2.4.4. EFM Tests
This technique used two frequencies of range 2 and 5 Hz depended on three conditions [24]. The (icorr), (βc and βa) and (CF-2, CF-3) (Causality factors) were measure by the greater two peaks
[25].
The electrochemical techniques have been performed using PCI4-G750 Potentiostat/Galvanostat and a personal computer with Gamry PCI4-G750 software for calculations. The used electrical circuit consists of three electrodes (SCE reference electrode, Pt auxiliary electrode and SS 201 electrode). 1 cm2 of the SS 201 electrode is prepared, and cleaned as illustrated in ML method. The pre-immersion oxide film was reduced by given a time period of about 20 minutes for open circuit potential (OCP). All electrochemical studies were performed at 25 ±1 °C.
2.4.5. Surface Examinations
SS 201 pieces were dipped in testing solutions for one day. Then, they were polished, dried and analyzed by (FTIR) and (AFM).
3. RESULTS AND DISCUSSION
3.1. Potentiodynamic Polarization (PP) Tests
-1.0 -0.8 -0.6 -0.4 -0.2 0.0 1E-6
1E-5 1E-4 1E-3 0.01 0.1
Blank 1x10⁻⁶ M 5x10⁻⁶
M 9x10⁻⁶
M 13x10-6 M 17x10-6 M 21x10-6
M
lo
g
icorr
,
A
cm
-2
[image:4.596.178.417.425.618.2]E , mV ( vs. SCE )
Figure 1. PP curves of the SS 201 dissolution in 1.0M HCl with and without different concentrations of compound (A) at 25oC
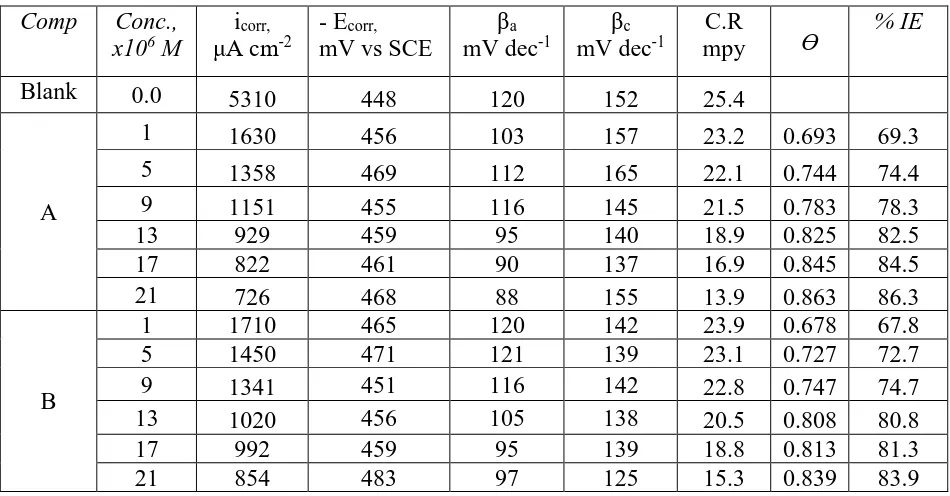
Tafel curves of SS 201 electrode in 1.0 M HCl with and without various contents of compound (A) can be studied from Figure 1. Similar curves were received for other compound (B) (not displayed). Table 2 shows the determined values of icorr., Ecorr., Tafel slopes (βa and βc), kcorr, θ and
as a mixed–kind inhibitor. icorr reduced through the HD addition to the corrosive solution. % IE and
(θ) were found from eq. (3):
% IE = θ x 100 = [(icorr – icorr(inh)) / icorr] x 100 (3)
Where, icorr is the current density in absence of HD and icorr in presence of HD. The order of HD
[image:5.596.61.536.211.459.2]according to % IE is being: A > B.
Table 2. PP parameters (icorr, Ecorr, βc, βa, kcorr, θ, and %IE) of SS 201 dissolution in 1.0M HCl with and
without different concentrations of HD at 25oC
Comp Conc., x106 M
icorr,
μA cm-2
- Ecorr,
mV vs SCE
βa
mV dec-1
βc
mV dec-1
C.R
mpy Ɵ
% IE
Blank 0.0 5310 448 120 152 25.4
A
1 1630 456 103 157 23.2 0.693 69.3
5 1358 469 112 165 22.1 0.744 74.4
9 1151 455 116 145 21.5 0.783 78.3
13 929 459 95 140 18.9 0.825 82.5
17 822 461 90 137 16.9 0.845 84.5
21 726 468 88 155 13.9 0.863 86.3
B
1 1710 465 120 142 23.9 0.678 67.8
5 1450 471 121 139 23.1 0.727 72.7
9 1341 451 116 142 22.8 0.747 74.7
13 1020 456 105 138 20.5 0.808 80.8
17 992 459 95 139 18.8 0.813 81.3
21 854 483 97 125 15.3 0.839 83.9
3.2 (EIS) Tests
From Figure 2 the semi-circle diameter had raised by increasing of compound (A) concentration.
Figure 3 indicates the utilizing circuit for fitting the obtained results [26]. Similar curves were received for other compound (not displayed). The Cdl and Y0 were founded from eq. (4) [27]:
Cdl = Y0ωn-1/ sin [n (π/2)] (4)
where ω = 2π fmax, fmax is the greater frequency and n is the exponential. Rct increases with the
rise of the double layer thickness [28]. From Table 3, the Cdl decline as a result of the replacement of
-20 0 20 40 60 80 100 120 140 160 0 10 20 30 40 50 60 Blank 1x10⁻⁶ M 5x10⁻⁶
M 9x10⁻⁶ M 13x10-6 M 17x10-6 M 21x10-6 M
Zima g , o h m cm -2
Zreal, ohm cm-2
0 5 10 15 20 25 0 2 4 6 8 10 Zima g Zreal
0.01 0.1 1 10 100 1000 10000 100000 1000000 1
10 100
Blank 1x10⁻⁶ M
5x10⁻⁶ M 9x10⁻⁶ M
13x10-6 M
17x10-6 M 21x10-6 M
lo g Z mo d , o hm c m -2
log F, Hz
-80 -60 -40 -20 0 Zph , deg
[image:6.596.57.555.70.278.2]Figure 2. EIS Bode and Nyquist curves for SS 201 in 1.0 M HCl with and without several concentrations of compound (A) 25oC
Figure 3. Circuit utilized for fitting the EIS data in 1.0 M HCl
Table 3. EIS parameters for SS 201 in 1.0 M HCl without and with different concentrations of HD at 25oC
Comp Conc., x 106 M
Rct,
Ω cm2
Cdl,
µFcm−2 θ %IE
Blank 0 23 393
A
1 72 148 0.681 68.1
5 79 142 0.709 70.9
9 98 133 0.765 76.5
13 118 128 0.805 80.5
17 128 120 0.820 82.0
21 155 115 0.852 85.2
B
1 68 158 0.662 66.2
5 73 151 0.685 68.5
9 90 145 0.744 74.4
13 111 138 0.793 79.3
17 122 124 0.811 81.1
[image:6.596.147.449.343.429.2] [image:6.596.132.470.528.757.2]
3.3. (EFM) Tests
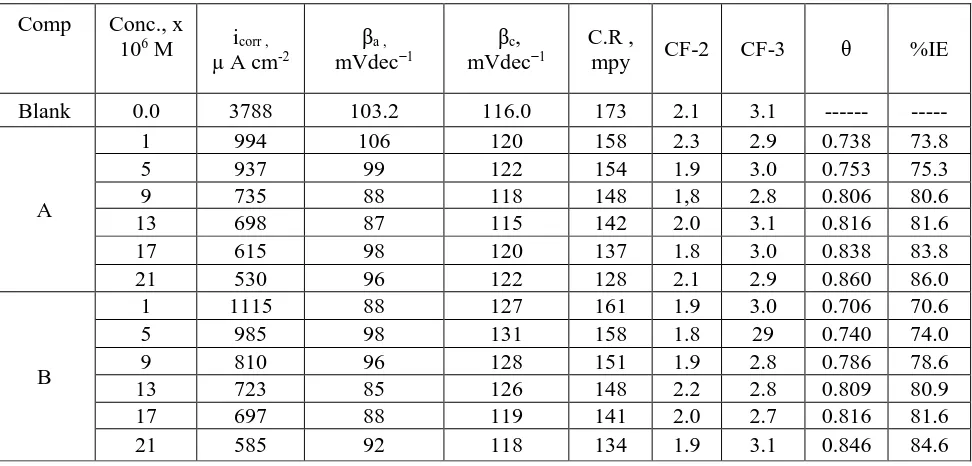
EFM is characterized by speed and greatly accuracy in calculating the current data [30]. Figure 4 indicates the EFM of SS 201 in 1.0 M HCl solution and various concentration of HD. The EFM parameters such as (CF-2 and CF-3), (βc and βa) and (icorr) can be measured from the higher current
peaks. Similar curves were received for other compounds (not displayed). The CF is closer to the standard data proved the validity of the calculated data. The IE% increase with the raising of organic compounds concentrations. The order of HD according to % IE is being: A > B.
0.0 0.2 0.4 0.6 0.8 1.0 1.2 1.4 1.6 1E-9 1E-8 1E-7 1E-6 1E-5 1E-4 1E-3
0.0 0.2 0.4 0.6 0.8 1.0 1.2 1.4 1.6 1E-9 1E-8 1E-7 1E-6 1E-5 1E-4 1E-3
0.0 0.2 0.4 0.6 0.8 1.0 1.2 1.4 1.6 1E-9 1E-8 1E-7 1E-6 1E-5 1E-4 1E-3
0.0 0.2 0.4 0.6 0.8 1.0 1.2 1.4 1.6 1E-8 1E-7 1E-6 1E-5 1E-4 1E-3
0.0 0.2 0.4 0.6 0.8 1.0 1.2 1.4 1.6 1E-8 1E-7 1E-6 1E-5 1E-4 1E-3
0.0 0.2 0.4 0.6 0.8 1.0 1.2 1.4 1.6 1E-9 1E-8 1E-7 1E-6 1E-5 1E-4 1E-3
0.0 0.2 0.4 0.6 0.8 1.0 1.2 1.4 1.6 1E-8 1E-7 1E-6 1E-5 1E-4 1E-3 Cu rr e n t( A) Frequency(Hz) 1X10⁻⁶ M Cu rr e n t( A) Frequency(Hz) 5X10⁻⁶ M Cu rr e n t( A) Frequency(Hz)
9X10⁻⁶ M
Cu rr e n t( A) Frequency(Hz)
13X10-6 M
Cu rr e n t( A) Frequency(Hz) 17X10-6 M Cu rr e n t( A) Frequency(Hz)
21X10-6 M
C ur re nt (A ) Frequency(Hz) Blank
Figure 4. EFM specra for SS 201 in 1.0 M HCl without and with of various concentrations of compound (A) at 25oC
Table 4. EFM parameters for SS 201 in 1.0 M HCl without and with various HD concentrations at 25oC
Comp Conc., x
106 M icorr ,
µ A cm-2
βa , mVdec−1
βc, mVdec−1
C.R ,
mpy CF-2 CF-3 θ %IE
Blank 0.0 3788 103.2 116.0 173 2.1 3.1 --- ---
A
1 994 106 120 158 2.3 2.9 0.738 73.8 5 937 99 122 154 1.9 3.0 0.753 75.3 9 735 88 118 148 1,8 2.8 0.806 80.6 13 698 87 115 142 2.0 3.1 0.816 81.6 17 615 98 120 137 1.8 3.0 0.838 83.8 21 530 96 122 128 2.1 2.9 0.860 86.0
B
[image:7.596.148.451.218.433.2] [image:7.596.60.546.540.773.2]
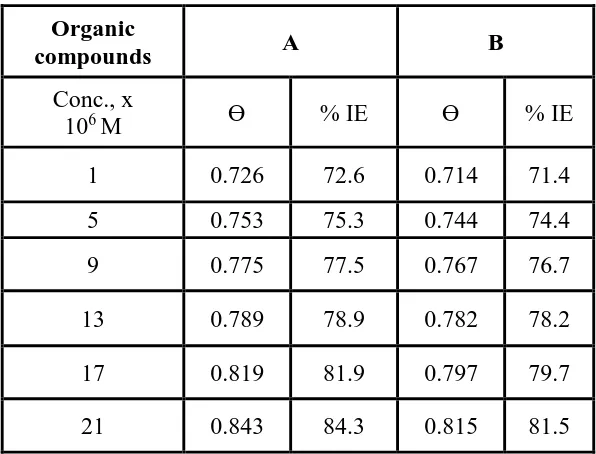
3.4. Mass Loss (ML) Tests
The loss in mass of SS 201 can be studied in the presence of HD at 25°C. Figure 5 shows that the presence of HD decreases the mass loss and therefore corrosion rate. The (%IE) and then θ, of the HD for the SS 201 were founded by eq. (1) [31]. Similar curves were received for other compound (not displayed). The values of %IE are given in Table 5. The order of HD according to % IE is being: A > B.
20 40 60 80 100 120 140 160 180 0
1 2
Blank
Wei
ght l
oss
,m
g cm
-2
Time (min)
1 x 10 -6
5 x 10 -6
9 x 10 -6
13 x 10 -6
17 x 10 -6
21 x 10 -6
30 60 90 120 150 180 0
2 4 6 8
[image:8.596.181.418.199.397.2]Figure 5. ML-time curves for the corrosion of SS 201 in 1.0 M HCl without and with various concentrations of compound (A) at 25oC
Table 5. CR and %IE of SS 201 in 1.0 M HCl in absence and presence of various concentrations of studied HD after 120 min immersion at 25oC
Organic
compounds A B
Conc., x
106 M Ɵ % IE Ɵ % IE
1 0.726 72.6 0.714 71.4
5 0.753 75.3 0.744 74.4
9 0.775 77.5 0.767 76.7
13 0.789 78.9 0.782 78.2
17 0.819 81.9 0.797 79.7
[image:8.596.149.447.511.738.2]
3.5 Influence of Temperature
The temperature effect on SS 201 dissolution in corrosive solution without and with different HD concentrations has been studied in temperature range (25-45oC) by ML, as illustrated in Figure 6.
The Figure showed that the ML increases with raising the temperature at all HD concentrations. This may referred to molecules desorption from the metal surface at higher temperatures. Increasing of ML with temperature rising is suggestive of physical adsorption. Figure 6 shows %IE against concentration of compound (A) at different temperatures. As shown, %IE decreases with raising temperature at all HD concentrations. Table 6 shows the temperature effect on corrosion rate (CR), θ, and %IE of SS 201.
300 305 310 315 320
0 20 40 60 80 100 IE% T, K
[image:9.596.168.431.254.437.2]1x10⁻⁶ M 5x10⁻⁶ M 9x10⁻⁶ M 13x10-6 M 17x10-6 M 21x10-6 M
[image:9.596.124.473.528.766.2]Figure 6. The relationship between % IE and temperature at many concentrations of compound (A) for SS 201 corrosion in 1.0 M HCl
Table 6. Data of % IE, (θ) and (kcorr) for SS 201 corrosion after 120 min immersion in 1M HCl before
and after addition of various concentrations of compound (A) at various temperatures
%IE kcorr
mg cm-2 min-1 Weight loss
mg cm-2 Conc.
--
7.43 8.91 Blank 35 48.3 3.83 4.61 1 52.5 3.52 4.23 5 56.4 3.24 3.89 9 60.2 2.95 3.54 13 63.0 2.75 3.29 17 66.0 2.53 3.03 21--
9.93 11.91 Blank 40 44.5 5.51 6.61 1 49.2 5.04 6.04 5 52.2 4.74 5.69 9 55.3 4.44 5.32 13 58.0 4.17 5.01 17 60.9 3.88 4.66 21--
11.45 13.74 Blank 45 34.6 7.48 8.98 1 39.7 6.90 8.27 5 42.2 6.62 7.94 9 45.5 6.24 7.48 13 47.9 5.96 7.15 17 49.6 5.77 6.92 213.15 3.20 3.25 3.30 3.35 -2.2 -2.0 -1.8 -1.6 -1.4 -1.2 -1.0 -0.8
blank 1 M HCl 1 x 10⁻⁶
5 x 10⁻⁶
9 x 10⁻⁶
13 x 10 -6
17 x 10-6
21 x10-6
L o g kco rr , mg cm
-1 mi
n
-1
[image:10.596.121.474.72.478.2]1/T K-1
Figure 7. Log kcorr vs reciprocal of temperature plot for SS 201 in 1.0 M HCl without and with various
concentrations of compound (A)
The equation of Arrhenius (6) can be used to measure the activation energy (E*a) of the
activated complex [32]:
C.R. = A exp (-E*a / RT) (5)
where E*
a is activation energy and T is the absolute temperature. Using Figure 7, E*a can be
prove that the higher extents of HD impede corrosion effectively by raising the energy barrier of the activated complex and improve that the process is controlled by diffusion [33].
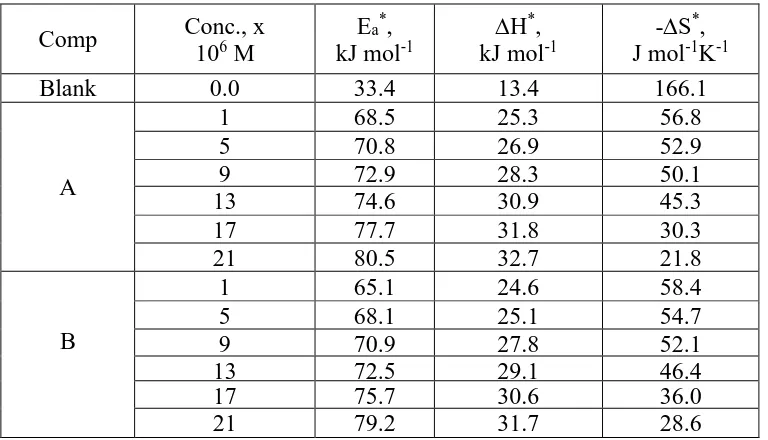
(Δ H*, ΔS*) are measured by eq. (7) [34]:
C.R. = RT/Nh exp (ΔS*/R) exp (-Δ H*/ RT) (6)
Figure 7 shows the relation between log (C.R. /T) and (1/T) which used to measure the values of ΔH* and ΔS*(Table 7).
The rise in the (ΔH*) with the presence of the HD reflects the rise in the energy barrier of the
corrosion process [35]. The negative values of ∆S* shows that during the rate-determining step in the
formation of activated complex is highly associated than dissociated [36].
3.15 3.20 3.25 3.30 3.35 -4.6
-4.4 -4.2 -4.0 -3.8 -3.6 -3.4
Blank R2 =98 1x10⁻⁶
M R2 =98 5x10⁻⁶
M R2 =99 9x10⁻⁶
M R2 =98 13x10-6 M R2=97 17x10-6
M R2 =99 21x10-6
M R2 =98
Log
( k
co
rr
/
T
)
,
mg
cm
-1 mi
n
-1 K
-1
[image:11.596.177.416.268.460.2]1000 / T K-1
[image:11.596.108.492.547.767.2]Figure 8. The relation between (log C.R. / T) and 1/ T diagrams for the SS 201 in 1.0 M HCl without and with different concentrations of compound (A)
Table 7. Activation parameters for SS 201 in 1.0 M HCl without and with various concentrations of HD
Comp Conc., x
106 M
Ea*,
kJ mol-1
∆H*,
kJ mol-1
-∆S*, J mol-1K-1
Blank 0.0 33.4 13.4 166.1
A
1 68.5 25.3 56.8
5 70.8 26.9 52.9
9 72.9 28.3 50.1
13 74.6 30.9 45.3
17 77.7 31.8 30.3
21 80.5 32.7 21.8
B
1 65.1 24.6 58.4
5 68.1 25.1 54.7
9 70.9 27.8 52.1
13 72.5 29.1 46.4
17 75.7 30.6 36.0
3.7. Adsorption Isotherms
Figure 9 represented the Langmuir isotherm, which used to calculate Ɵ values for compound (A). Similar curves were received for other compound (B) (not displayed).The Langmuir equation represented as follows [37].
C/Ө = 1/Kads + C (7)
Where Kads is the adsorption constant and C is the HD concentration (M). The ΔG◦ads and Kads
data are in Table 8. The ΔGo
ads founded by:
ΔGo
ads = - RT ln (55.5 Kads) (8)
The HD adsorption is spontaneous and this is proven by the ΔG°ads negative sign. From the
data of ΔGo
ads (around to -20 kJ mol-1), proven that the HD adsorption is physisorption [38].
Vant’t Hoff equation can be used to measure ∆H°ads and ∆S°ads [39] expressed by:
Ln K ads=−∆H°ads
RT +const (9) And eq. (10):
ΔGo
ads = ΔHoads - T ΔSoads (10)
Figure 10 shows the relation between ΔGoads and T. A negative sign of ΔSoads proved that the
disorder of corrosion process is decreases by using HD (Table 8) [40].
0.000000 0.000005 0.000010 0.000015 0.000020 0.000025
0.00000 0.00001 0.00002 0.00003 0.00004 0.00005
25 oC,R2 =0.99 30 oC,R2 =0.99 35 oC,R2 =0.99 40 oC,R2 =0.99 45 oC,R2 =0.99
C/
[image:12.596.105.479.388.679.2]Concentration,(g/L)
3.15 3.20 3.25 3.30 3.35 -0.30
-0.25 -0.20 -0.15 -0.10 -0.05
L
n
Kads
[image:13.596.172.421.76.279.2]1000/T,K-1
Figure 10. Variation of Ln Kads vs 1/T from Langmuir for the adsorption of compound (A) in 1M HCl
Table 8. Langmuir data for SS 201 in 1.0 M HCl without and with various concentrations of HD at (25oC- 45oC)
Comp Temp., K
-∆G°ads
kJ mol-1
-∆H◦ads
kJ mol-1
-∆S◦ads
J mol-K-1
A
298 20.1
38.5
75
303 19.9 71
308 19.7 65
313 19.2 63
318 18.8 61
B
298 19.8
29.4
73
303 19.4 69
308 18.8 63
313 18.4 61
318 18.3 60
3.8. (AFM) analysis
[image:13.596.153.446.377.569.2]
(a)Blank
[image:14.596.71.527.70.519.2]
(b)Comp. (A) (c)Comp. (B)
Figure 11. (a) 3D AFM image of SS201 immersed 1.0M HCl for 1day, (b) 3D AFM image of SS 201 immersed in 1.0M HCl+21x10-6M of compound (A) for 1 day, (c) 3D AFM image of SS 201 immersed in 1.0M HCl+21x10-6M of compound (B) for 1 day
Table 9. AFM parameters of investigated hydrazine derivatives (A and B) at 25oC Sample Roughness average (Sa), nm
Blank 512
A 241
B 297
[image:14.596.158.444.619.696.2]
3.9. (FT – IR) Analysis
Functional groups and characterizing covalent bonding knowledge had been identified by FT-IR which is an influential analytical device [43]. The finger print spectra of the compound (A) and the SS 201 surface after inundation in 1.0 M HCl + 21x10-6 to (A) for 180 min has achieved and compared to each other. (The same diagrams have achieved in the presence of the other compound (not shown). FTIR spectroscopy demonstrations, exciting features, for example power peak to noise ratio, great selectivity and little quantity of sample needed for the examination. Figure (12a and b) signify the IR spectrum of HD and the film produced on the SS 201. The FTIR of pure HD had shown Figure (12a) The -OH- frequency seems at 3407 cm-1, the C=O seems at 1646 cm-1,Aromatic ring seems at 744 cm -1,the –SH frequency seems at 2101 cm-1. The FTIR of the film coated on the SS 201 is displayed in
Figure (12b). The -OH is stretching frequency moves from 3407 cm-1 to 3416 cm-1. The –SH is
stretching moves from 2101 cm-1 to 2093 cm-1.
3500 3000 2500 2000 1500 1000 500
86 88 90 92 94 96 98 100
Free Inhhibitor Inhhibitor + metal
80 90 100 110
% Trans
mitt
an
ce
% Trans
mitt
an
ce
Wavenumber (cm-1)
(a)
(b)
Figure 12. FTIR spectra of inhibitor (A) stock solution (black line) and a layer of compound (A) adsorbed on SS 201 surface (red)
3.10. Quantum Chemical Calculations
The inhibition behavior of (HD) for SS 201 corrosion in acidic solution can be discussed by quantum chemical studies using DFT method. The optimized geometry, frontier molecular orbital of HOMO, LUMO and the distribution of Mullikan charge of (HD) are plotted in Figure 13, respectively. It is shown that, the distributions of electron density were localized on HOMO and LUMO of inhibitors confirms the electron donating and accepting centers are possible in (HD) molecules. The detailed data of quantum chemical parameters for (HD) are calculated and listed in Table 10. According to the DFT theory, the inhibition efficiency of the investigated inhibitor for SS 201 corrosion in acidic solution is related to the energy of lowest unoccupied molecular orbital (ELUMO),
the energy of highest occupied molecular orbital (EHOMO) and the energy gap ΔE (ΔE = ELUMO -
[image:15.596.144.452.321.517.2]
A) molecules can easily give electrons to the empty d-orbital of iron. But, the lower ELUMO values
show a higher electron accepting ability from the SS 201 metal. The smaller values of ΔE of compound (A) show the stability of formed complex on the SS 201 surface which determines the soft– soft interaction between the soft metal acid and the soft base inhibitor in the investigated system [45]. The Mullikan charge distributions of atoms for (compounds (A and B) obtained by DFT calculations are shown Figure 13. It is deduced that the more negative charge on heteroatoms, the more easily electrons donation and electrostatic attraction between the (HD) molecules and the SS 201 surface. From the quantum chemical analysis, it is found that, an agreement with the previously mentioned experimental data obtained by ML, PP, EFM, EIS tests.
Comp. HOMO LUMO Mulliken Charges
A
B
[image:16.596.108.489.239.465.2]Figure 13. HOMO and LUMO electronic densities distributions of compounds (A and B) in liquid phase.
Table 10. Quantum chemical parameters for compounds (A and B) in liquid phase.
Parameter Comp.(A) Comp.(B)
EHOMO(eV) -8.93 -9.03
ELUMO (eV) -0.27 -0.51
E (eV) 8.660 8.520
(eV) 4.330 4.260
(eV-1) 0.231 0.235
Pi (eV) -4.600 -4.770
(eV) 4.600 4.770
[image:16.596.141.454.554.756.2]
3.11 Mechanism of Inhibition
Four kinds of adsorption [46] may occur, including hydrazine derivatives at the interface of SS 201– solution: 1) Electrostatic attraction among the hydrazine molecules and SS 201; 2) Contact of unshared electron pairs in the hydrazine derivatives with the SS 201; 3) The interaction of metal π-electrons; 4) Summation of all the above. From the outcome data obtained from the various tests, corrosion hindrance of SS 201 in 1.0M HCl solutions by the hydrazine derivatives as designated from ML, PP, EFM and EIS tests were depended on the nature of the inhibitor and the dose. The sequence of IE is at: A > B. This order of the lowering in the IE of the tested compounds can be accounted for in terms of the polar influence [47]. A > B, this may be due to: the greater molecular size of (A) than (B) and the existence of the two donating groups (–CH3) group in the molecule. It is generally
considered that the surface of SS 201 had a positive charge in acid medium [48, 49], but it was establish that the surface of SS 201 carries negative charged in acid medium in the existence of hydrazine derivatives (because of the adsorption of Cl- ions on SS201) which allows the positively charged of hydrazine derivatives directly adsorb on the surface of SS 201 through electrostatic interaction.
The utilized HD as corrosion protection for SS 201 in 0.1 HCl was deliberated in terms of physical adsorption on the SS surface. This proved from the data of ΔGo
ads (less than 20 kJ mol-1) and
also from the effect of temperature (%IE decreases by raising temperature). This molecule hydrazine derivatives will present in the protonated form, so it can adsorb directly on the negative surface of SS 201 [50] in acidic medium by electrostatic attraction as shown below
[image:17.596.140.490.437.681.2]
Table 11. Performance comparison of some expired derivatives as corrosion inhibitors
Inhibitor Structure sample IE% References
1,4-Butanediamine Stainless steel 304 51 51
1,8-Octanediamine Stainless steel 304 58 51
Cetylpyridinium
bromide Carbon steel 87 52
Cetylpyridinium
chloride Carbon steel 81 52
4-Hydroxy coumarin Mild steel 61 53
organic compounds present work SS 201 86.3 This study
4. CONCLUSIONS
It was found that the percentage IE depends on the doses, and reached to higher data at higher dose of organic compounds, temperature and chemical structure of Organic compounds. The IE of the investigated organic compounds was in the order: A > B. The tested organic compounds behave as a mixed-kind corrosion protection in 1.0M HCl. The organic compounds acts among adsorption phenomenon and creation of barrier filmdue to lower in the Cdl with respect to the blank solution when
added these organic compounds are. The adsorption of investigating organic compounds on SS 201 obeys Langmuir isotherm. The percentage IE of surfactants gotten from the ML, PP curves, EIS and EFM techniques are in best agreement.
References
1. D.C. France, J Mater Eng. Perform, 25(9) (2016) 3580.
2. S.L. Cohen, V.A. Brusic, F.B. Kaufman, G.S. Frankel, S. Motakef and B. Rush, J. Vac. Sci. Technol. A., 8 (1990) 2417.
3. E.E. Ebenso, N.O. Eddy and A.O. Odiongenyi, Port. Electrochim. Acta., 27 (2009) 13. 4. T. Peme, L.O. Olasunkanmi, I. Bahadur, A.S. Adekunle, M.M. Kabanda and E.E. Ebenso,
Molecules, 20(9) (2015) 16004.
5. N.O. Eddy, H. Momoh-Yahaya and E.E. Oguzie, Journal of advanced research, 6(2) (2015) 203. 6. N.M. Abdel-Hady, G.T. M. Dawoud, A. A. El-Hela and T.A. Morsy, Journal of the Egyptian
Society of Parasitology, 41(3) (2011) 785.
7. S. Junaedi, A. Al-Amiery, A. Kadihum, A. Kadhum and A. Mohamad, Int. J. Mol. Sci., 14(6) (2013) 1915.
8. A. Kadhum, A. Mohamad, L. Hammed, A. Al-Amiery, N. Hooi San and A. Musa, Materials, 7 (6) (2014) 4335.
10.S.K. Rajappa and T.V. Venkatesha, J. Electrochem. Soc. Ind., 51(2) (2002) 54. 11.M.T. Mohammed, J. Electrochem. Soc. Ind., 551(2) (2002) 75.
12.D.A. Pisanenko and I.S. Pogrebova, Zh. Prikl. Khim. J., 75(8) (2002) 1248. 13.L. Wang, X. Pu-Jian and L. Hui-Chun, Corros. Sci., 45(4) (2003) 677. 14.M. Abdallah, Corros. Sci., 45(12) (2003)2705
15.C.E. Kaan and O. Atakol, Mater. Chem. Phys., 82(1) (2003) 188.
16.N. Mani, S. Venkatakrishna, L. Bahadur, Transactions of the SAEST, 38(2) (2003 )67. 17.A.S. Fouda, F.M. El-Taweel, M. Elgamil, Int. J. Electrochem. Sci., 12 (2017) 11397. 18.M. Abdallah1, M.M. Salem, B. A. AL Jahdaly, M.I. Awad, E. Helal and A.S. Fouda, Int. J.
Electrochem. Sci., 12 (2017) 4543.
19.M.A. Deyab, A.S. Fouda, M.M. Osmana and S. Abdel-Fattaha, RSC Adv., 7 (2017) 45232. 20.A.S. Fouda, T. Fayed, M.A. Elmorsi, M. Elsayed, J Bio Tribo Corros., 3(33) (2017) 1. 21.S.K. Shukla, M.A. Quraishi, E.E. Ebenso, Int. J. Electrochem. Sci., 6 (2011) 2912.
22.X.H. Pang, W.J. Guo, W.H. Li, J.D. Xie, B.R. Hou, Sci. China Ser. B-Chem., 51 (2008) 928. 23.R.W. Bosch, J. Hubrecht, W.F. Bogaerts, and B. C. Syrett, Corrosion, 57 (2001) 60.
24.S.S. Abdel–Rehim, K.F. Khaled and N.S. Abd–Elshafi, Electrochim. Acta, 51 (2006) 3269. 25.S.F. Mertens, C. Xhoffer, B.C. Decooman and E. Temmerman, Corrosion, 53 (1997) 381. 26.M. Lagrenée, B. Mernari, M. Bouanis, M. Traisnel and F. Bentiss, Corros. Sci., 44 (2002) 573. 27.F. Bentiss, M. Lagrenée, and M. Traisnel, Corrosion, 56 (2000)733.
28.E. Kus and F. Mansfeld, Corros. Sci., 48 (2006) 965.
29.D.Q. Zhang, Q.R. Cai, X.M. He, and G.S. Kim, Mater. Chem. Phys., 114 (2009) 612.
30.G. Trabanelli, in “Corrosion Mechanisms” (Ed. F. Mansfeld) Marcel Dekker, New York, (1987) 119.
31.A.S. Fouda, A. Abd El-Aal and A.B. Kandil, Desalination, 201 (2006) 216.
32.A. Fiala, A. Chibani, A. Boulkamh and K. Djebbar, Appl. Surf. Sci., 253 (2007) 9347.
33.W. Durnie, R.D. Marco, A. Jefferson and B. Kinsella, J. Electrochem. Soc., 146 (1999) 1751. 34.M.K. Gomma and M.H. Wahdan, Mater. Chem. Phys., 39 (1995) 209.
35.A.N. Frumkin, Advances in electrochemistry and electrochemical engineering, vol 3, chapter 5. Interscience Publisher Inc., New York, (1963).
36.F. Bensajjay, S. Alehyen, M. El Achouri, S. Kertit, Anti-Corros. Meth. Mater., 50 (2003) 402. 37.L. Tang, X. Li, Y. Si, G. Mu and G. Liu, Mater. Chem. Phys., 95 (2006) 29.
38.G. Mu, X. Li and G. Liu, Corros. Sci., 47 (2005) 1932.
39.B. Wang, M. Du, J. Zang and C.J, Gao, Corros. Sci., 53 (2011) 353.
40.S. Rajendran, C. Thangavelu and G. Annamalai, J. Chem. Pharm. Res., 4 (2012) 4836 41.A.S. Fouda, Y.M. Abdallah and D. Nabil, IJIRSET, 3 (2014) 12965
42.M. Abdallah, I. Zaafarany, S.O. Al-Karanee and A.A. Abd El-Fattah , Arabian Journal of Chemistry, 5 (2012) 225.
43. C.R. Jahromi, and K. Dehghanian, Int. J. Current Res., 9(1) (2017) 44630.
44.N. Kumar Gupta, C. Verma, R. Salghi, H. Lgaz, A.K. Mukherjeea, M.A. Quraishi, New J. Chem., 41 (2017) 13114.
45.Y. Wang and Y. Zuo, Corros. Sci., 118 (2017) 24.
46.D.P. Schweinsberg, A. Graeme and D.A. Steinert, Corros. Sci., 19(4) (1988) 28 47.A.S. Fouda, M. Abdallah and Z. El-Badrawy, Afri. J. Pure Appl. Chem., 5(8) (2011) 24. 48.G. Banerjee and S.N. Malhotra, Corrosion, 48 (1992) 10.
49.X. Li, X. Xie, S. Deng and G. Du, Corros. Sci., 87(2014) 27.
50.H. Patmore, A. Jebreel, S. Uppal, C.H. Raine and P. Mc Whinney, Am J Otolaryngol, 31(5)(2010) 376
51.A.S. Fouda, H.A. Mostafa, G.Y. Elewady and M.A. El-hashemy, Chem. Eng. Commun., 195 (2008) 934.
8.
53.S.R. Krishnamurthy, M.H.N. Parameswaran, ISRN Corros., 2013(2013) 1.