Int. J. Electrochem. Sci., 9 (2014) 3715 - 3724
International Journal of
ELECTROCHEMICAL
SCIENCE
www.electrochemsci.org
Red Algae – An Alternative Source of Carbon Material for
Energy Storage Application
Andrzej P. Nowak, Anna Lisowska-Oleksiak*
Chemical Faculty, Gdansk University of Technology, Narutowicza 11/12, 80-233 Gdańsk, Poland *
E-mail: [email protected]
Received: 20 February 2014 / Accepted: 18 March 2014 / Published: 14 April 2014
New electrode material obtained by pyrolysis of aquatic biomass macro (red algae) soaked with glucose solution has been characterized by SEM, EDX and Raman spectroscopy. Graphitized carbon was identified by Raman spectroscopy. Galvanostatic cyclic polarization of the materials in contact with 1M LiPF6 electrolyte in EC:DMC (1:1 v/v) and Li as a counter electrode was performed. Specific capacity of the novel material was enhanced in comparison with graphitic charge capacity. The best specific capacity was achieved for the sample with a carbon cluster size La of 39 Å and was equal to 578 mAh/g with capacity fading about 9 % for C/20 –rate.
Keywords: lithium ion battery, macro algae, anode material, aquatic biomass, electrochemistry
1. INTRODUCTION
Since 1991 when Sony introduced lithium ion batteries (LIB) for mobile electronic devices as an energy supply, the demand for novel materials has not been fully appeased. The need for varied type LIB still is increasing as expectations for further application in other fields becomes a reality [1-3].
The renewable resources come from every year crops in a form of biomass. Biomass precursors for lithium insertion anodes, dependently on the regional agriculture, are rice husk, oak, walnut or almond shells etc. [7].
Huge amount of macro algae produced each year by photosynthesis is not exploited as a source of carbonaceous matter. Although, aquatic biomass until now was offered as a binder for anode of LIBs eliminating other toxic chemicals [8]. The material, called alginate was extracted from brown algae, and testing has shown that in both graphite and silicon based electrodes, it increases both output and energy storage in the secondary electrochemical cell [8].
In this work we propose to use macro algae species namely red algae (Polysyphonia fucoides ) as a matrix and substrate for pyrolytic carbon. In purpose to enhance carbon content in a final product, glucose as an additional carbon precursor has been used. Red algae due to their pipe like structure are able to absorb any outer aqueous solution [9]. This feature is desired as may facilitate formation of small carbon clusters during pyrolysis of the biomass soaked with glucose solution. Red algae are occasionally covered by diatoms. Presence of porous silica from diatoms’ structures should help to avoid exfoliation of obtained carbonaceous material during exploitation in the cell. Improvement of electrochemical performance during electrochemical polarization was reported for SiO2 nanoparticle [10].
In this work we focus on synthesis and properties of electrode material produces from pyrolysed aquatic bio material.The biomass was collected in the southern part of Baltic Sea.
2. EXPERIMENTAL
2.1. Material synthesis
Material was prepared using red algae (Polysiphonia fucoides) from Baltic Sea as a precursor. Algae were mechanical cleaned firstly (manually, ultrasound bath). After mechanical cleaning, algae were chemically cleaned by shaking in 1M HCl solution for 24 hours followed by shaking in 1M NaOH solution to remove excess of HCl. Precursor was saturated with 0, 3, 5, 7 or 10 % wt. of glucose solution and named A1, A2, A3, A4 and A5, respectively. After saturation, the algae were dried for 24 hours and pyrolysed using tube furnace under argon atmosphere. Composites’ synthesis has been carried out at 900°C for 2h.
2.2. Electrode preparation
for 24 h at 80ºC. After drying the discs of 12 mm diameter (up to 2 mg of material) were cut of the tape and pressed for 30 sec with a load of 950 MPa. This electrode served as the working electrode in two-electrode Swagelok type testing cell. The lithium foil (99.9 % purity, 0.75 mm thickness, AlfaAesar) was used as the counter and reference electrode for two-electrode half-cell configuration. The glass fibre filter (Schleicher & Schüll, Germany) and 1M of LiPF6 dissolved in mixed solvent which was composed of the equal volumetric amount from of ethylene carbonate (EC) and dimethyl carbonate (DMC) (LP30 Merck, Germany) were used as a separator and an electrolyte.
In all cases the theoretical capacity of the composite material was assumed to be 372 mAh/g for active carbon in the material. Galvanostatic cyclic polarization were performed with a sequence of stages consisting of different charging/discharging (C/D) rates: at first supplying 4 cycles at 18.6 mA/g (C/20), then five polarising cycles at 37.2 mA/g (C/10), next 5 cycles at 64.4 mA/g (C/5) and 2 polarising cycles at 18.6 mA/g (C/20) holding potential limits from 0.05 V to 3 V. Second group of polarizing experiment was focused on fast charging/discharging rates where 4 cycles at 18.6 mA/g (C/20) were performed, next one hundred cycles at 372 mA/g (1C) followed two cycles at 18.6 mA/g (C/20).
2.3. Micro-Raman
Micro-Raman spectra were recorded on a Raman spectrometer inVia Renishaw (Renishaw, England) with an Ar ion laser at a wavelength of 514 nm.
2.4. Scanning electron microscopy
Scanning electron microscopy (SEM) micrographs were obtained using a Carl Zeiss EVO-40 Series instrument (Carl Zeiss AG, Germany) equipped with an EDX detector (EDS BRUKER AXS Quantax
3. DISCUSSION AND RESULTS
3.1 SEM and EDX studies
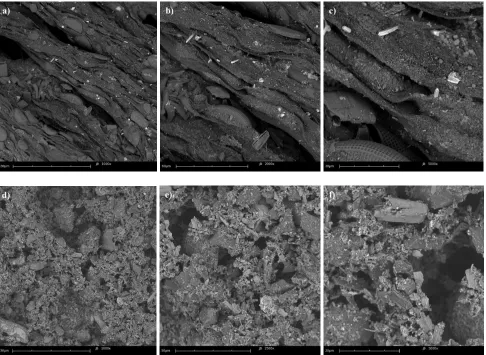
SEM micrograph of red algae before pyrolysis procedure is shown in Fig. 1.
Dried Polysiphonia fucoides (red algae) consists of long thin staples close to each other. It is complex tube-like structure. The branches are occasionally covered with diatoms (Diatomophyceae) of cylindrical and rectangular shape. The diatoms are a major group of algae. They are unicellular species which can exist as colonies. A unique feature of diatom cells is that they are enclosed within a cell wall made of hydrated silicon dioxide called a frustule [11].
[image:4.596.55.543.130.302.2] [image:4.596.58.544.370.725.2]
unchanged and the carbonaceous multilayered pipe-like structures are also very well preserved, see Fig. 2a and Fig. 2c.
Figure 1. SEM photography of red algae covered with diatoms at different magnification (a) 1000x (b) 2000x and (c) 4500x.
The milling procedure gives the material with the crushed cubic-like particles with the size of a few micrometers (see Fig. 2f.). Crushing is necessary and very important procedure which brings about increase active surface area required for sufficient current outcome.
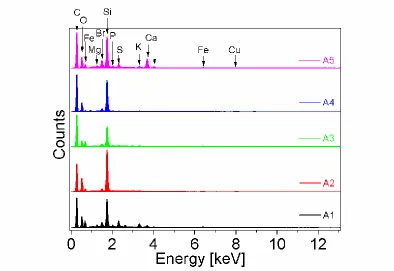
Figure 3. The EDX spectrum of pyrolysed algae of different composition
The EDX analysis exhibits that the materials consist mainly on carbon, silica and oxygen, see Fig. 3. Chemical composition of these bio-originating samples varied slightly. The amount of carbon changes from 62.00 to 72.22 atomic weight. The silicon content varies from 3.57 to 6.04 atomic weight. The oxygen and nitrogen content is in the range 15.29 – 25.77 %. However, the algae are known to be able to accumulate many heavy metals [12]. The other elements present in the studied samples are: sodium, magnesium, calcium, aluminium, iron, copper, sulphur, bromine and potassium in total amount varies from 0.1 to 0.65 at. %.
3.2. Raman Spectroscopy
[image:5.596.88.482.143.414.2][image:6.596.102.496.75.348.2]
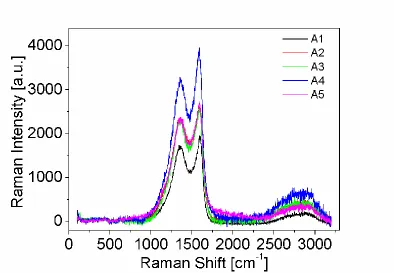
Figure 4. The Raman spectra of pyrolysed algae of different composition
Table 1. The in-plane correlation length of the materials.
Sample number Material (carbon and silicon content - % at. weight) La [Å]
A1 algae (62.60 % C, 3.86% Si) 43
A2 algae (62.00 % C, 6.04 % Si) 40
A3 algae (71.10 % C, 3.57 % Si) 42
A4 algae (72.22 % C, 4.60 % Si) 45
A5 algae (65.53 % C, 4.05 % Si) 39
The relative intensities of the lines (D and G) depend on the type of graphitic material. It is also known, that ratio of the intensities I(D) to I(G) varies inversely with La parameter for pure carbon materials, where La is in-plane correlation length:
a
L C G I
D
I ( )
) (
)
(
(1)
where C depends on the Raman laser excitation energy (for λ = 514.5 nm, C = 44 Å).
The La values, calculated using eq. 1, are gathered in Table 1. As can bee seen, the smallest parameter La was achieved for material A5 and is equal to 39 Å. The La parameter calculated for commercial graphite is about 4 times higher [15, 16].
belong to the terminate groups in the studied materials. The presence of terminal hydrogen is found to have impact on lithium ion intercalation capacity [17].
3.3. Electrochemistry
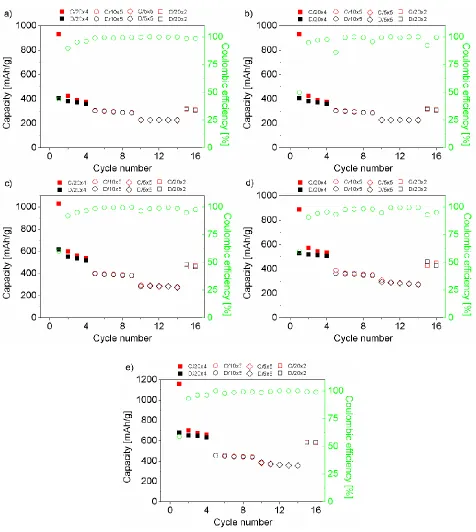
Figure 5. Cycling performance for the material a) A1, b) A2, c) A3, d) A4 and e) A5.
[image:7.596.60.536.154.686.2]
number of cycles are shown in Fig. 5 a-e. The all materials exhibit capacity drop for the first scan as expected for solid electrolyte interphase (SEI) formation [18].
The data for the first charge capacity (Qch), discharge capacity (Qrev), irreversible capacity (Qirrev) and irreversible capacity loss (ICP) are collected in Table 2. The average charge / discharge capacity for slow rate C/20 after 4 cycles is the lowest for A1 (~ 383 mAh/g) and the highest for A5 (~ 662 mAh/g). The capacity retention of A1 and A5 electrode materials are 93 and 90 %, respectively.
Table 2. Comparison of the first cycle charging/discharging capacity, irreversible capacity and irreversible capacity loss of the samples A1-A5.
Electrode material Qch [mAh/g] Qrev [mAh/g] Qirrev [mAh/g] ICP [%]
A1 930 407 523 56
A2 1016 507 509 50
A3 1026 618 408 40
A4 888 530 358 40
A5 1157 679 478 41
The average charge/discharge capacity for rate of C/10 after 5 cycles is 295 mAh/g and 448 mAh/g for A1 and A5, respectively. The capacity fading is equal to 7 % for the former and 4 % for the latter.
[image:8.596.62.542.516.624.2]Similar behaviour was observed for the material charged and discharged at C/5 rate. The discharge capacity for the last cycle (5th) was 228 mAh/g for A1 and 367 mAh/g for A5 with capacity retention of 99 % and 93%, respectively.
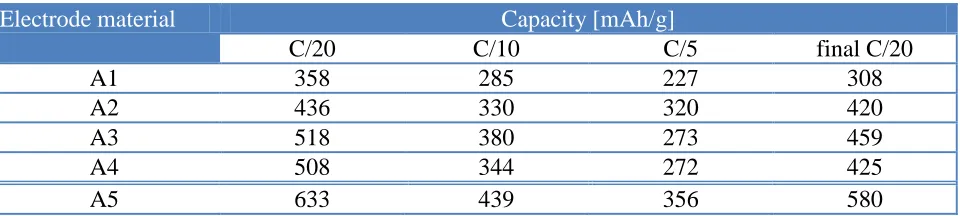
Table 3. The comparison of the capacity values of A1-A5 samples at different C – rates.
Electrode material Capacity [mAh/g]
C/20 C/10 C/5 final C/20
A1 358 285 227 308
A2 436 330 320 420
A3 518 380 273 459
A4 508 344 272 425
A5 633 439 356 580
The last two cycles was performed again for the rate of C/20. The final discharge capacity was 308 mAh/g for A1 and 580 mAh/g for A5. These values are of ~ 50 mAh/g lower if we compare them with the discharge capacity of the 4th cycle for C/20 rate.
Table 3 includes discharge capacities values of studied materials for varied C – rates.
mAh/g for A5 is 80 mAh/g higher in comparison to data obtained for A3 and A4. Even higher difference in the capacity (~ 130 mAh/g) is observed for the final insertion/extraction procedure.
Figure 6. The 1C – rate cycling performance for a) A1, b) A5 electrode material.
Data obtained for rates C/20 and 1C for A1 and A5 samples are shown in Fig. 6. The charge capacity measured for C/20 – rate is about 367 mAh/g and 605 mAh/g for A1 and A5, respectively. Fast charging and discharging (1C – rate) responds to capacity retention of 98 % after 100 cycles with charge capacity of ~ 178 mAh/g for the 100th cycle for A1 electrode material.
The A5 sample with capacity of 294 mAh/g (first 1C) exhibits not acceptable capacity fading of 157 mAh/g after 100 cycles. The remaining 137 mAh/g is still attractive considering application in lithium ion hybrid capacitors [19].
4. SUMMARY
The composite materials were obtained by means of pyrolysis of macro algae soaked with glucose solution.
The Raman spectra indicate the presence of disordered and graphitized carbons in all samples. The cluster diameter (La) value varies from 39 to 45 Å.
Electrochemical charging/discharging tests show very high first charge capacity, over 880 mAh/g, for rate of C/20. The irreversible capacity was in the range 358 – 523 mAh/g for all studied materials.
[image:9.596.62.537.133.300.2]
ACKNOWLEDGEMENTS
We gratefully acknowledge the financial support from the National Science Centre, Kraków, Poland (NN 1503/B/H03/2011/40).
References
1. P. Poizot, S. Laurelle, S. Grugeon, L. Dupond, J.M. Tarascon, Nature 407 (2000) 496
2. H.I Wang, L.F. Cui, Y.A. Yang, H.S. Casalongue, J.T. Robinson, Y.Y. Liang, Y.Cui, H.J. Dai, J. Am. Chem. Soc., 132 (2000) 13978
3. J.B. Goodenough, Y. Kim, Chem. Mater., 22 (2010) 587
4. E. Unur, S. Brutti, S. Panero, B. Scrosati, Micropor. Mesopor. Mat., 174 (2013) 25 5. L. Wang, Z. Schnepp, M.M. Titirici, J. Mater. Chem., 1 (2013) 5269
6. Y. Sheng-Hu, R. Demir-Cakan, M.M. Titirici, J.–O. Müller, R. Schlöngl, M. Antonietti, J. Maier, Angew. Chem. Int. Edit., 47 (2008) 1645
7. T.P. Kumar, T.S.D. Kumari, A.M. Stephan, J. Indian I. Sci., 89 (2009) 393.
8. I. Kovalenko, B. Zdyrko, A. Magasinski, B. Hertzberg, Z. Milicev, R. Burovyy, I. Luzinov, G. Yushin, Science, 334 (2011) 75.
9. T. Zalewska, J. Radioanal. Nucl. Chem., 299 (2014) 1489
10. K.C. Leonard, W.E. Suyama, M.A. Anderson, Electrochim. Acta, 56 (2011) 10137 11. J.A. Raven, Biol. Rev., 58 (1983) 179
12. K.B. Chekroun, M. Baghour, J. Mater. Environ. Sci., 4 (2013) 873 13. F. Tuinstra, J. L. Koenig, J. Chem. Phys., 53 (1970) 1126
14. A.C. Ferrari, J. Robertson, Phys. Rev. B, 61 (2000) 14095
15. Y. Wang, D.C. Alsmeyer, R.L. McCreery, Chem. Mater., 2 (1990) 557
16. M. A. Pimenta, G. Dresselhaus, M. S. Dresselhaus, L. G. Cancado, A. Jorio, R. Saito, Phys. Chem. Chem. Phys., 9 (2007) 1276
17. T.P. Kumar, T.S.D. Kumari, A.M. Stephan, J. Indian Inst. Sci., 4 (2009) 393. 18. C. Wang, A.J. Appleby, F.E. Little, J. Electroanal. Chem., 519 (2002) 9
19. J.H. Lee, W.H. Shin, S.Y. Lim, G.G. Kim, J.W. Choi, Mater. Renew. Sustain Energy, 3 (2013) 22 DOI 10.1007/s40243-014-0022-9