COMMISSION OF THE EUROPEAN COMMUNITIES
Green paper
T
OWARDS A
E
UROPEAN STRATEGY FOR ENERGY
SUPPLY SECURITY
A
NNEX1
TECHNICAL BACKGROUND DOCUMENT ON SECURITY OF
ENERGY SUPPLY
SUMMARY
The following summary brings together the principle conclusions of the European Commission’s Technical Background Document to this Green Paper. This document is available in its entirety from the Commission’s services.
The purpose of an EU energy supply security policy is to secure, for the EU, the immediate and longer term availability of a diverse range of energy products at a price which is affordable to all consumers (domestic and industrial) while respecting environmental requirements.
The current debate on energy supply security is conditioned by the following developments analysed below: a) energy demand is rising, both across the EU and candidate countries; b) demand for conventional energy sources (oil, natural gas, nuclear) is rising, c) demand for imported energy sources, such as oil and natural gas, is also rising and d) at least in the short term, without targeted measures, cleaner, more efficient and renewable energy technologies are unlikely to greatly influence these trends. The first challenge for energy supply policy is not to deny or over-dramatise this situation, but to manage it and prevent it developing into a crisis. The second challenge is to balance the need for energy supply policy to cover rising energy needs with environmental, political, social, technical and economic objectives. The third challenge is to develop instruments, such as new and renewable energy technologies, diversification measures and energy efficient practices, which will reduce dependence on imported fuels, cut energy demand, reduce the connection between economic growth and energy consumption and thus improve energy security in the long term.
European energy supply faces different forms of risk – physical, economic and environmental. Thus, there may be a short term physical disruption or a longer term, perhaps permanent, interruption to supplies of one or more energy sources, or of one or more fuels from a single geographical area. Economically, Europe is susceptible to changes in energy prices – such as the recent rises in the oil price. Finally, environmental pressures are beginning to bear on energy production and use and, ultimately, on supply decisions.
Context
policies (environment, economy etc) create new tensions and constraints for governments and administrations. On the one hand, they provide additional targets, as in the case of climate change and the Kyoto Protocol (see below), but on the other, they remove traditional regulatory instruments, such as the direct management of utilities by government, which is no longer applicable in the internal energy market.
These changes mean that it is necessary to look at the whole spectrum of energy supply and demand. This is the purpose of the current document. In general, the short (5 -10years) and medium (10 – 20 years) term. A secure energy supply depends not only on the security of a single energy source, but on the balance of energy markets and the possibility of replacing one source with another source or with other energy policy instrument (e.g. energy savings). Available options need to take into account not only energy supply objectives, but also the wider context outlined below.
At first sight, the aims of energy supply security, competitiveness, environment protection and liberalisation are not always fully compatible. Enlargement of the EU is a further challenge. The task for policy makers will be to reconcile these wider objectives with the aim of assuring secure energy supplies and to develop policies, incentives and instruments, for example energy efficiency, demand side management, diversification of fuel sources and new technology, which can serve shared goals.
Primary energy sources – oil
In terms of risk to security supply, oil remains the most important sources of energy. EU dependence on imported oil is starting to grow despite recent falls. The cost of producing oil in the Middle East is low and supplies in this area are relatively abundant. However, uncertainty surrounds future investment levels and physical availability of Middle East reserves. North Sea oil is expensive to exploit and reserves are limited – at best an estimated 25 years’ supply at current production levels. In the past, reductions in energy intensity and the replacement of oil in heat and power applications transformed the market for oil. Nonetheless, demand continues to rise. Unless a breakthrough is reached which removes the almost complete dependence of the expanding transport sector on oil, Europe’s reliance on Middle East – and OPEC - oil is likely to be virtually complete in the long term, providing that supplies are technically and geopolitically available. Decisive elements for future oil requirements are the dependence of the growing transportation sector on oil, the risk of price fluctuations, and the development of alternative transport fuels.
Natural gas
Europe’s increasing demand for imported natural gas will confirm the need for strong political and physical links to North Africa and Russia, and increase the attraction of suitable pipeline links to the Middle East and Central Asia. Enlargement is likely to confirm market trends for gas, while increasing the EU’s dependence on Russia’s vast reserves. As in other energy sectors, diversification of supply sources has to be a political priority.
increased prices. A set of measures aimed at promoting technological developments, supply diversification and gas-to-gas competition, integration of markets in a wider Europe as well as reinforced relations with external supply and transit countries could enhance supply security.
Solid Fuels
From an economic and energy supply viewpoint, coal is attractive. There are extensive world-wide reserves, including in Europe, and competitive markets keep prices low and stable. However, coal has been phased out from homes (in earlier “clean air” legislation) and, more recently, electricity generation, where gas is the preferred choice. Restructuring of the steel industry has also removed an important customer.
In the long term, coal is likely to remain of interest as new technologies come on stream which reduce extraction costs, reduce emissions and dramatically increase its efficiency. After the expiry of the ECSC Treaty in 2002, mechanisms will remain to monitor prices and promote clean technologies. Thus, it is likely that coal will continue to be used for electricity generation in the long term, to the benefit of energy diversity and security of supply.
Uranium (Nuclear energy)
Nuclear energy in the EU accounts for approximately 23% of installed electricity generation capacity but for 35% of electricity production. Nuclear electricity in Europe depends, with today's technology, on an imported raw material, uranium. The Euratom Treaty, which has security of nuclear fuel supplies as one of its objectives, provides for a specific policy instrument for nuclear fuel supplies via the Euratom Supply Agency. Sources of uranium are more diversified, geographically and physically, than oil and gas. The further steps of the nuclear cycle are largely domestic and, following recycling, the imported resource becomes a domestic resource.
Enlargement of the EU is likely to confirm this situation, because, in general, many of the applicant countries are in a similar situation to nuclear producers within the EU.
Nuclear energy has the attraction that it produces very few emissions of greenhouse gases. Maintaining nuclear energy’s current share in electricity generation would keep CO2 emissions in this sector to roughly their 1990 level but would require the construction by 2025 of 100 GWe (some 70 reactors) of nuclear capacity to replace reactors reaching their end of life and to meet increased demand. Keeping existing nuclear plants open for their normal lifetime of 40 years without building new ones would entail exceeding the 1990 emissions level by 4% (Source: Dilemma study). If existing nuclear plants were phased out and replaced with other conventional generating plant, it would become impossible to achieve Kyoto objectives.
Some Member States (Italy, Sweden, Germany, and Belgium) have decided to phase out nuclear. In others (France, UK, Finland), nuclear is due to remain a key energy for the foreseeable future. Looking beyond 2010, the long lead-in time for new nuclear energy technology means that it is essential to maintain long-term research, partly to find a solution to the problem of waste, and partly to hand down nuclear expertise to future generations.
Renewable energysources
Renewable energy sources (RES) are attractive to energy supply for environmental and geopolitical reasons. Although, in general, the fuel source is cheap or free, the technology has generally not reached a sufficiently mature stage in order to RES to be economically attractive. Theoretically, renewable energy has the potential to provide a safe, clean and affordable energy supply using indigenous sources, without threat of external disruption or exhaustion of reserves. The Commission has set a target to double the share of renewables from 6% (mostly large hydro) to 12% of total primary energy production in 2010. However, in order to reach this target, specific and targeted action will be necessary. As well as technical barriers, a major obstacle is the high cost of RES technologies compared to the cost of fossil fuels based technologies. This suggests the need for appropriate financial incentives to promote renewables. Another obstacle is the exclusion of external costs from the price of fossil fuels, coupled with an inheritance of subsidies on the part of conventional energies (including nuclear). This implies a distorted market to the detriment of RES. In those sectors where technology is more advanced, e.g. wind, costs have fallen dramatically over the previous decade and continue to fall.
With appropriate investment in the research, development, demonstration and promotion of renewable technologies, for short, medium and long term commercialisation, renewable energy has the potential to help to resolve, in an environmentally and economically acceptable way, many issues facing Europe’s long term energy supply. In particular, full development of renewable energy sources could play a large part in reducing greenhouse gas emissions from electricity production. However, this would require the early introduction of targeted measures, economic incentives and vigorous marketing.
Supply disruption
There are three sources of threats to secure energy supply – economic, physical and environmental, as described above. Disruptions to energy supply, whether actual or threatened, can have dramatic effects on society and the economy. Thus, the disruptions to oil supply in the 1970’s, which were both economic and physical, led to international action to improve supply security, through the (newly created) IEA and the EU. More recently, the principles of subsidiarity and liberalisation have underlined the responsibilities of Member States and utilities for governing their own stocks, reserve planning and crisis mechanisms in the event of a disruption to supplies. New crisis management systems may be developed as a result of liberalisation, as the roles of companies and regulators become more clearly defined. Oil is the focus of recent legislation which improved the quality of the EU’s strategic stocks of 90 days of consumption. Efforts are currently underway to improve the EU’s crisis management system. For gas, a committee has recently been established at EU level to monitor short and long term security of supply developments. For uranium and coal stocks, reporting mechanisms exist. In general, the impact of the single market and competition has been to put pressure on utilities to reduce their stockpiles.
Risks to energy supply can be quickly and cheaply addressed by reductions in energy demand. Managing energy demand is an important instrument in reducing consumption, preserving finite reserves, mitigating supply difficulties and facilitating sustainable growth. Energy intensity has been falling and is expected to decrease further, but electricity intensity will increase as the EU economy moves to more services and high added value activities. EU energy efficiency has gained 7% since 1990, but only 3% since 1993, although economic growth has resumed. Improvements in energy efficiency have failed to keep up with growing demand, such that consumption has continued to rise. Rising consumption, encouraged by rising purchasing power, increases pressure on energy supplies. In general, reducing demand is not a priority for privatised utilities. The risk is that, without new incentives and promotion of energy efficient products, consumer interest in energy efficiency will decline and the demand for new, more efficient technologies will decline.
Unless energy efficiency improvements keep pace with increased demand, increased demand will lead to higher consumption and greater strain on energy supplies. The recent trend has been that rises in consumption have outstripped investments in energy efficiency. For example, buildings are gradually becoming better insulated, but demand for other appliances and services, requiring increased energy use, often offset efficiency gains. Likewise, road vehicles have improved their efficiency, but cars have become bigger, heavier and with more energy-consuming devices. Despite significant increases in petrol prices recently, the number of cars and passenger kilometres is expected to rise. The challenge in this area is to reverse the trend of rises in consumption outstripping gains in energy efficiency.
The enormous potential for energy savings in the buildings and transport sectors indicates the progress which could be made in reducing consumption and improving supply prospects if these sectors were to be targeted. However this would require a combination of factors, such as energy prices which reflected wider costs to society, regulations to eliminate inefficient products or practices and consumer education. Nevertheless, the additional benefits of such action, for example in reducing emissions, cutting energy bills and creating jobs, argue for urgent action.
Fuel Balance
On the positive side, it is unlikely that the EU’s global energy market will be so dependent on a single sector as it was in the 1970’s, when oil accounted for over 60% of primary energy supply. This figure is now down to 44%. However, it remains the case that the transport sector’s almost complete dependence on oil, coupled with its stubbornly rising demand for oil and, consequently, dollars, is an Achilles’ heel for Europe’s economy. A further improvement in energy supply prospects is the creation in recent years of new European networks and decentralised generation. Further, the world energy market is now in many ways globally organised and interdependent, the result of which is that market changes affect economies similarly across the globe. Nevertheless, the EU’s control or influence over its energy supply could still be hampered, particularly in a risk situation, as a result of its growing dependence on imports from areas outside its traditional economic sphere. In the short and medium term, this appears to be a trend which affects all conventional energy sectors. It is therefore imperative that solutions should be found which increase diversity of fuel supply, give emphasis to reliable and stable external supplies and improve the viability of indigenous resources, while in parallel reducing the overall need for energy.
Energy technology will be critical in meeting the needs of current and future generations and de-linking economic growth from growing energy demand and environmental degradation, both in the present EU and in an enlarged Europe. In the energy field, technological change does not come cheap: research is expensive and requires a long development and lead-in period and the pay back is often uncertain. Successful marketing and consumer education are also key factors in translating technology know-how into viable products.
Governments have for many years recognised the need for intervention in the energy sector to provide the right incentives and price signals to firms and influence consumers’ awareness and behaviour. Thus, public funding, including from the European Community, often has a pivotal role in financing basic research, developing innovative technologies and promoting the substantial stock of energy-efficient technologies that are close to being competitive. There is also growing interest in seeking ways of increasing the impact and appeal of new technologies by combining them in large-scale collaborative projects which cut across conventional sectors.
Energy technology is a useful instrument of energy supply security and can complement objectives in other policy areas, in particular the environment and economics. It offers the means to improve energy efficiency, reduce energy intensity and vastly increase the share of clean, durable and renewable energy use. It also has potential to influence global patterns of energy use and production, as advanced European technologies can provide developing countries with more sustainable and less damaging means towards economic growth.
Transport of fuel into the EU (Transit)
The growing demand for external energy supplies will place additional pressure on existing supply routes and necessitate the development of new routes. This has implications for the availability and price of supplies. Secure energy supplies depend not only on the availability of reserves, but also on such factors as the capacity of countries to provide adequate quantities, the willingness of third countries to permit transit, the technical and financial resources to create and maintain transit routes and an international framework which creates stable trading conditions. The need to transport energy into Europe gives added emphasis to international co-operation, both between the EU and its suppliers and among suppliers and their neighbours, foreign policy, finance, trade agreements and technical collaboration. In this context, the Energy Charter Treaty and the Energy Charter process are important tools in creating a stable framework for energy supply and energy transit for the EU.
xxxxxxxx
A
NNEX2
N
OTE ON THE IMPACT OF FUEL TAXATION ON TECHNOLOGY CHOICEA Study Commissioned Within Framework Contract for Long Range Energy Modelling (ENER/4.1040/001) By Prof. P. Capros, N. Kouvaritakis, Dr. L. Mantzos, V. Panos and E. L. Vouyoukas Athens, November 2000
1. INTRODUCTION
The objective of this part of the study is to investigate the possible impact of fiscal intervention in the form of taxation or subsidies on energy consumer choices in EU Member States. In deciding on a type of equipment to invest, energy consumers start with a need for useful energy and consider alternative options taking into account their complete system costs including investment costs and fixed and variable operating and maintenance costs. Usually fuel costs form a large part of variable operating costs and taxation can substantially affect them. Clearly taxes and subsidies have often been applied precisely in order to influence choices. However it is also the case that in some instances the aims of the discrimination may refer to past policy considerations, the taxes and subsidies having survived through institutional inertia and as a revenue collection expedient without necessarily reflecting present policy concerns.
The analysis presented here utilises the latest data available on fuel taxation in EU Member States (as published by the European Commission in March 2000) and provisional data for fuel prices in 2000. Data on subsidies on coal are taken from the PRIMES model database (as they were determined after discussions with experts from the different Member States in the context of the Shared Analysis project).
The PRIMES model database was also the source for the technico-economic data on the different technologies used by energy consumers in computing the average production cost for the different energy uses.
Alternative fuels and technologies are examined in the following sectors:
1. Power generation
2. Steam generation by industrial boilers and CHP plants
3. Space heating in households
4. Private cars
Depending on the size of the equipment, economies of scale in terms of investment costs and fixed and variable operating and maintenance costs may be experienced differentially for different equipment types. The approach adopted obviously does not take into account such nuances.
Similarly bulk fuel purchases and conditions of delivery (for example interruptibility) may result in considerably lower unit fuel costs and conversely small deliveries may incur fixed surcharges. Such price modulation is normal, being based on delivery cost considerations and differs from fuel to fuel. It is not very marked for oil products which by their nature are easy to store, transport and handle but can be very pronounced for electricity, natural gas and coal. The latter’s price is also subject to very wide geographical variations, the proximity of suitable ports and other necessary transportation and handling infrastructure playing a decisive role in shaping total delivery costs which can in some instances be very substantial. Here again the condensation implied by “average” conditions leaves outside such considerations.
The base year for the analysis is 2000 when in many ways conditions in the energy markets have been very different from those that prevailed during the last decade (more precisely since 1991). Since early summer there has been a strong rally of international crude oil prices accompanied and often led by even stronger movements in spot prices of petroleum products and notably the key middle distillates. Natural gas import prices which are still to a considerable extent linked by pricing formulae to spot prices of petroleum products have been rising with the appropriate time lags but the increases to gas prices to the final consumers are still relatively modest. Coal prices on the other hand do not seem to have been affected. Since average yearly prices have been used for the analysis the picture that emerges from the above developments is of clear shifts in the competitiveness of different fuels in a rather transitional environment. Furthermore although high crude oil prices of around € 36 were assumed to the end of the year it would be very risky to conclude that relative prices and their competitive implications would remain as assumed here even in the next few years given the volatility of markets recently.
The above qualifications should serve as a note of caution against an over-interpretation of the results of the present analysis especially regarding absolute levels of costs. In general a relatively small difference in competitiveness should be taken as an indication of a high likelihood that under slightly different conditions (which are anyway uncertain for the reasons stated above) rankings could be reversed.
2. POWER GENERATION
For the purposes of the analysis concerning power generation eight typical technologies were selected:
• A Pressurised Fluidised Bed Combustion plant (PFBC) representing a clean coal technology which is currently widely available
• A monovalent lignite (brown coal) power plant fitted with de-sulphurisation units, which still represents the dominant choice for generating electricity from lignite. For Finland, Ireland and Sweden under this heading are included the peat fired plants
• A monovalent low sulphur heavy fuel oil plant
• A Combined Cycle Gas Turbine (GTCC) plant which due to very important capital cost reductions and spectacular increases in overall efficiency has become the prime choice for power production over a wide range of load requirements
• A monovalent thermal plant using biomass or waste as a fuel where the type and cost of the biomass varies from country to country depending on conditions arising from industrial structure (existence of industries producing usable waste), sufficient agricultural waste in adequate density per square kilometre, the possibility of using plantations etc.
• Solar photovoltaic cells which naturally represent small scale applications with availability differentiated according to three insulation zones (high, medium and low) corresponding approximately to the Mediterranean, mid-latitude and Northern European countries
• A large (over one GigaWatt) Pressurised Water Reactor nuclear power plant (PWR)
Production costs were computed for three different levels of power plant utilisation (7000 hours, 5000 hours and 2500 hours) corresponding indicatively to the utilisation rates of very heavy electricity intensive industrial plant, small scale industrial uses or energy intensive services and average household equipment utilisation.
Table 1 illustrates the production cost of the alternative power generation technologies operating at 7000 hours (figures in bold indicate the “least” cost solution). At this level of utilisation, Denmark apart, the most economic options appear to be GTCC and PFBC (imported hard coal fired) technologies. PFBC plants seem to enjoy a fairly clear advantage in Germany and Italy while GTCC an even more marked advantage in Belgium, the Netherlands, Finland and the United Kingdom. These differences are almost exclusively due to variation in the price of natural gas to power generators in the various countries. Even at these high utilisation rates the PWR nuclear generating technology option is uncompetitive in almost all EU countries due to very high capital costs. The only exception is France where streamlining of licensing and construction procedures, the existence of an adequate infrastructure and learning by doing experience has meant that construction times and hence costs are significantly lower than elsewhere in the EU. However even in France PWRs remain a reasonably competitive option only for such very high loads. Wind Power is an unambiguously attractive option in Denmark due to lower costs and an adequate policy support but fall significantly short of the most economic option in all other EU countries.
Table 1: Production cost of power generation technologies at 7000 hours PFBC (imported coal) PFBC (domestic coal) Monovalent Lignite Monovalent
Fuel oil GTCC
Monovalent biomass-waste Wind turbines* Solar photovoltaic* Nuclear
Austria 0.036 na 0.040 0.054 0.034 0.036 0.048 0.483 0.059 Belgium 0.032 na na 0.050 0.028 0.037 0.048 0.483 0.040 Denmark 0.037 na na 0.098 0.041 0.039 0.034 0.644 0.059 Finland 0.032 na 0.036 0.056 0.026 0.039 0.048 0.644 0.038 France 0.032 0.041 0.039 0.056 0.032 0.040 0.040 0.386 0.034 Germany 0.032 0.038 0.040 0.055 0.038 0.043 0.045 0.483 0.051 Greece 0.035 na 0.040 0.056 0.035 0.040 0.048 0.386 0.046 Ireland 0.032 na 0.037 0.050 0.032 0.045 0.048 0.644 0.047 Italy 0.032 na na 0.049 0.038 0.040 0.048 0.386 0.050 The Netherlands 0.036 na na 0.054 0.027 0.040 0.044 0.483 0.051 Portugal 0.032 na na 0.049 0.034 0.043 0.048 0.386 0.059 Spain 0.036 0.050 0.038 0.053 0.035 0.043 0.047 0.386 0.047 Sweden 0.036 na 0.039 0.087 0.033 0.034 0.048 0.644 0.047 United Kingdom 0.032 0.045 na 0.055 0.026 0.038 0.044 0.483 0.043
PFBC (imported coal) PFBC (domestic coal) Monovalent Lignite Monovalent
Fuel oil GTCC
Monovalent biomass-waste Wind turbines* Solar photovoltaic* Nuclear
Austria 0.036 na 0.040 0.049 0.034 0.036 0.072 0.640 0.059 Belgium 0.032 na na 0.049 0.028 0.037 0.072 0.640 0.040 Denmark 0.036 na na 0.049 0.029 0.039 0.067 0.853 0.059 Finland 0.032 na 0.036 0.049 0.026 0.039 0.072 0.853 0.038 France 0.032 0.041 0.039 0.049 0.032 0.040 0.072 0.512 0.034 Germany 0.032 0.041 0.040 0.049 0.035 0.043 0.068 0.640 0.051 Greece 0.035 na 0.040 0.048 0.035 0.040 0.072 0.512 0.046 Ireland 0.032 na 0.037 0.049 0.032 0.045 0.072 0.853 0.047 Italy 0.032 na na 0.049 0.034 0.040 0.072 0.512 0.050 The Netherlands 0.036 na na 0.050 0.026 0.040 0.072 0.640 0.051 Portugal 0.032 na na 0.049 0.034 0.043 0.072 0.512 0.059 Spain 0.036 0.050 0.038 0.051 0.035 0.043 0.071 0.512 0.047 Sweden 0.036 na 0.039 0.052 0.033 0.034 0.072 0.853 0.047 United Kingdom 0.032 0.045 na 0.049 0.026 0.038 0.072 0.640 0.043
Production cost (Euro'90/KWh) for power plant operating at 7000 hours
with excise taxes/subsidies
without excise taxes/subsidies
*For intermittent generating options the 7000 hours refer to availability of equipment and not overall availability which is clearly much lower and has been taken into account in the calculations
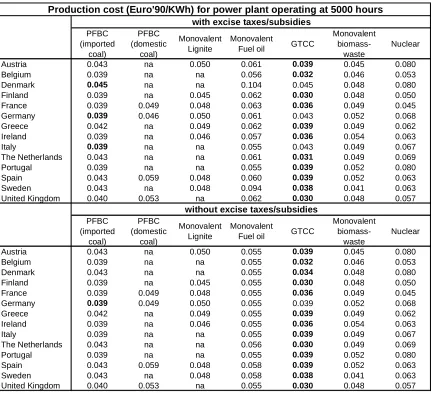
When examining the cost effectiveness of alternative solutions in power generation for plants operating at 5000 hours (see Table 2) it is clear that the low capital costs of GTCC renders this option even more attractive. The only countries where PFBCs retain a clear advantage are Germany and Italy mainly due to the excise taxes applied in these countries. Obviously this advantage is virtually neutralised in the case of removal of excise taxes and subsidies. All other plant types in the list considered are clearly unattractive irrespective of the presence or not of excise taxes and subsidies. The above result is explained by the fact that at lower operating levels the role of fuel price in total operating cost becomes less significant.
Table 2: Production cost of power generation technologies at 5000 hours PFBC (imported coal) PFBC (domestic coal) Monovalent Lignite Monovalent
Fuel oil GTCC
Monovalent
biomass-waste
Nuclear Austria 0.043 na 0.050 0.061 0.039 0.045 0.080 Belgium 0.039 na na 0.056 0.032 0.046 0.053 Denmark 0.045 na na 0.104 0.045 0.048 0.080 Finland 0.039 na 0.045 0.062 0.030 0.048 0.050 France 0.039 0.049 0.048 0.063 0.036 0.049 0.045 Germany 0.039 0.046 0.050 0.061 0.043 0.052 0.068 Greece 0.042 na 0.049 0.062 0.039 0.049 0.062 Ireland 0.039 na 0.046 0.057 0.036 0.054 0.063 Italy 0.039 na na 0.055 0.043 0.049 0.067 The Netherlands 0.043 na na 0.061 0.031 0.049 0.069 Portugal 0.039 na na 0.055 0.039 0.052 0.080 Spain 0.043 0.059 0.048 0.060 0.039 0.052 0.063 Sweden 0.043 na 0.048 0.094 0.038 0.041 0.063 United Kingdom 0.040 0.053 na 0.062 0.030 0.048 0.057
PFBC (imported coal) PFBC (domestic coal) Monovalent Lignite Monovalent
Fuel oil GTCC
Monovalent
biomass-waste
Nuclear Austria 0.043 na 0.050 0.055 0.039 0.045 0.080 Belgium 0.039 na na 0.055 0.032 0.046 0.053 Denmark 0.043 na na 0.055 0.034 0.048 0.080 Finland 0.039 na 0.045 0.055 0.030 0.048 0.050 France 0.039 0.049 0.048 0.055 0.036 0.049 0.045 Germany 0.039 0.049 0.050 0.055 0.039 0.052 0.068 Greece 0.042 na 0.049 0.055 0.039 0.049 0.062 Ireland 0.039 na 0.046 0.055 0.036 0.054 0.063 Italy 0.039 na na 0.055 0.039 0.049 0.067 The Netherlands 0.043 na na 0.056 0.030 0.049 0.069 Portugal 0.039 na na 0.055 0.039 0.052 0.080 Spain 0.043 0.059 0.048 0.058 0.039 0.052 0.063 Sweden 0.043 na 0.048 0.058 0.038 0.041 0.063 United Kingdom 0.040 0.053 na 0.055 0.030 0.048 0.057
Production cost (Euro'90/KWh) for power plant operating at 5000 hours with excise taxes/subsidies
without excise taxes/subsidies
The overall taxation burden on fuels for power generation is relatively low as there is a general reluctance to tax what is effectively an input to production. The only notable exception to this in most countries is the taxation on heavy fuel oil introduced in the past in response to the oil crises of the seventies and early eighties in order to accelerate substitution away from an insecure fuel form in a sector that was characterised by the presence of many alternatives. This process of substitution is now virtually completed and the disadvantages of fuel oil burning equipment compared with new types of plant presently available is such as to make it a highly unattractive choice for new equipment even without the taxes on the fuel. In this sense the tax is currently irrelevant with regard to fuel choices (and becoming increasingly so even as a revenue raising devise).
In general the dominance in terms of competitiveness of the GTCC option for widely varying utilisation rates is very marked in virtually all EU countries. This dominance is accentuated when taxes and subsidies are removed. Subsidies and supports on renewable forms of power and notably wind power play a significant role in enhancing their attractiveness. However with very few exceptions the costs of these technologies is still high and the level of support is not sufficient to make them into credible alternatives for wide use.
Table 3: Production cost of power generation technologies at 2500 hours PFBC (imported coal) PFBC (domestic coal) Monovalent Lignite Monovalent
Fuel oil GTCC
Monovalent
biomass-waste
Nuclear Austria 0.070 na 0.082 0.083 0.054 0.078 0.153 Belgium 0.065 na na 0.079 0.047 0.078 0.098 Denmark 0.071 na na 0.127 0.061 0.080 0.153 Finland 0.065 na 0.078 0.085 0.046 0.081 0.093 France 0.065 0.079 0.080 0.085 0.052 0.081 0.084 Germany 0.065 0.076 0.082 0.084 0.059 0.084 0.129 Greece 0.067 na 0.080 0.084 0.054 0.080 0.116 Ireland 0.065 na 0.078 0.079 0.049 0.086 0.119 Italy 0.065 na na 0.078 0.059 0.082 0.127 The Netherlands 0.070 na na 0.083 0.047 0.081 0.130 Portugal 0.065 na na 0.078 0.054 0.084 0.153 Spain 0.070 0.088 0.080 0.082 0.055 0.084 0.120 Sweden 0.070 na 0.080 0.116 0.054 0.068 0.118 United Kingdom 0.066 0.083 na 0.084 0.046 0.080 0.107
PFBC (imported coal) PFBC (domestic coal) Monovalent Lignite Monovalent
Fuel oil GTCC
Monovalent
biomass-waste
Nuclear Austria 0.070 na 0.082 0.078 0.054 0.078 0.153 Belgium 0.065 na na 0.078 0.047 0.078 0.098 Denmark 0.070 na na 0.078 0.050 0.080 0.153 Finland 0.065 na 0.078 0.078 0.046 0.081 0.093 France 0.065 0.079 0.080 0.078 0.052 0.081 0.084 Germany 0.065 0.079 0.082 0.078 0.055 0.084 0.129 Greece 0.067 na 0.080 0.077 0.054 0.080 0.116 Ireland 0.065 na 0.078 0.078 0.049 0.086 0.119 Italy 0.065 na na 0.078 0.055 0.082 0.127 The Netherlands 0.070 na na 0.078 0.046 0.081 0.130 Portugal 0.065 na na 0.078 0.054 0.084 0.153 Spain 0.070 0.088 0.080 0.080 0.055 0.084 0.120 Sweden 0.070 na 0.080 0.080 0.054 0.068 0.118 United Kingdom 0.066 0.083 na 0.078 0.046 0.080 0.107
Production cost (Euro'90/KWh) for power plant operating at 2500 hours with excise taxes/subsidies
without excise taxes/subsidies
3. STEAM GENERATION FROM INDUSTRIAL BOILERS
Four different types of industrial boilers were examined in the analysis i.e. boilers using coal, fuel oil, diesel oil and natural gas. In addition three characteristic Combined Heat and Power (CHP) plants: a PFBC burning hard coal, a fuel oil plant and a GTCC plant were also considered. The GTCC CHP can attain very high overall thermal efficiencies in electricity production and by injecting additional fuel into the waste heat boiler it can produce high temperature steam which can be used for the usual industrial steam applications. The method used for the computation of costs for CHP plants was to calculate the total cost of producing the steam together with the power and then deduct the value of the electricity produced. The benchmark used for the calculation of that value was the minimum cost per kWh as it is presented in tables 1 to 3 above. In other words it is representative of the minimum price at which the co-generation producer should reasonably expect to sell the power. Clearly if instead of selling outside the industrial unit, it was assumed that the electricity was used to satisfy own demand the avoided cost could be higher and the cost of the co-generated steam correspondingly lower.
Table 4: Production cost of steam generation from industrial boilers at 7000 hours
PFBC (imported
coal)
Monovalent
Fuel oil GTCC Coal Fuel oil Natural gas
Austria 0.008 0.031 0.006 0.018 0.024 0.017
Belgium 0.009 0.032 0.005 0.018 0.022 0.014
Denmark 0.009 0.085 0.014 0.019 0.047 0.022
Finland 0.011 0.041 0.003 0.022 0.026 0.014
France 0.005 0.036 0.005 0.024 0.026 0.016
Germany 0.005 0.034 0.014 0.037 0.023 0.019
Greece 0.006 0.032 0.005 0.020 0.026 0.019
Ireland 0.005 0.029 0.007 0.019 0.022 0.020
Italy 0.005 0.026 0.014 0.016 0.027 0.019
The Netherlands 0.015 0.038 0.004 0.018 0.025 0.015
Portugal 0.005 0.026 0.008 0.018 0.026 0.017
Spain 0.007 0.029 0.006 0.019 0.024 0.016
Sweden 0.009 0.072 0.005 0.018 0.041 0.017
United Kingdom 0.012 0.041 0.003 0.019 0.027 0.014
PFBC (imported
coal)
Monovalent
Fuel oil GTCC Coal Fuel oil Natural gas
Austria 0.008 0.024 0.006 0.018 0.021 0.017
Belgium 0.009 0.030 0.005 0.018 0.021 0.014
Denmark 0.013 0.029 0.004 0.015 0.021 0.015
Finland 0.011 0.032 0.003 0.015 0.021 0.012
France 0.005 0.026 0.005 0.024 0.022 0.016
Germany 0.005 0.026 0.009 0.037 0.021 0.017
Greece 0.006 0.023 0.005 0.019 0.023 0.018
Ireland 0.005 0.026 0.007 0.019 0.021 0.020
Italy 0.005 0.026 0.008 0.016 0.022 0.018
The Netherlands 0.016 0.033 0.003 0.018 0.022 0.014
Portugal 0.005 0.026 0.008 0.018 0.024 0.017
Spain 0.007 0.026 0.006 0.018 0.023 0.016
Sweden 0.009 0.028 0.005 0.018 0.023 0.017
United Kingdom 0.012 0.032 0.003 0.019 0.023 0.014
Boiler
CHP plant Boiler
Production cost (Euro'90/KWh) for CHP plant / boiler operating at 7000 hours with excise taxes/subsidies
Table 5: Production cost of steam generation from industrial boilers at 5000 hours
PFBC (imported
coal)
Monovalent
Fuel oil GTCC Coal Fuel oil Natural gas
Austria 0.012 0.034 0.006 0.021 0.026 0.017
Belgium 0.013 0.034 0.005 0.020 0.023 0.014
Denmark 0.007 0.081 0.008 0.021 0.048 0.022
Finland 0.015 0.044 0.004 0.024 0.028 0.014
France 0.008 0.038 0.005 0.027 0.027 0.017
Germany 0.006 0.034 0.011 0.039 0.024 0.020
Greece 0.010 0.035 0.006 0.023 0.027 0.020
Ireland 0.009 0.032 0.008 0.021 0.024 0.021
Italy 0.006 0.026 0.011 0.019 0.029 0.020
The Netherlands 0.019 0.041 0.004 0.020 0.026 0.016
Portugal 0.006 0.026 0.006 0.020 0.028 0.017
Spain 0.011 0.032 0.006 0.021 0.025 0.017
Sweden 0.013 0.075 0.006 0.020 0.043 0.017
United Kingdom 0.016 0.043 0.004 0.022 0.028 0.014
PFBC (imported
coal)
Monovalent
Fuel oil GTCC Coal Fuel oil Natural gas
Austria 0.012 0.026 0.006 0.021 0.023 0.017
Belgium 0.013 0.033 0.005 0.020 0.023 0.014
Denmark 0.016 0.031 0.005 0.018 0.023 0.015
Finland 0.015 0.035 0.004 0.018 0.023 0.012
France 0.009 0.029 0.005 0.027 0.023 0.017
Germany 0.006 0.026 0.006 0.039 0.023 0.017
Greece 0.010 0.026 0.006 0.022 0.024 0.019
Ireland 0.009 0.029 0.008 0.021 0.023 0.021
Italy 0.006 0.026 0.006 0.019 0.023 0.018
The Netherlands 0.020 0.036 0.004 0.020 0.023 0.015
Portugal 0.006 0.026 0.006 0.020 0.025 0.017
Spain 0.011 0.029 0.006 0.020 0.024 0.017
Sweden 0.013 0.031 0.006 0.020 0.024 0.017
United Kingdom 0.016 0.035 0.004 0.022 0.025 0.014
CHP plant Boiler
CHP plant Boiler
Production cost (Euro'90/KWh) for CHP plant / boiler operating at 5000 hours with excise taxes/subsidies
Table 6: Production cost of steam generation from industrial boilers at 2500 hours
PFBC (imported
coal)
Monovalent
Fuel oil GTCC Coal Fuel oil Natural gas
Austria 0.025 0.043 0.006 0.030 0.030 0.020
Belgium 0.027 0.044 0.007 0.029 0.028 0.017
Denmark 0.020 0.090 0.008 0.030 0.053 0.025
Finland 0.028 0.053 0.004 0.033 0.032 0.017
France 0.022 0.047 0.006 0.036 0.032 0.020
Germany 0.015 0.039 0.007 0.048 0.029 0.022
Greece 0.023 0.046 0.007 0.032 0.032 0.023
Ireland 0.025 0.043 0.011 0.031 0.028 0.024
Italy 0.015 0.031 0.007 0.028 0.034 0.023
The Netherlands 0.033 0.050 0.004 0.029 0.031 0.018
Portugal 0.020 0.036 0.006 0.029 0.032 0.020
Spain 0.024 0.041 0.007 0.030 0.030 0.020
Sweden 0.026 0.084 0.006 0.029 0.047 0.020
United Kingdom 0.029 0.052 0.004 0.031 0.033 0.017
PFBC (imported
coal)
Monovalent
Fuel oil GTCC Coal Fuel oil Natural gas
Austria 0.025 0.036 0.006 0.030 0.027 0.020
Belgium 0.027 0.043 0.007 0.029 0.027 0.017
Denmark 0.030 0.040 0.005 0.027 0.027 0.018
Finland 0.028 0.044 0.004 0.027 0.027 0.015
France 0.022 0.038 0.006 0.036 0.028 0.020
Germany 0.019 0.035 0.007 0.048 0.027 0.020
Greece 0.023 0.036 0.007 0.031 0.029 0.022
Ireland 0.025 0.041 0.011 0.031 0.027 0.024
Italy 0.019 0.035 0.006 0.028 0.028 0.021
The Netherlands 0.034 0.045 0.004 0.029 0.028 0.018
Portugal 0.020 0.036 0.006 0.029 0.030 0.020
Spain 0.024 0.038 0.007 0.029 0.029 0.020
Sweden 0.026 0.040 0.006 0.029 0.029 0.020
United Kingdom 0.029 0.044 0.004 0.031 0.029 0.017
Production cost (Euro'90/KWh) for CHP plant / boiler operating at 2500 hours with excise taxes/subsidies
without excise taxes/subsidies
CHP plant Boiler
CHP plant Boiler
The most striking observation than can be made by looking at the above tables is that CHP, in one form or another, appears to be cost effective compared to all steam-only boiler systems in all countries, for all three utilisation rates and irrespective of whether excise duties are included or not. This is clearly due to the very high overall efficiencies that characterise CHP systems and their very competitive costs. This often overwhelming advantage does not however imply that CHP is currently capable of sweeping the whole market for new steam raising equipment. A lot depends on whether an adequate institutional and regulatory regime is in place for facilitating sales of excess electricity into the grid. Furthermore CHP plants are characterised by considerable economies of scale which may inhibit their application for small-scale steam requirements.
however be qualified by the requirement that the plant should be located in areas with easy access to coal importing port facilities and at a considerable distance from inhabited areas for air quality reasons. Oil fired CHP is characterised by low conversion efficiencies and fails to compete successfully with coal (let alone gas) even for the low utilisation rates and even in the absence of excise duties.
As mentioned in the previous paragraph steam-only boilers suffer from considerable competitive disadvantages compared with CHP but the latter may not represent a valid option in all cases. The dominance of natural gas within the steam-only segment is if anything more complete than GTCC within the CHP. Even for very high utilisation rates and in countries where gas prices to industrial users are particularly high (Denmark, Italy, Ireland) the relative advantage of coal fired boilers is slight and is virtually wiped out once excise duties are removed. Concerning the 2500 hours per year utilisation rate heavy fuel oil boilers can be competitive in many countries vis-à-vis coal fired ones and definitely become so in the absence of excise duties. This however does not occur anywhere vis-à-vis the natural gas equivalents.
In general such excise duties and subsidies as exist in the industrial steam-raising sector seem to have some effect in encouraging coal use in cases of very high utilisation rates. It seems that these duty structures were designed to produce just this type of result in an effort to diversify supplies to industry in order to enhance energy security. The emergence of low capital cost gas technologies and especially GTCC CHP with very high overall thermal efficiencies has meant that most of the discrimination mentioned above has been to a large extent neutralised. Consequently fiscal measures seem to influence little the choices in this sector with the exception of some highly localised of its segments.
4. SPACE HEATING IN HOUSEHOLDS
[image:17.595.92.525.492.697.2]In evaluating the effect of excise taxes on household choice regarding space heating equipment three alternative technologies were examined, namely central heating equipment using gas oil, central heating equipment using natural gas and electric heat pumps. One representative dwelling type was considered (of a size of 90 square meters). Differences in weather conditions in different Member States were also taken into account since the severity of weather conditions influences the utilisation rate of installed equipment. Table 7 illustrates the results of the analysis.
Table 7: Annualised system costs cost for space heating in households
Gasoil Natural gas Electricity Gasoil Natural gas Electricity
Austria 614 533 1124 508 456 1041
Belgium 511 441 952 484 415 936
Denmark 875 821 1636 477 404 718
Finland 583 303 603 478 267 522
France 606 442 1092 489 437 1006
Germany 574 468 851 478 429 782
Greece 891 470 845 532 470 845
Ireland 525 478 708 459 478 708
Italy 1097 738 851 513 432 744
The Netherlands 558 460 806 467 353 611
Portugal 673 513 1219 574 513 1218
Spain 662 562 1035 550 553 1001
Sweden 824 448 911 495 448 719
United Kingdom 488 402 741 432 402 741
Production cost (Euro'90/toe-useful) for space heating
with excise taxes without excise taxes
Again natural gas central heating would seem to dominate choices of new systems to be installed in EU households. This statement must be qualified by two very important considerations:
and Denmark for different reasons have very small coverage. Even in mature residential gas markets all localities are not served by the network and extensions in some cases are unlikely in view of high costs and inadequate projected demand to justify them.
• As mentioned in the introduction the year 2000 has not been a very typical year in the sense that petroleum product prices like gas oil have increased very substantially while natural gas prices have followed suit very partially. Such differentials may not be sustainable even in the very near future.
Excise taxes appear to affect little the choices as far as the main competing systems (natural gas and gas oil fired) are concerned. The only clear reversals occur in Spain and Ireland where as mentioned earlier the residential gas distribution network is not sufficiently developed to make gas an option for the majority of cases anyway. The main reason for this relative insensitivity is that to a large extent taxation of fuels for household users seems to be non-discriminatory. This is especially the case in countries with very high taxation levels (Denmark and Italy) where excise taxes fall equally hard on the two main fuels.
This apparent stability of choices in the face of excise duties could be substantially eroded in a situation of low petroleum product prices (as was the case in the very recent past) with natural gas prices only slightly lower than the ones used in this study. In this case taxation designed to discourage the use of oil could be argued to be doing just that.
The electric heat pump alternative under the assumptions used in this study seems to be excluded on competitiveness grounds irrespective of excise taxation. However in the case of Finland and Sweden, given that the residential gas network is not developed, it could come within the valid option range on condition that taxes on gas oil are maintained (at punitive rates in the case of Sweden).
5. PRIVATE CARS
In the transport sector the analysis was restricted to the crucial sector of private cars which is currently overwhelmingly dominated by petroleum products (gasoline, diesel, LPG) and has attracted considerable policy attention both in terms of energy security (it being a major cause of growth in petroleum imports) but also in view of the very high externalities (congestion and environmental pollution) associated with it.
One representative “average” car in terms of size and accessories was considered. Countries were not differentiated in terms of average distance travelled, although such differences clearly exist, in order to maintain a measure of comparability across countries. However, issues regarding differences in terms of unit consumption across the different Member States were taken into account since they reflect a number of key factors such as driving conditions (urban versus non-urban travel, congestion on the roads etc) as well as consumer preferences in terms of vehicle power.
private vehicles was found to pose some difficulties and in addition they did not appear to be as significant as registration and road taxes.
Four engine types have been considered for the purpose of the analysis: standard gasoline, diesel, liquefied petroleum gas (LPG) available in limited distribution in most countries and methanol with virtually non-existent distribution network at present. The inclusion of the latter is justified by the fact that it represents the non-oil technology that is closest to market implementation at present. It was assumed that the methanol was derived from natural gas at an efficiency of 70% and that it was taxed at the same rate as gasoline in order to maintain fiscal neutrality. Diesel cars although more efficient than gasoline driven ones are heavier and more expensive than their gasoline alternatives. Likewise LPG and methanol driven vehicles are more costly to build than standard gasoline driven ones.
Two alternative cases as regards the annual mileage of cars were examined: 18000 km which is approximately the EU average for gasoline cars and 13000 km representing approximately the EU average for gasoline cars.
[image:19.595.141.511.315.726.2]The tables below present the cost comparisons between the different types of cars for the two utilisation rates, with and without excise taxes.
Table 8: Unit cost per km driven for average annual mileage of a gasoline car
Diesel Gasoline LPG Methanol
Austria 0.570 0.547 0.602 0.581
Belgium 0.626 0.618 0.635 0.649
Denmark 0.976 0.918 1.044 0.970
Finland 0.778 0.739 0.805 0.785
France 0.495 0.487 0.511 0.522
Germany 0.629 0.619 0.653 0.654
Greece 0.730 0.688 0.770 0.723
Ireland 0.884 0.841 0.915 0.874
Italy 0.426 0.409 0.447 0.439
The Netherlands 0.929 0.911 0.945 0.950
Portugal 0.592 0.553 0.634 0.588
Spain 0.490 0.470 0.547 0.496
Sweden 0.581 0.568 0.597 0.608
United Kingdom 0.726 0.702 0.726 0.743
Diesel Gasoline LPG Methanol
Austria 0.345 0.317 0.373 0.330
Belgium 0.344 0.314 0.370 0.328
Denmark 0.343 0.313 0.375 0.327
Finland 0.344 0.311 0.367 0.326
France 0.341 0.309 0.372 0.324
Germany 0.341 0.309 0.369 0.324
Greece 0.341 0.315 0.374 0.328
Ireland 0.341 0.308 0.364 0.323
Italy 0.340 0.309 0.368 0.324
The Netherlands 0.344 0.316 0.363 0.330
Portugal 0.339 0.312 0.372 0.327
Spain 0.341 0.310 0.372 0.324
Sweden 0.350 0.322 0.374 0.335
United Kingdom 0.345 0.312 0.381 0.326
without excise tax
Transport cost (Euro'90/km driven) for private cars (annual mileage 13000 km per year)
Table 9: Unit cost per km driven for average annual mileage of a diesel car
Diesel Gasoline LPG Methanol
Austria 0.423 0.413 0.444 0.441
Belgium 0.463 0.464 0.464 0.491
Denmark 0.716 0.680 0.765 0.722
Finland 0.572 0.552 0.585 0.589
France 0.368 0.370 0.376 0.400
Germany 0.465 0.466 0.481 0.496
Greece 0.536 0.511 0.563 0.538
Ireland 0.647 0.619 0.666 0.645
Italy 0.318 0.311 0.331 0.336
The Netherlands 0.682 0.677 0.687 0.710
Portugal 0.435 0.413 0.465 0.440
Spain 0.363 0.353 0.412 0.375
Sweden 0.434 0.434 0.439 0.468
United Kingdom 0.543 0.530 0.535 0.566
Diesel Gasoline LPG Methanol
Austria 0.255 0.237 0.275 0.246
Belgium 0.253 0.234 0.272 0.243
Denmark 0.253 0.233 0.276 0.243
Finland 0.253 0.232 0.269 0.241
France 0.250 0.230 0.274 0.240
Germany 0.251 0.229 0.270 0.239
Greece 0.251 0.235 0.276 0.244
Ireland 0.251 0.228 0.266 0.238
Italy 0.250 0.230 0.270 0.239
The Netherlands 0.254 0.236 0.265 0.245
Portugal 0.249 0.233 0.274 0.242
Spain 0.251 0.230 0.273 0.240
Sweden 0.259 0.242 0.276 0.250
United Kingdom 0.255 0.232 0.283 0.242
Transport cost (Euro'90/km driven) for private cars (annual mileage 18000 km per year)
without excise taxes with excise taxes
The most striking feature coming out from the figures is the extent to which taxation affects the overall cost of running private cars. In most cases it results in an approximate doubling while in some countries (notably Denmark, the Netherlands and Ireland) with automotive taxation regimes designed to actively discourage private vehicles the cost approximately trebles. It is clear that fiscal measures seriously disadvantage car ownership and use and in their absence one could suspect that their remarkable growth could become inexorable.
LPG seems to be reasonably competitive in some countries like Belgium, Sweden and to a lesser extent France for the higher utilisation rate. These small advantages however arise from discriminating taxation and disappear in the absence of all excise taxes, swamped by the higher vehicle acquisition costs.
ANNEX 3
COAL AFTER THE
E
UROPEANC
OAL ANDS
TEELC
OMMUNITY(ECSC) T
REATY EXPIRESThe world coal market is a stable market, with abundant resources and a wide geopolitical diversity of supply. Even in the long term, with growing world demand, the risk of any prolonged disruption of supply, even if it cannot be ruled out altogether, is minimal. Coal is imported into the European Community primarily from its partners within the International Energy Agency (IEA) or from countries with which the Community or the Member States have signed trade agreements. These partners represent guaranteed suppliers.
At Community level, coal is regulated by the Treaty establishing the European Coal and Steel Community (ECSC Treaty), which was signed in Paris on 18 April 1951. Several regulations have been adopted on the basis of this Treaty, including Council Decision No 3632/93/ECSC of 28 December 1993 establishing Community rules for state aid to the coal industry.(1)
The ECSC Treaty, along with the rules adopted in application thereof, expires on 23 July 2002. We need to look, therefore, at a future Community system that will have to incorporate a component which has become very significant in recent decades, namely, state aid. Expiry of the ECSC Treaty should also provide the opportunity for a wide-ranging review of the place of coal among the Community's other sources of primary energy.
1. 1950 – 2000 : the main objectives of coal in the Community
Coal held a prime position in the supply of Europe's energy, a position enshrined in the ECSC Treaty. Indeed, the Treaty lays down that the institutions of the Community must "ensure an orderly supply to the common market, taking into account the needs of third countries" (Article 3(a)) and "promote the growth of international trade and ensure that equitable limits are observed in export pricing" (Article 3(f)).
In the first years of application of the Treaty, coal's contribution to energy supplies was provided exclusively by a flourishing Community industry in the process of modernisation. A few years later, however, saw the addition of coal imports from third countries. These imports gradually began to compete with Community coal.
The oil crises of the 1970s, which came at a time when the Club of Rome was considering limits to growth, put the issue of security of energy supply back on the agenda. In the light of these crises the Member States placed the emphasis on substitution policies designed to reduce their dependence on oil. Thus, the use of coal was one of the policies that helped to counter the oil shocks. Ambitious RTD and demonstration programmes were also set up at Community level, and national strategies to counter oil dependence focused, among other things, on encouraging coal production in the Community and coal imports from third countries.
In the face of an increasingly dynamic international market, the Community coal industry was forced, at the beginning of the 1980s, to begin root and branch restructuring, all the more so because of decisions to expand taken some years earlier. In terms of supply, imported coal gradually took over from Community coal, although without any increase in the risk of disruption of supply or price instability for coal.
While security of supply was the watchword of the 1970s, the 1990s saw the emergence of environmental concerns. It is becoming increasingly obvious that coal could only play a part in energy supply if it managed to control its impact on the environment. Technology will help to take up this environmental challenge, which stems principally from climate change and acidification.
Thus, while the idea underlying the signing of the ECSC Treaty was to create a common market in coal, decisions concerning this source of energy, for the last 25 years at least, have been driven far more by energy policy, especially security of supply, and environmental concerns.
2. Economic appraisal of the Community coal sector
2.1. Coal market
EUR 15
(in million tonnes)
1975 1985 1990 1995 1998 1999 2000
(*)
Community production
268 217.4 197 136 108 100 85
Consumption 327 343 329 280 263 253 243
Imports 59 114 132 137 145 150 154
(*) Estimates
The European Community also produces 235 million tonnes of lignite (the equivalent of 70 million tce(2)).
2.2. Global assessment
In 1999, coal production in the European Union amounted to around 100 million tonnes, split as follows: France = 4 millions tonnes; Germany = 41 millions tonnes; United Kingdom = 36 millions tonnes; and Spain = 16 million tonnes.
an economic solution to the structural crisis affecting the European coal industry. Indeed, what progress has been made in terms of productivity has not been enough to cope with the prices prevailing on the international markets.
With the exception of a certain amount of potential in the United Kingdom, the objective of a competitive Community coal industry on international markets is completely out of the question despite the efforts made by production companies, both technologically and organisationally, to improve productivity. This is explained primarily by increasingly unfavourable geological conditions through the gradual exhaustion of the most readily accessible deposits and the relatively low level of the price of coal on international markets. 2.3. Assessment and prospects by producer country
• France
Under the National Coal Pact agreed between the two sides of industry in 1995 coal extraction is gradually being phased out and will stop completely in 2005. All mines therefore form part of a closure plan and receive aid to reduce activities for the exclusive coverage of operating losses.
Because of the severity of social and regional problems, the French Government has not been able to keep to the 2002 deadline provided for by Decision No 3632/93/ECSC. Given the extremely difficult operating conditions, however, coal-mining could well stop before the end of 2005. There has been a constant increase in production costs which in 2000 should reach EUR 170/tonne (compared with the price of imported coal of EUR 35 - 40/tonne).
• Spain
Spain has adopted a restructuring plan for the period 1998-2002 which provides for an annual decrease in production, which should be no more than 12.7 million tonnes in 2002. Even though this plan provides for a gradual reduction in aid to current production of the order of 4% per year, coal-mining in Spain has very little prospect of being competitive. Production costs are currently at a level of EUR 130-140/tonnes.
In recent years the Spanish Government has granted annual aid of the order of EUR 1 billion, a significant proportion of which (70%) is in the form of aid to current production. While several mines are already covered by a closure plan, and thus receive aid to reduce activity, a large proportion of production still receives operating aid. This category of aid is set aside in principle for production units that can improve their economic viability by reducing production costs.
• Germany
The restructuring plan adopted by Germany in 1997 provides for a reduction in coal production to 26 million tonnes in 2005. Coal-mining in Germany has no prospect of competing with imported coal in the long term. Production costs, due to increasingly difficult geological conditions, have decreased very little since 1994 and are currently running at EUR 130-140/tonne.
• United Kingdom
As a result of concentrating activities in the most productive mines and sustained efforts to improve viability, the United Kingdom is the only Community country where the coal industry has received no State aid since 1995. That said, a number of factors, including the sudden fall in prices on the international markets in 1999, have compelled the British authorities to consider granting aid, albeit on a very modest scale, of around UKL 110 million over the period 2000-2002.
The aim of the assistance plan in the United Kingdom is to provide temporary support - until the expiry of the ECSC Treaty - to production units that are economically and financially viable in the long term but which are experiencing certain temporary problems that could result in their closure.
3. What future for Community coal?
When the ECSC Treaty expires, in the absence of any financial support measures, the large majority of the European coal industry would be condemned to disappear in the very short term. Such an evolution would only increase the uncertainties which are likely to remain regarding the long term energy supply of the European Union.
The orientations for a future support regime for Community coal when the ECSC Treaty expires could incorporate the two fundamental objectives which have emerged since the Treaty was signed, mentioned at point (1) above. Coal could thus play a part in the security of energy supply in the European Community while taking account of the environmental dimension.
If the intention is to guarantee the long term availability of some European coal production capacity in order to cover possible risks which could affect the energy market, a future for Community coal can only be envisaged if it is accompanied by a mechanism of intervention by public authorities.
Such a regime would make it possible to guarantee the maintenance of access to reserves. For that purpose, a minimum quantity of subsidised coal should be produced, not for production as such, but to keep the equipment in an operating condition and to retain the professional qualifications of a nucleus of miners and technological expertise. This base would thus contribute to strengthening the security of supply of the long-term Community.
It would include coal, but also possibly other energy resources such as renewable energy. In addition to the aim of security of supply, this renewable energy would contribute directly to the promotion of environmental objectives, in particular under the Kyoto protocol.
4. Enlargement of the European Union
Any reflection on the future framework for Community coal should also consider the situation in the countries that have applied for accession to the European Union. This issue is particularly relevant for the two principal producers of coal in central and Eastern Europe, namely, Poland and the Czech Republic, especially as Poland alone currently accounts for production levels equivalent to the four producer countries in the Community.
negligible quantities. These are Bulgaria, Hungary and Romania, which each produce 2 to 3 million tonnes of coal per year. In addition to coal they also produce 186 million tonnes of lignite (equivalent of 55 million tce).
Following an initial phase of restructuring in 1993, accompanied by a significant wave of privatisation, the Czech Republic is currently in the process of a second restructuring phase of its coal industry.
Poland adopted a restructuring plan for the period 1998-2002, providing for a lowering of production to 100 million tonnes in 2002 (as against 148 million tonnes in 1990) and a reduction in jobs to 128 000 miners (as against 391 100 in 1990). In the middle of the 1980s Poland was the fourth biggest exporter of coal to the European Union. After losing market share at the end of the 1980s/beginning of the 1990s, coal exports have gradually increased to around 12% (approximately 20 million tonnes) of coal imports into the European Union. Production costs, especially wages, have gradually exerted more and more pressure on coal-mining companies. The current restructuring plan, which provides for a significant lowering of production, ought to allow the situation to stabilise. Efforts should nonetheless be kept up beyond 2002, with further reductions in national production targeting mines with the largest deficits.
The Polish coal industry is in a very similar position to the German coal industry, the geological conditions often being very similar. A significant proportion of Polish coal can thus no longer compete with coal from non-European countries (China, United States and South Africa). The Polish coal industry will thus depend increasingly on aid granted by the public authorities.
5. Conclusion
By giving room for manoeuvre to Member States that have committed themselves to a process of restructuring their coal industry, financing based on a system of primary energy would also make it possible to promote renewable energy which will help to reinforce environmental policies.