Int. J. Electrochem. Sci., 11 (2016) 1382 - 1394
International Journal of
ELECTROCHEMICAL
SCIENCE
www.electrochemsci.org
Impact of Composite Particle Morphology on the Performance
of Solid Oxide Fuel Cell Electrode: A Study by Finite Element
Modelling
Lou Kang*, Wang Fenghui, Zhao Xiang, Lu Yongjun
Department of Engineering Mechanics, Northwestern Polytechnical University, Xi’an 710129, CHINA *
E-mail: [email protected]
Received: 14 Octobar 2015 / Accepted: 25 November 2015 / Published: 1 January 2016
Micro-models, which assume that the electrode mixture particles are regularly spherical according to the mathematical model, have been extensively studied by computer simulation. Actually, the component particles are irregularly even distorted. In this paper, a continuous finite element method (FEM) electrical model based on resistor-network theory is proposed to investigate the impact of non-spherical composite particles on cell performance. Electrode models with different particle morphology from uniform (spherical) to complex (non-spherical) are built to investigate the triple phase boundary (TPB) connectivity and electrode conductivity of electrode. The results of model simulations show that non-spherical particles like convex or needle-shaped can improve cell performance since the irregular particle surface provides larger contact areas between particles. The particle morphology has a more pronounced effect on cell performance for thin electrode but can be ignored when the electrode thickness is greater than 30 times the particle diameter.
Keywords: Particle morphology; Non-spherical; Solid oxide fuel cell; Simulation
1. INTRODUCTION
Numerous theoretical and reconstruction models have been proposed to study the micro-structural parameters’ (i.e. the phase volume fractions Φio, particle sizes and more complex triple phase boundary length (TPBL)) influences on cell performance [1, 3-7]. Sunde [4] developed random-packing method and resistor-network theory first to calculate composite SOFC electrodes conductivity and polarization in 2D form. With the development of numerical simulation techniques, the resistor-network theory is extended to 3D form. Argento and Bouvard [8] gave numerical expression of the bond resistance 2Ri between two 3D monosized halfspheres with equal type material, as shown in Eq.
(1). Schneider and et al. [7] studied the cell performance by using a 3D packing of mono-sized spherical particles and resistor-network model, in which bond resistance of two different material contacting particles was introduced, as show in Eq. (2). The similar models can also be found in other researchers' work [3, 7, 9] in the same period. Resistor-network theory and random packing method become the leading theory and research method.
The bond resistance of two the same type particles can be expressed by:
744
.
0
744
.
0
)
/
(
1
1
899
.
0
, , 2 p c C cyl i i p c cyl i p c p c ir
r
for
kA
l
R
R
r
r
for
R
r
r
r
r
R
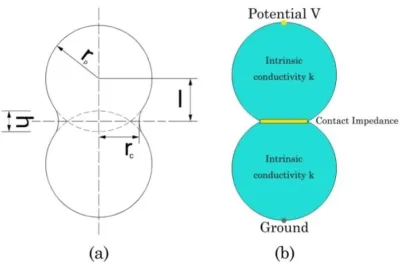
(1)where Riis the bond resistance of particle i; rc and rp refer to contact radius and particle radius; and Ri,cyl is the electric resistance of equivalent cylinder from the center of the particle to contact point;
k is the bulk conductivity; Ac is the contact area (Ac = πrc2), l refers to the distance between the contact boundary and the particle center, which is shown in Fig. 1(a).
The bond resistance of two different type particles is given by:
c ec ec ec j i ijr
K
R
R
R
R
R
2
1
1
2
(2)where Ri and Rj are bond resistances according to Eq. (1), Rec is electrochemical resistance, and
Kec is the polarization conductivity and 2πrc is the TPBL.
[image:2.596.198.398.580.711.2]
Despite a great progress has been made in the composite electrode model, the basic assumptions remain that all component particles should be spheres [6]. Actually, many researches in recently years show that particle morphology affects the total length of TPB and its connectivity.[10-14, 25-31]. Zhang and Gokhale [10] concluded that non-spherical convex-shaped particle morphology would reduce the corresponding percolation threshold and increase topological connectivity TPB. This implies that the spherical particle morphology has underestimated the TPB connectivity, and also has underestimated cell performance. Therefore, it would be very meaningful to find out the cell performance changes caused by particle morphology alteration. However, it is much difficult to control particle morphology by processing, and the resistor-network theory is inapplicable when particle is non- spherical, a new model should be proposed.
In this paper, a finite element model based on voronoi diagram [15, 16] is generated for the purpose of investigating particle morphology impact on cell performance: (i) voronoi diagram based on Matlab procedure is used for geometry construction, in which different particle shapes (i.e. convex or pancake) can be controlled by the control factor of shape (Fs: a factor used to change particle shape in voronoi diagram; the larger Fs is, the more disorderly particle arrangement is); (ii) specific electrical model is generated to evaluate bond resistance between irregular convex particles. Resistance network theory and random packing method are adopted. However, unlike most of researches, contact boundary length is variously determined by each contacting particle boundary; (iii) TPB connectivity, electrode total conductivity Ktotal and their relationships with particle morphology are discussed. At the same time, influence of composition and electrode thickness are considered.
2. MODEL FORMULATION
2.1 A novel electrical model for finite element method (FEM)
Bond resistance expressions Ri of spherical particles according to Eq. (1) - Eq. (2) are rewritten
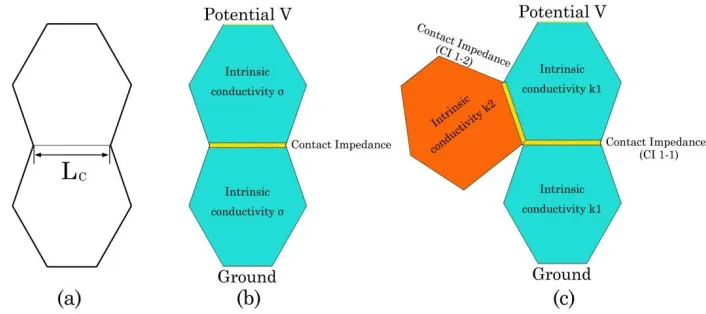
for the purpose of evaluating bond resistance between two contacting convex particles. The resistance of the electrode are divided into two parts: the intrinsic ohmic resistances of the solid particles and polarization resistances between particles (expressed as contact impedance), as described in Fig. 1(b). Contact boundary length (Lc) was introduced for calculation of bond resistance between two contact convex particles, as described by Fig. 2.
The occurrence of Ohmic losses is because of resistance to the flow of ions in the electrolyte and resistance to flow of electrons through the electrode materials [17]. Because the charge flow in the electrode obeys Ohm's law, the ohmic resistances can be expressed as Eq. (3):
Ohm's law:
V
E
J
kE
J
J
e
0
(3)
Contact impedance:
)
(
)
(
1 2 2 2 1 1V
V
d
J
V
V
d
J
s s
(4)where σ is the contact conductance, and ds is the contact layer thickness (unit for simplification). The indices 1 and 2 refer to the two sides of the boundary.
The contact conductance σ was calculated by referring to Sunde’s research [4], as shown in Eq. (5) and Eq. (6), which is used to evaluate neck conductance between two contacting spheres:
a bond between two particles of the same material:
ci i c i tpb i
ij
k
l
k
r
k
L
2
1
(5) whereas for two dissimilar particles,
1 1 1
12 2
2
ed el p
eled
(6)Here, kiis the bulk conductivity of the electrode or electrolyte material, ltpb (ltpb = 2πrc = πLc) is the circumference of the particle contact. For convex polygon, we assume ltpb as circumference of a circle whose diameter is Lc. σed is an electrode bond-conductance according to Eq. (5). σel is an electrolyte bond-conductance according to Eq. (5). σp is a polarization conductance.
Figure 2. Schematic view of non-spherical particles. (a) Depiction of the geometric information; (b) Electrical model of a pair of non-spherical particles; (c) Schematic diagram showing electrical continuous model of a non-spherical particle packing. Intrinsic conductivity ki (i =1,2) is
assigned according to its material property. Contact impedance between particles (the same type: CI1-1 and different type CI1-2) are calculated from Eq. (4). Over-potential V is applied between two sides of particles which are adjacent to current collector or electrolyte.
[image:4.596.127.480.406.563.2]
packing, composite electrode becomes one continuous electrical network which would be discussed in section 2.3.
2.2 Cluster
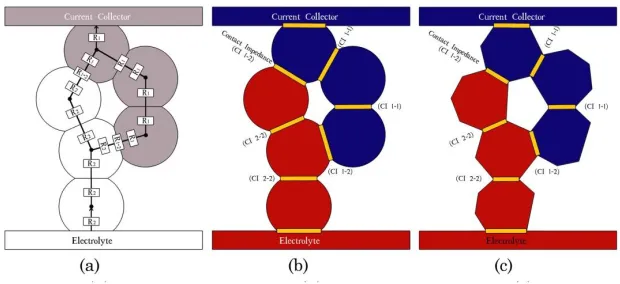
The cluster model of a typical SOFC resistance-network consisted of 6 particles (can be seen in Fig.3). Fig. 3(a) shows a disperse resistor-network model according to [6] where the cluster is dispersed into individual resistors. Fig. 3(b) and (c) show the continuous electrical model where contact impedance connected these particles as one continuous electrical network. Bond resistances of each contacting particles were calculated according to the model introduced above. With a given electrode over-potential V, total resistance of the cluster can be expressed as:
i
i
i i total
total
S J U I
U R
1
(7)
where U is the electrode over-potential (V), Ji is the average current density of particle i and S
is the sectional area of particle i that connected to Current Collector or Electrolyte. By adding all currents of the spheres that form the current collector or the electrolyte, the total current (Itotal) entering or leaving the network is then obtained.
At the same time, the cluster total resistance Rtotal was also calculated by using resistor-network model which was solved according to Kirchhoff’s current law. Comparison of results of the two models was carried out for the purpose of verification, which would be discussed in the following sections.
[image:5.596.143.453.480.622.2]
Figure 3. Schematic diagram: (a) disperse resistor-network model; (b) continuous electrical model for spherical particles; (c) continuous electrical model for non-spherical particles.
2.3 Bulk
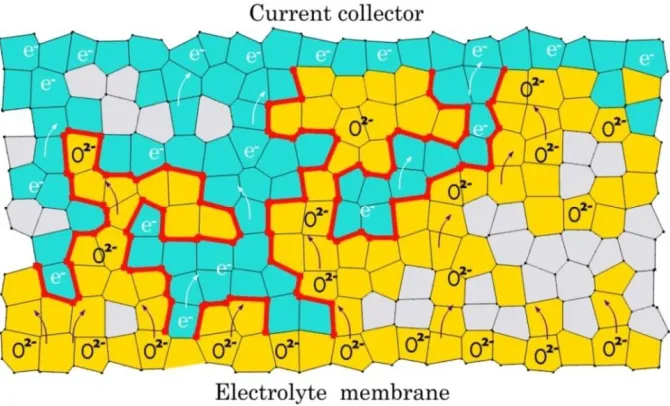
active TPB reaction sites. This geometric model was based on voronoi tessellation which could be obtained by calling the voronoi generation function in Matlab. The tessellation can be controlled by seeds of every convex polygon [16] and a Monte Carlo approach has been adopted to generate microstructure of composite electrodes by packing three types of particles (ionic conducting electrolyte material, electronic conducting electrocatalyst material and pore) into a fixed field. For model simplification, percolation effect was not considered when calculating the electrode conductivity and the entire electrode particles are supposed to be activated. Actually there are some researchers [7, 11, 18-20] find that it is not necessary to distinguish the active from inactive TPB components if the composite percolates well. It has been observed experimentally by Holzera and et al. [11], the study shows that the percolation of three compositions is nearly 100% in an electrode where the pore volume is 20% and the nickel volume is 25%. In addition, according to the research of Kenney and et al [21] when porosities are larger than 25%, over 99% of pores belong to percolating network.
Figure 4. Configuration of a voronoi based composite anode model. Aquamarine-colored polygons represent Ni particles; yellow-colored polygons represent YSZ particles and gray-colored particles are pores.
Then it should be emphasized that, both the length of TPB (TPBL)and composite conductivity (K) in this study refer to the total electrode.
Total length of TPB per unit volume was measured according to the equation (8) [10, 22]:
A TPB
TPBL L
V 2 (8)
where TPBL is the length of TPB (length of the red line in Fig. 4) in the bulk area A.
[image:6.596.132.467.305.508.2]
A
U
I
K
total
1
(9)where I is the total current, U is the total over-potential (chosen as U = 1 (v)) and A is the surface area of the electrode.
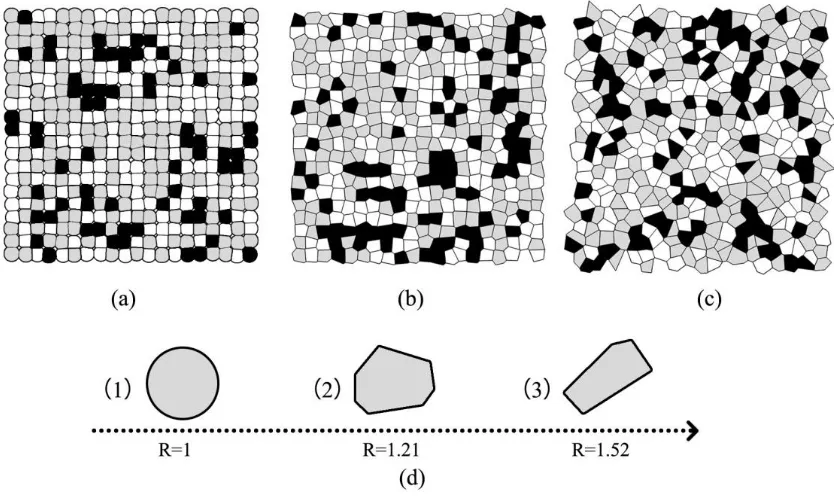
[image:7.596.90.507.311.559.2]Models with different particle morphology (from circle to polygon) have been generated (Fig. 5). Here, particle roundness (R) is utilized to characterize particle morphology. Roundness is the measure indicating how closely the shape of an object approaches that of a circle, so roundness of circle is 1 (Rc = 1) while others are larger (R > 1). The roundness calculated by Image-Pro® Plus 6.0 (IPP) is capable of differentiating varieties of particle shapes [23]. Fig. 6 shows roundness distributions of the particles measured by IPP. As we increase the value of Fs, the average roundness increases and more particles with larger roundness are mixed into the electrode bulk, making the whole particle arrangement more disorderly as shown in Fig.5 (a) - Fig.5 (c).
Figure 5. Schematic diagram of simulation microstructure of a composite electrode with 20% porosity (black), 40% electrode phase (white) and 40% electrolyte phase (gray): (a) random packing of circle particles; (b) random packing of polygon particles when Fs = 1; (c) random packing with of polygon particles when Fs = 1.5; (d) Single particle morphology is also revealed, where R is the particle roundness that measured by Image-Pro® Plus 6.0 (IPP).
Table 1. Parameters used in the electrode simulations.
Parameters Symbol Typical value
Electronic (S/cm) kel 2×10 4
[4] Ionic(S/cm) kio 0.1[4]
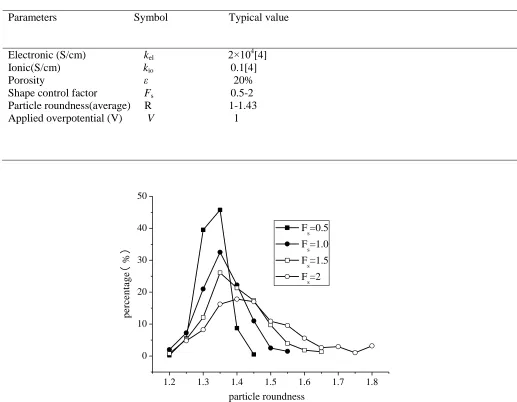
Porosity ε 20% Shape control factor Fs 0.5-2
Particle roundness(average) R 1-1.43 Applied overpotential (V) V 1
1.2 1.3 1.4 1.5 1.6 1.7 1.8 0
10 20 30 40 50
p
e
rc
e
n
ta
g
e
(
%
)
particle roundness F
s=0.5
Fs=1.0 F
s=1.5
F
s=2
Figure 6. Particle roundness distributions of electrode bulk model under different values of Fs. The average particle roundness increases from 1.30 to 1.43 as Fs increases, and the electrode bulk thickness is fixed at 20 times the particle size.
3. RESULTS AND DISCUSSION
3.1. Model validation
[image:8.596.161.432.277.489.2][image:9.596.66.517.66.329.2]
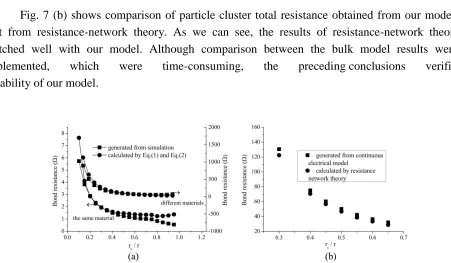
Fig. 7 (b) shows comparison of particle cluster total resistance obtained from our model with that from resistance-network theory. As we can see, the results of resistance-network theory are matched well with our model. Although comparison between the bulk model results were not implemented, which were time-consuming, the preceding conclusions verified the reliability of our model.
Figure 7. (a) Bond resistance generated from simulation (■) and calculated by Eq. (1) and Eq. (2) (●). For particles of the same material, material conductivity k = 1 (S/m). For particles of different materials, kel = 100 (S/m), kio = 1 (S/m); (b) Particle cluster total resistance generated from simulation (■) and calculated by resistance network theory (●).
3.2 Particle morphology impact on TPB connectivity
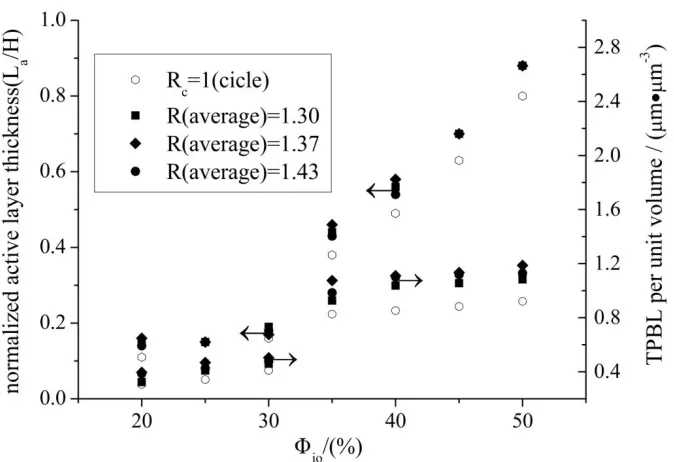
Composite electrode makes electrochemical reaction region extended from electrolyte/electrode interface into electrode, we define this region as active layer and its thickness is La (the thickness of active layer). The TPB connectivity can be characterized by active layer thickness La and TPB density (TPBL per unit volume). To study the impact of particle morphology on TPB connectivity, four simulations with different average particle roundness are investigated. Fig.8 demonstrates electrode thickness normalized La and TPB density as a function of composition (expressed by Φio). As we can see, the active layer thickness and TPB density increase when particle shape is changed from circle to polygon, which verify the influence of particle morphology on the connectivity of TPB [10]. The maximum total TPB density maintains at about 1.1 (μm·μm-3). Schneider [7] proposed that the range of TPBL should be 1.1-1.2 (μm·μm-3), therefore, our results might be reasonable. It is also revealed in Fig. 8 that TPB density reaches the maximum when R (average) equals to 1.37, which shows that appropriate increase of particle roundness help improve TPB connectivity.
3.3 Particle morphology impact on electrode conductivity
[image:9.596.118.478.172.326.2]
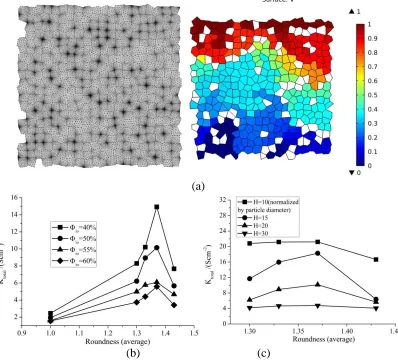
number of electrochemical reactions taking place while the reaction activity determines how quickly the reactions complete. Models of different electrode composition and different normalized thickness are implemented. Fig 9(a) shows electrode electric potential distribution from which every particle's potential can be determined. As we can see from Fig. 9(b), electrode conductivity increases with the increasing of R and reach the maximum when R equals to 1.37, this indicates that particle morphology does have effects on electrode conductivity. Although there is no obvious maximum total TPB length incensement as discussed in section 3.2. Electrode thickness is fixed at H = 20 (normalized by particle diameter) when composition varies. It would be reasonable to infer that particle morphology affects the reaction activity. Fig. 5(d) shows the detail particle morphology of different roundness. As we can see, flat or needle-shaped particle is trend to form longer contact boundary which provides larger contact area. This makes charge transfer much easier and enhances the reaction activity. When R > 1.37, Ktotal generally decreases with increased R. This could because more and more small particles with short edges (Fig. 5(d)) generated among the composite with the increase of R. These particles hinder the charge transfer for their low conductivity. The smaller particles, whose boundaries are short, make their contact impedance much higher and consequently decrease the total electrode conductivity. Similar phenomenon have been uncovered in reference [24]: the electrode polarization resistance, decreased after redox treatment as the shape of nickel particle got thinner and complicated, then increased during discharge process in which nickel particle shape became round and large again.
Fig. 9(c) shows impact of particle morphology on cell performance of different electrode thickness. It reveals that influence of particle morphology can almost be ignored for thicker electrode (H > 30). This is because the TPB connectivity of thick electrode itself is poor [10], which makes the impact of particle morphology be less obvious.
[image:10.596.132.469.455.686.2]
(a)
(b) (c)
Figure 9. Impact of particle morphology on cell performance: (a) electrode mesh and potential distribution in which white regions are pores excluded from electrochemical reactions; (b) particle morphology impact on models of different composition (fixed electrode thickness H = 20); (c) particle morphology impact on models of different normalized thickness (fixed electrode composition Φio = 50% ).
4. CONCLUSION
A novel continuous electrical model based on resistor-network theory and random packing method has been proposed. Particle pair, particle cluster and composite electrode bulk models were introduced for model validation and the impact of particle morphology on cell performance is evaluated. By using voronoi diagram, three types of material were randomly assigned into every single convex polygon respectively. Contact impedance was introduced here, which connect disperse particle together into a continuous network. TPB density and electrode total conductivity were both correlated with particle morphology which characterized by roundness (R).
[image:11.596.100.498.76.436.2]
That's because irregular particle morphology forms a wider surface area in every single particle, these surfaces provide higher electrical activity that allow charge to transfer more easily. The best performance was obtained when R=1.37, which suggests appropriate particle morphology.
Although our model is in a 2D form, it gives a reasonable way to generate a continuous electrical model of composite electrode. Instead of numerical calculation, finite element method (FEM) is used, which can provide more intuitive results. Of course, a 3D model will be the next step of the research. By extending our framework into 3D form, we can obtain more practical information about cell performance sensibility to particle morphology. Besides, this model will be a good choice for investigating electrode crack growth with its clearly distinguishable particle boundaries.
ACNOWLEDGEMENTS
This research is supported by National Natural Science Foundation of China (10772146),and the Fundamental Research Funds for the Central Universities (3102014 JCQ01040).
Refereneces
1. S. Sunde, J. Electroceram., 5 (2000) 153
2. R.N. Basu, G. Blass and H.P. Buchkremer, The Electrochemical Society Proceedings, 16 (2001) 995
3. Ali, X. Wen, K. N. akumar, B.J. Luo and K.T. Chuang, J. Power Sources, 185 (2008) 961 4. S. Sunde, J. Electrochem. Soc., 142 (1995) 50
5. P. Costamagna, P. Costa and V. Antonucci, Electrochim. Acta, 43 (1998) 375 6. A. Abbaspour, J.L. Luo and K. Nandakumar, Electrochim. Acta, 55 (2010) 3944
7. L.C.R. Schneider, C.L. Martin, Y. Bultel, D. Bouvard and E. Siebert, Electrochim. Acta, 52 (2006) 314
8. C. Argento and D. Bouvard, lnt. J. Heat Mass Transfer., 39 (1996) 1343
9. M. Andersson, J.L. Yuan and B. Sunden, Int. J. Heat Mass Tran., 55 (2012) 773 10. S. Zhang and A.M. Gokhale, J. Power Sources, 219 (2012) 172
11. L. Holzer, B. Münch, B. Iwanschitz, M. Cantoni, T. Hocker and T. Graule, J. Power Sources, 196 (2011) 7076
12. S.P. Jiang, J. Power Sources, 124 (2003) 390
13. H. Iwai, N. Shikazono, T. Matsui, H. Teshima, M. Kishimoto, R. Kishida, D. Hayashi, K. Matsuzaki, D. Kanno, M. Saito, H. Muroyama, K. Eguchi, N. Kasagi and H. Yoshida, J. Power Sources, 195 (2009) 958
14. Q. Cai, C.S. Adjiman and N.P. Brandon, Electrochim. Acta, 56 (2011) 5804 15. L. Jinyi and L. Shuang, J. Engineering Graphics, 2 (2004) 125
16. S. Liangying, D. Guanyu, L. Cheng and L. Xianghua, J. Materials and Metallurgy, 8 (2009) 193 17. S.H. Chan, K.A. Khor and Z.T. Xia, J. Power Sources, 93 (2001) 130
18. D.H. Jeon, J.H. Nam and C.J. Kim, J. Power Sources, 139 (2005) 21
19. J.R. Wilson, A.T. Duong, M. Gameiro, H.Y. Chen, K. Thronton, D.R. Mumm and S.A. Barnett, Electrochemical Communications, (2009) 1052
20. J.R. Wilson, M. Gameiro, K. Mischaikow, W. Kalies, P.W. Voorhees and S.A. Barnett, Microsc. Microanal., 15 (2009) 71
21. B. Kenney, M. Valdmanis, C. Baker, J.G. Pharoah and K. Karan, J. Power Sources, 189 (2009) 1051
23. W. Wei, X. Liubing, L. Zhipeng, H. Rihui, L. Yixun, L. Yun and D. Ruping, Geological Review, 59 (2013) 553
24. T. Shimura, Z. Jiao, S. Hara and N. Shikazono, J. Power Sources, (2014) 58 25. M. Dudek and R. Socha, J. Electrochem. Sci., 12 (2014) 7417
26. M. Linder, T. Hocker, L. Holzer, K. Friedrich, B. Iwanschitz, A. Mai and J. Schuler, J. Power Sources, 272 (2014) 595
27. F. Miao, Int. J. Electrochem. Sci. 8 (2013) 11814
28. S. Yang, T. Chen, Y. Wang, Z. Peng and W. Wang, Int. J. Electrochem. Sci.,8 (2013) 2330 29. G. Brus, H. Iwai, A. Sciazko, M. Saito, H. Yoshida and J. Szmyd, J. Power Sources, 288 (2015)
199
30. W. Kong, Q. Zhang, X. Gao, J. Zhang, D. Chen and S. Su, Int. J. Electrochem. Sci., 10 (2015) 5800
31. N. Yang, Y. Shen, W. Yan, X. Meng, X. Tan, Z. Ma and M. Zi-Feng, J. Inorg. Mater., 29 (2014) 1246