This is a repository copy of
The direct detection of the irradiated brown dwarf in the white
dwarf - brown dwarf binary SDSS J141126.20+200911.1
.
White Rose Research Online URL for this paper:
http://eprints.whiterose.ac.uk/137094/
Version: Published Version
Article:
Casewell, S.L., Littlefair, S.P., Parsons, S.G. orcid.org/0000-0002-2695-2654 et al. (3 more
authors) (2018) The direct detection of the irradiated brown dwarf in the white dwarf -
brown dwarf binary SDSS J141126.20+200911.1. Monthly Notices of the Royal
Astronomical Society, 481. pp. 5216-5222. ISSN 0035-8711
https://doi.org/10.1093/mnras/sty2599
[email protected]
https://eprints.whiterose.ac.uk/
Reuse
Items deposited in White Rose Research Online are protected by copyright, with all rights reserved unless
indicated otherwise. They may be downloaded and/or printed for private study, or other acts as permitted by
national copyright laws. The publisher or other rights holders may allow further reproduction and re-use of
the full text version. This is indicated by the licence information on the White Rose Research Online record
for the item.
Takedown
If you consider content in White Rose Research Online to be in breach of UK law, please notify us by
The direct detection of the irradiated brown dwarf in the white
dwarf–brown dwarf binary SDSS J141126.20+200911.1
S. L. Casewell ,
1‹S. P. Littlefair,
2S. G. Parsons ,
2T. R. Marsh,
3J. J. Fortney,
4and
M. S. Marley
51Department of Physics and Astronomy, University of Leicester, University Road, Leicester LE1 7RH, UK
2Department of Physics and Astronomy, University of Sheffield, Sheffield S3 7RH, UK
3Department of Physics, University of Warwick, Gibbet Hill Road, Coventry CV4 7AL, UK
4Department of Astronomy and Astrophysics, University of California, Santa Cruz, CA 95064, USA
5NASA Ames Research Center, MS-245-3, Moffett Field, CA 94035, USA
Accepted 2018 September 13. Received 2018 August 15; in original form 2018 June 14
A B S T R A C T
We have observed the eclipsing, post-common envelope white dwarf–brown dwarf binary, SDSS141126.20+200911.1, in the near-IR with the HAWK-I imager, and present here the first
direct detection of the dark side of an irradiated brown dwarf in theHband, and a tentative
detection in theKs band. Our analysis of the light curves indicates that the brown dwarf is
likely to have an effective temperature of 1300 K, which is not consistent with the effective temperature of 800 K suggested by its mass and radius. As the brown dwarf is already absorbing
almost all the white dwarf emission in theKsband, we suggest that this inconsistency may
be due to the UV-irradiation from the white dwarf inducing an artificial brightening in theKs
band, similar to that seen for the similar system WD0137-349B, suggesting this brightening may be characteristic of these UV-irradiated binaries.
Key words: binaries: eclipsing – brown dwarf – white dwarfs.
1 I N T R O D U C T I O N
Despite recent results reporting the discovery of brown dwarf com-panions to main sequence stars (e.g. Anderson et al.2011; Siverd et al.2012; Bayliss et al.2017; Hodˇzi´c et al.2018), there are still only 13 known to date, and they are very rare compared to planetary or stellar companions to main sequence stars (Metchev & Hillen-brand2004; Grether & Lineweaver2006). As a result, there are very few systems known to have evolved from these binaries with Steele et al. (2011) predicting only 0.5 per cent of white dwarfs having brown dwarf companions.
To date only nine post-common envelope systems have been confirmed: GD1400 (WD+L6, P = 9.98 h; Farihi & Christo-pher2004; Dobbie et al.2005; Burleigh et al. 2011), WD0137-349 (WD+L6-L8, P = 116 min; Burleigh et al. 2006; Maxted et al.2006), WD0837+185 (WD+T8,P= 4.2 h; Casewell et al.
2012), NLTT5306 (WD+L4-L7, P = 101.88 min; Steele et al.
2013), SDSS J155720.77+091624.6 (WD+L3-L5, P = 2.27 h; Farihi, Parsons & G¨ansicke2017), SDSS J1205-0242 (WD+L0,
P=71.2 min; Parsons et al.2017; Rappaport et al.2017), SDSS J1231+0041 (WD+M/L, P = 72.5 min; Parsons et al. 2017), EPIC212235321 (WD+L5,P=68 min; Casewell et al.2018) and SDSS J141126.20+200911.1, hereafter SDSS1411+2009 (WD+T5,
⋆E-mail:[email protected]
P=121.73 min; Beuermann et al.2013; Littlefair et al.2014). All of these systems have survived a phase of common-envelope evolu-tion, resulting in the close binary system. They are all detached, and likely tidally locked, resulting in a brown dwarf that is irradiated on one hemisphere, similar to the situation in most hot Jupiter ex-oplanets. Eventually, these white dwarf–brown dwarf binaries will become cataclysmic variables, such as SDSS1433+1011 in which the substellar donor was recently detected (Hern´andez Santisteban et al.2016).
Irradiated brown dwarfs are expected to have very similar atmo-spheres to irradiated exoplanets, and have been described as the ‘fourth corner’ of the parameter space containing irradiated exo-planets, solar system exo-planets, and isolated brown dwarfs (Showman
2016). For instance, Kelt-9b (Gaudi et al. 2017) is a 2.88 MJup
planet orbiting a∼10 000 K star. This planet is expected to receive
∼700 times more UV irradiation than a planet orbiting the next hottest exoplanet host star (WASP-33). However, the primary star in the Kelt-9 system is still∼3000 K cooler than SDSS1411+1011A and∼6500 K cooler than WD0137-349A. The brown dwarf com-panion in this latter system has been shown to have an atmosphere that is significantly affected by UV irradiation (Casewell et al.2015; Longstaff et al.2017). In fact, Kelt-9b has been shown to have a day-nightside temperature difference of∼500 K, the same as the irradiated brown dwarf WD0137-349B, indicating poor heat re-distribution is present in both systems, despite their differences in
2018 The Author(s)
D
o
w
n
lo
a
d
e
d
fro
m
h
ttp
s:
//a
ca
d
e
mi
c.
o
u
p
.co
m/
mn
ra
s/
a
rt
icl
e
-a
b
st
ra
ct
/4
8
1
/4
/5
2
1
6
/5
1
0
6
3
6
2
b
y
g
u
e
st
o
n
1
5
O
ct
o
b
e
r
2
0
1
The direct detection of SDSS1411+2009B
5217
internal temperature. Studying irradiated brown dwarfs can there-fore provide a useful proxy for exoplanet systems, especially to explore the effects of UV irradiation and any resultant photochem-istry, as in general hot Jupiter host stars replicating the same con-ditions must be very large, making them challenging systems to observe. One of the most recently discovered of the post-common envelope systems, and the first eclipsing system to be discovered, SDSS1411+2009, was discovered as part of the Catalina Sky Survey by Drake et al. (2010). The substellar nature of the companion to the white dwarf was confirmed by Beuermann et al. (2013). While its period is very similar to that of the well-studied WD0137-349, the white dwarf is cooler withTeff=13 000±300 K and logg=
7.86± 0.07, giving a mass of 0.53±0.03 M⊙ (Littlefair et al.
2014). The brown dwarf mass is calculated to be 50±2 MJup, and
has an estimated spectral type of T5, derived from the secondary’s mass. Thez′band eclipse andKsexcess presented in Littlefair et al.
(2014) were used to estimate the dayside spectral type to be between L7 and T1, suggesting significant irradiation.
2 O B S E RVAT I O N S A N D D ATA R E D U C T I O N
We observed SDSSJ1411+2009 with the infrared imager HAWK-I (Kissler-Patig et al.2008) on the VLT as part of programme 94.C-0032. The data were obtained on the nights of the 2015 April 04, 2015 April 05, and the 2015 MArch 13 forJ,H, andKs,
respec-tively. The seeing was 1′in theJ, andHbands and between 1.5′
and 2.5′in theK
sband. We used the fast photometry mode,
allow-ing us to window the detector and reduce the deadtime between frames to a few microseconds, and used exposure times of 5 s in each of theJ, H, and Ksbands. We observed using chip 4, and
orientated the 128 pixel window to 120 deg to also observe a stan-dard star, 2MASS14112391+2008132 which was used to calibrate the photometry. The data were dark-subtracted, flat fielded, and ex-tracted using aperture photometry within the ULTRACAM pipeline (Dhillon et al.2007).
3 R E S U LT S
We usedLROCHE, part of theLCURVEsoftware to model the light curves (see Copperwheat et al.2010for a description). We sam-ple the posterior probability distributions for model parameters us-ing affine-invariant Markov-chain Monte Carlo (MCMC; Foreman-Mackey et al.2013). We used the system parameters given in Beuer-mann et al. (2013) and Littlefair et al. (2014) to set priors on the mass ratio, orbital period, angle of inclination, white dwarf temper-ature, and stellar radii. The covariance matrix from Littlefair et al. (2014) was used to create multivariate normal priors for the stellar radii and the inclination. Independent Gaussian priors were used for all other parameters. Since the light curves show evidence for red noise, presumably arising from instrumental systematics, we do not use the chi-squared statistic to estimate the likelihood. Instead we model the residuals from theLROCHEmodel using a Gaussian process with a Mat´ern-3/2 kernel and use the likelihood of the resid-uals (see McAllister et al.2017, for an example of this approach). Multiple, independent MCMC chains are run from different start-ing points, and we use the Gelman-Rubin diagnostic, applied to the independent runs, to test for convergence. We also tested that the results were insensitive to the kernel function adopted for the Gaussian process.
We adopt the limb darkening coefficients in Gianninas et al. (2013) for a 13 000 K, logg=8.00 white dwarf for theyband, as there are none available for the near-IR, although as this is within the
Raleigh–Jeans tail of the white dwarf spectrum, these coefficients are not expected to deviate much from these values. Additionally, given the S/N of our data, any deviation will have a negligible effect on our fit.
TheLROCHEmodel is used to measure the level of the reflection
effect caused as the heated side of the brown dwarf moves into view. The brightness temperature of an element on the companion is modelled as
T4 c,j= Tc gj gpole β4
+αGjTwd4,
whereαis the fraction of the incident flux which is absorbed (i.e. α=1−A), whereAis the albedo.gjis the surface gravity of the
element,gpoleis the surface gravity at the pole,β is the
gravity-darkening exponent, for which we adopted a value of 0.45. Gjis
a geometric factor which accounts for the fraction of the WD flux absorbed by the companion, taking the full Roche geometry into ac-count.TcandTwdare the black-body brightness temperatures of the
companion and white dwarf, respectively. Because our observations are within the Raleigh–Jeans tail of the white dwarf spectrum, the surface brightness of a white dwarf differs from that of the same-temperature black-body by less than 5 per cent. The light curve of an irradiated binary in a single band constrains theratioof brightness temperatures of the two components. Therefore, since a black-body is a reasonable description for the white dwarf, we can say that usingTcin the Planck function gives an accurate prediction of the
surface flux of the brown dwarf; these surface fluxes can be com-pared directly with surface fluxes predicted by irradiated models (Fig.1). The posterior probability distributions for these models are shown in FigsA1andA2.
Our model of the system in the Hband predicts a nightside temperature of the brown dwarf of 1540+−9070K and the fraction of flux
from the white dwarf absorbed by the brown dwarf as 0.50±0.06. The equivalent model for theKsband predicts 1000±500 K and
0.80± 0.15. As the Jband eclipse was not observed, we were unable to fit a model to these data, and instead fitted a sine curve to the data to measure the reflection effect as was done in Casewell et al. (2015) for WD0137-349.
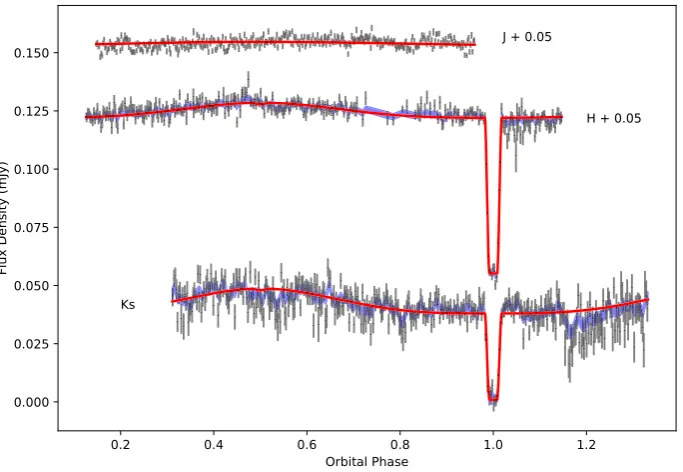
We detect the primary eclipse of the white dwarf in both theH
andKsdata (Figs2and3). We do not detect the secondary eclipse
in any of our data. Our model predicts that the secondary eclipse depth is 0.8 per cent in theHband and 3 per cent in theKsband,
which is smaller than our photometric errors (∼0.05 mags inH, and 0.2 mags inKs), and as the secondary eclipse is predicted to last∼
4 min including ingress and egress, we cannot bin our data up to a high enough precision.
The primary eclipse is total, not unexpected, as brown dwarf radii are typically comparable to that of Jupiter, while white dwarfs have radii similar to that of the Earth, hence all the flux we detect is from the nightside of the brown dwarf at this point. This flux is significantly non-zero in theH-band, making this the first direct detection of the dark side of an irradiated brown dwarf. The flux in theKsband is consistent with zero, which is reflected in our large
uncertainties on theKsbrightness temperature. Although our model
has calculated an average nightside temperature in theKsband, we
have chosen to give the nightside an upper limit of 1500 K to reflect the zero flux.
In addition to the detection of the nightside of the brown dwarf, we are also able to calculate the magnitude of the dayside of the brown dwarf due to the reflection effect in the system, causing sinusoidal variations as the tidally locked brown dwarf orbits the white dwarf.
MNRAS481,5216–5222 (2018)
Figure 1. JHKsband light curves phased on the ephemeris in Beuermann et al. (2013). The light curves have been offset for display purposes by 0.05 mJy in theHandJbands. The data have been plotted in 400 error-weighted flux bins for display purposes and the models are plotted with the red solid line. The shaded-blue region represents the 1σprediction of the binary model, plus the Gaussian process model of the systematics.
Figure 2. H-band light curve phased on the ephemeris in Beuermann et al. (2013), and zoomed in on the eclipse. The top panel shows the raw light curve and the binary plus Gaussian process model. The middle panel shows the data with the Gaussian process subtracted, and the binary model alone. The bottom panel shows the residuals to the binary model, and the Gaussian process. The models are plotted with the red solid line, and zero flux is marked by the dotted line.
The semi-amplitude of this variability is 0.0019±0.0003 mJy in the
Hband, and 0.0039±0.0006 mJy in theKsband. This variability
is slightly larger than that detected for the WD0137-349AB system (Casewell et al.2015) which has a similar period, but a hotter, and less massive white dwarf (Teff=16 500 K,M=0.4 M⊙Maxted
[image:4.595.53.280.344.509.2]et al.2006), but the errors are large on these measurements. We also used the MOLLY software package to search for any emission lines from the brown dwarf in the 28 UVB and VIS XSHOOTER spectra used to measure the radial velocity in Lit-tlefair et al. (2014). We did not detect Hαemission, as is seen for WD0137-349B (Maxted et al.2006), or any other emission lines as were detected by Longstaff et al. (2017) for the same system. As
Figure 3. Ksband light curve phased on the ephemeris in Beuermann et al. (2013), and zoomed in on the eclipse. Panels and plot markers are the same as in Fig.2.
SDSS1411+2009 is 3 mag fainter in the optical than the WD0137-349 system, we phase binned the data and combined the spectra in phase, but still did not detect any emission features from the brown dwarf. The data from the NIR arm of XSHOOTER are of not good enough quality to be used in any analysis.
4 D I S C U S S I O N
We calculated brightness temperatures for the dayside of the brown dwarf for theJband using a model white dwarf spectrum and the method detailed in Casewell et al. (2015). For theHandKsbands
where we have models of the system fromLCURVEwe generated a temperature map of the surface of the brown dwarf as was done
D
o
w
n
lo
a
d
e
d
fro
m
h
ttp
s:
//a
ca
d
e
mi
c.
o
u
p
.co
m/
mn
ra
s/
a
rt
icl
e
-a
b
st
ra
ct
/4
8
1
/4
/5
2
1
6
/5
1
0
6
3
6
2
b
y
g
u
e
st
o
n
1
5
O
ct
o
b
e
r
2
0
1
[image:4.595.319.534.344.531.2]The direct detection of SDSS1411+2009B
5219
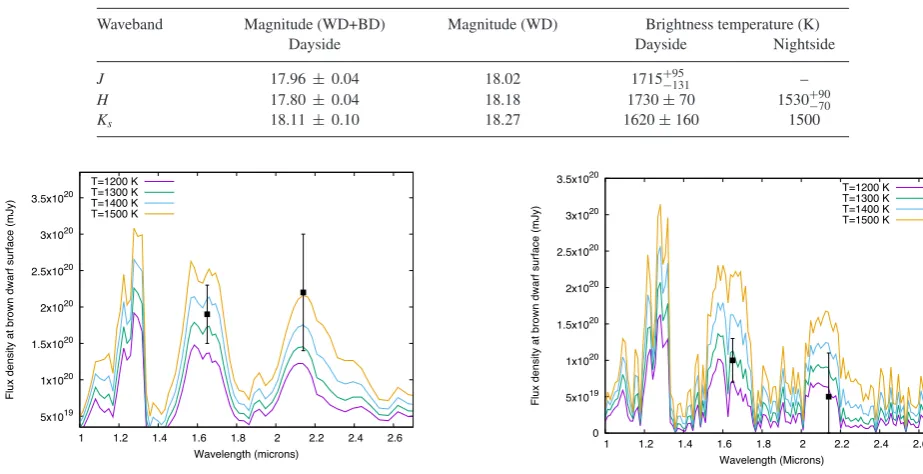
Table 1. Average brightness temperatures and apparent magnitudes for the system. The errors given are the standard 68 per cent confidence interval.
Waveband Magnitude (WD+BD) Magnitude (WD) Brightness temperature (K)
Dayside Dayside Nightside
J 17.96±0.04 18.02 1715+−95131 –
H 17.80±0.04 18.18 1730±70 1530+−9070
Ks 18.11±0.10 18.27 1620±160 1500
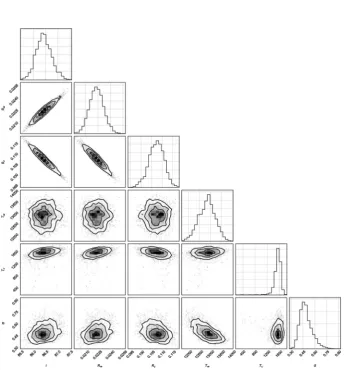
Figure 4. Dayside average surface flux densities of the brown dwarf (boxes) are shown with irradiated brown dwarf models of effective temperatures: 1200, 1300, 1400, and 1500 K.
in Hern´andez Santisteban et al. (2016). The average dayside and nightside temperatures are reported in Table1, although from the surface map of the brown dwarf we were also able to model the maximum and minimum temperatures present across the surface. These temperatures had a maximum of 1940±70 K in theHand 2000±150 K in theKsbands, and a minimum of 1530±90 K and
950±500 K in theHandKsbands, respectively.
We have generated irradiated brown dwarf models using the at-mospheric structure model of Marley et al. (1999), Marley et al. (2002), and Fortney et al. (2005) using the loggfrom Littlefair et al. (2014) and intrinsic effective temperatures (the temperature the brown dwarf would have in the absence of the white dwarf) ranging from 500 to 1500 K (Fig.4). The white dwarf irradiation was modelled using a 13 000 K black body at the appropriate sep-aration. We have chosen to use surface flux densities in displaying these data, as this removes any uncertainties associated with the radius of the brown dwarf and the distance to the system. While the daysideHandKsband fluxes are consistent with an irradiated
brown dwarf of 1300 K, it is clear that the daysideKsflux also
encompasses temperatures much hotter than 1500 K (the hottest model plotted). This is consistent with our findings in Casewell et al. (2015), where theKsband was much brighter than the models
predicted.
It can be seen that SDSS1411-2009B has an average difference in day–night side temperatures of 93±12 K in theHband, and a 360±80 K day–night difference in theKsband. As these
measure-ments are derived from theLCURVEmodel, they take into account the errors on the radii and the correlated errors relating to the dis-tance to the binary. The disdis-tance fromGaiaDR2 is 177±5 pc (Luri et al.2018), compared to 190±8 in Littlefair et al.(2014). These distances agree to within 1.5σ. Surface flux densities for the brown dwarf were derived from the brightness temperatures of each element using the Planck curve. To compare the nightside fluxes with models, we used non-irradiated cloud-free brown dwarf
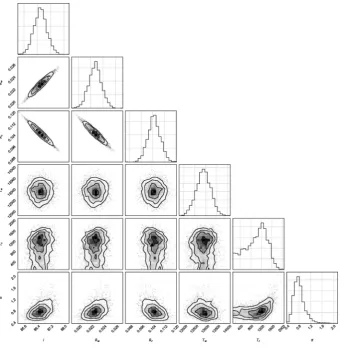
mod-Figure 5. Nightside average surface flux densities of the brown dwarf (boxes) are shown with non-irradiated, cloud-free brown dwarf models of the same effective temperatures as in Fig.4.
els, again using the atmospheric structure of Marley et al. (1999), Marley et al. (2002), and Fortney et al. (2005). These models and the nightside fluxes can be seen in Fig.5. Both theHandKsbands
are consistent withTeff=1300 K. This raises an interesting
conun-drum, as the estimatedTeffof the brown dwarf using the radius from
the light curves and the mass from the radial velocity solution com-bined with evolutionary models of Baraffe et al. (2003) is∼800 K (Littlefair et al.2014).
In comparison with a similar system, both SDSS1411-2009B and WD0137-349B have similar brightness temperatures (within the errors) in theHband on both the day and night sides, although the nightside of WD0137-349B is an upper limit, and the dayside temperature is not well constrained at 1585±329 K compared to 1730±70 K for SDSSJ1411-2009B. The nightside of SDSS1411-2009B in theHband appears to be hotter in than that of WD0137-349B, despite SDSSJ1411-2009B being of a later spectral type, but the errors on the upper limit mean we cannot state this conclusively. In theKsband, the dayside of WD0137-349B (2015 K) is hotter
than the dayside of SDSSJ1411-2009B (1620 K), as would be ex-pected for a brown dwarf orbiting a hotter white dwarf in a shorter orbit. The nightside brightness temperatures of both objects have large errors, however, as with theHnightside measurements, they may be similar temperatures.
Despite the white dwarf in SDSSJ1411+2009 being∼3500 K cooler than the white dwarf in WD0137-349B, there is not a large difference in the SED of the irradiated brown dwarfs in these sys-tems. WD0137-349B emits much more strongly in the ultraviolet (by a factor of∼10) than SDSS1411-2009A does, although the peak of the white dwarf SED is approximately at the same wavelength in both cases. This is likely to be the explanation for the lack of emission lines seen in the atmosphere of SDSSJ1411-2009B. The lack of UV irradiation means SDSSJ1411+2009 is unlikely to have a chromosphere, similar to that suggested for WD0137-349B by
MNRAS481,5216–5222 (2018)
D
o
w
n
lo
a
d
e
d
fro
m
h
ttp
s:
//a
ca
d
e
mi
c.
o
u
p
.co
m/
mn
ra
s/
a
rt
icl
e
-a
b
st
ra
ct
/4
8
1
/4
/5
2
1
6
/5
1
0
6
3
6
2
b
y
g
u
e
st
o
n
1
5
O
ct
o
b
e
r
2
0
1
Longstaff et al. (2017). This is also suggested by the lack of Hα emission lines in the optical spectra. However, despite this lack of emission lines, the same brightening is seen in theKsfor both
WD0137-349B and SDSSJ1411-2009B.
Our nightside brightness temperatures for SDSSJ1411-2009B indicate that in the absence of any heat transport, theTeff of the
brown dwarf is 1300 K. OurLCURVEmodelling of these light curves gives an absorb parameter (the fraction of flux from the white dwarf absorbed by the brown dwarf) of 0.50±0.06 in theHband and 0.80± 0.15 in theKsband. These parameters mean that if only
absorption and reprocessing within the brown dwarf atmosphere is important, SDSS1411J-2009B must be absorbing 50 per cent of the
Hband flux and 80 per cent of theKsband flux, in order to produce
the dayside brightness temperatures.
However, the brown dwarf effective temperature as estimated from the mass and radius is 800 K (Littlefair et al.2014). If this is the true effective temperature of the brown dwarf, were it an isolated object, then the absorb parameters must be even higher in order to produce enough heat transport to heat the nightside to 1300 K. The absorb parameter for theKs band is already close
to 100 per cent though, which would indicate there is poor energy circulation around the brown dwarf, supported by the 200 K day– nightside difference in theHband.
An additional factor that would affect estimates of temperature and energy circulation, may be fluorescence or emission within the brown dwarf atmosphere. We suggested this is present in WD0137-349B (Casewell et al.2015), again causing brightening in theKs
and 4.5µm bands. If this emission is present, it will increase the
dayside flux, particularly in theKsband, meaning that the absorb
parameter is artificially high. In particular it would mean that the brown dwarf needs to absorb a smaller fraction of flux in order to heat the nightside. This scenario is also potentially consistent with a lowerTeffof the brown dwarf. Emission from the dayside
has artificially increased the flux, leading to an overestimate of the effective temperature.
Observations of Kelt-1b, a T2 dwarf orbiting a main sequence star (Siverd et al.2012), seem to support the hypothesis of UV-induced brightening in theKsband. Kelt-1b, orbiting a 6500 K F5V star lacks
the intense UV irradiation of the white dwarf irradiated systems, and does not show this brightening. Indeed eclipse measurements suggest that this object fits very well with a field dwarf template (Croll et al.2015; Beatty et al.2017).
The only way we can, however, confirm this hypothesis of UV-induced emission is by obtaining spectrophotometry of SDSSJ1411-2009B with JWST. This would allow us to determine if atKsand
4.5µm the brown dwarf looks like an isolated field object on the
dayside, or whether UV-induced emission lines are present.
5 C O N C L U S I O N S
We have observed the close, post-common envelope binary SDSS1411+2009 with HAWK-I in theJHKsbands, and have
di-rectly detected the brown dwarf in theHandKsbands as it eclipses
its white dwarf companion. We have determined the brightness temperatures for the day and night-sides of the brown dwarf and measure a temperature difference of only∼200 K, compared to
∼500 K for WD0137-349B, a system with a similar period, but a hotter white dwarf primary. From comparing the surface fluxes to models of irradiated and non-irradiated brown dwarfs, we also determine that in general, the models indicate the brown dwarf is consistent withTeff=1300 K, but that the mass and radius suggest
an effective temperature that is much lower. As the brown dwarf is
already absorbing almost all the emission from the white dwarf in theKsband, this discrepancy suggests that an additional mechanism
is making theKsband brighter. This mechanism may be similar to
that suggested in WD0137-349B, hinting this may be a common trait in these systems, and may be due to photochemistry.
AC K N OW L E D G E M E N T S
We thank Detlev Koester for providing the white dwarf models. This work is based on observations made with ESO Telescopes at the La Silla Paranal Observatory. This work also makes use of the white dwarf models from Pierre Bergeron: ∼bergeron/CoolingModels. SLC acknowledges support from the University of Leicester, Col-lege of Science and Engineering. SPL is supported by STFC grant ST/M001350/1, and TRM is supported by STFC grant ST/L000733. SGP acknowledges the support of the Leverhulme Trust.
R E F E R E N C E S
Anderson D. R. et al., 2011,ApJ, 726, L19
Baraffe I., Chabrier G., Barman T. S., Allard F., Hauschildt P. H., 2003, A&A, 402, 701
Bayliss D. et al., 2017,AJ, 153, 15
Beatty T. G., Madhusudhan N., Pogge R., Chung S. M., Bierlya A., Gaudi B. S., Latham D. W., 2017,AJ, 154, 242
Beuermann K. et al., 2013,A&A, 558, A96
Burleigh M. R., Hogan E., Dobbie P. D., Napiwotzki R., Maxted P. F. L., 2006,MNRAS, 373, L55
Burleigh M. R. et al., 2011, in Schuh S., Drechsel H., Heber U., eds, AIP Conf. Proc. Vol. 1331, Planetary Systems Beyond the Main Sequence. Am. Inst. Phys., New York,p. 262
Casewell S. L. et al., 2012,ApJ, 759, L34 Casewell S. L. et al., 2015,MNRAS, 447, 3218 Casewell S. L. et al., 2018,MNRAS, 476, 1405
Copperwheat C. M., Marsh T. R., Dhillon V. S., Littlefair S. P., Hickman R., G¨ansicke B. T., Southworth J., 2010,MNRAS, 402, 1824
Croll B. et al., 2015,ApJ, 802, 28
Dhillon V. S. et al., 2007,MNRAS, 378, 825
Dobbie P. D., Burleigh M. R., Levan A. J., Barstow M. A., Napiwotzki R., Hubeny I., 2005,A&A, 439, 1159
Drake A. J. et al., 2010, preprint(arXiv:1009.3048) Farihi J., Christopher M., 2004,AJ, 128, 1868
Farihi J., Parsons S. G., G¨ansicke B. T., 2017, Nature Astron., 1, 0032 Foreman-Mackey D., Hogg D. W., Lang D., Goodman J., 2013,PASP, 125,
306
Fortney J. J., Marley M. S., Lodders K., Saumon D., Freedman R., 2005, ApJ, 627, L69
Gaudi B. S. et al., 2017,Nature, 546, 514
Gianninas A., Strickland B. D., Kilic M., Bergeron P., 2013,ApJ, 766, 3 Grether D., Lineweaver C. H., 2006,ApJ, 640, 1051
Hern´andez Santisteban J. V. et al., 2016,Nature, 533, 366 Hodˇzi´c V. et al., 2018, MNRAS, preprint(arXiv:1807.07557) Kissler-Patig M. et al., 2008,A&A, 491, 941
Littlefair S. P. et al., 2014,MNRAS, 445, 2106
Longstaff E. S., Casewell S. L., Wynn G. A., Maxted P. F. L., Helling C., 2017,MNRAS, 471, 1728
Luri X. et al., 2018, A&A, 616, A9
Marley M. S., Gelino C., Stephens D., Lunine J. I., Freedman R., 1999,ApJ, 513, 879
Marley M. S., Seager S., Saumon D., Lodders K., Ackerman A. S., Freedman R. S., Fan X., 2002,ApJ, 568, 335
Maxted P. F. L., Napiwotzki R., Dobbie P. D., Burleigh M. R., 2006,Nature, 442, 543
McAllister M. J. et al., 2017,MNRAS, 464, 1353 Metchev S. A., Hillenbrand L. A., 2004,ApJ, 617, 1330 Parsons S. G. et al., 2017,MNRAS, 471, 976
The direct detection of SDSS1411+2009B
5221
Rappaport S. et al., 2017,MNRAS, 471, 948 Showman A. P., 2016,Nature, 533, 330 Siverd R. J. et al., 2012,ApJ, 761, 123
Steele P. R., Burleigh M. R., Dobbie P. D., Jameson R. F., Barstow M. A., Satterthwaite R. P., 2011,MNRAS, 416, 2768
Steele P. R. et al., 2013,MNRAS, 429, 3492
[image:7.595.126.477.166.537.2]A P P E N D I X A : P O S T E R I O R P R O B A B I L I T Y D I S T R I B U T I O N S
Figure A1. Posteriorprobability distributions for model parameters obtained through fitting theHband light curve. See Section 3 for details of the model used. Grey-scales and contours illustrate the joint probability distributions for each pair of parameters, while histograms show the marginalized probability distribution for each individual parameter.
MNRAS481,5216–5222 (2018)
D
o
w
n
lo
a
d
e
d
fro
m
h
ttp
s:
//a
ca
d
e
mi
c.
o
u
p
.co
m/
mn
ra
s/
a
rt
icl
e
-a
b
st
ra
ct
/4
8
1
/4
/5
2
1
6
/5
1
0
6
3
6
2
b
y
g
u
e
st
o
n
1
5
O
ct
o
b
e
r
2
0
1
Figure A2. Same as for Fig.A1in theKsband.
This paper has been typeset from a TEX/LATEX file prepared by the author.
D
o
w
n
lo
a
d
e
d
fro
m
h
ttp
s:
//a
ca
d
e
mi
c.
o
u
p
.co
m/
mn
ra
s/
a
rt
icl
e
-a
b
st
ra
ct
/4
8
1
/4
/5
2
1
6
/5
1
0
6
3
6
2
b
y
g
u
e
st
o
n
1
5
O
ct
o
b
e
r
2
0
1