Int. J. Electrochem. Sci., 8 (2013) 7138 - 7155
International Journal of
ELECTROCHEMICAL
SCIENCE
www.electrochemsci.org
The Effect of Temperature on the Corrosion Inhibition of Mild
Steel in 1 M HCl Solution by
Curcuma Longa
Extract
Nurul Izni Kairi*, Jain Kassim
Materials and Corrosion Chemistry Laboratory, School of Chemical Sciences, Universiti Sains Malaysia, 11800 Penang, Malaysia.
*
E-mail: [email protected]
Received: 20 December 2012 / Accepted: 9 April 2013 / Published: 1 May 2013
The corrosion inhibition mechanism of the Curcuma longa extract on mild steel surface in 1 M HCl has been studied at different temperatures (30-55 oC) by gravimetric measurements. The inhibition efficiency decreases with increasing temperature. As the concentration of the extract increased, higher activation energy, enthalphy of activation and entropy of activation were obtained. The inhibition were physisorption in nature with an endothermic reaction. The adsorption process was more favoured at lower temperatures with larger negative standard free energy. The adsorption process on the mild steel surface obeys the Langmuir adsorption isotherm.
Keywords: organic compounds; electron microscopy; corrosion; adsorption; thermodynamic properties; surface properties.
1. INTRODUCTION
Corrosion is a natural occurring process where it can be defined as the deterioration of a material’s properties due to its interaction with its environment. Corrosion can lead to failures in plant infrastructure and machines which are usually costly to repair, in terms of loss of contaminated products, environmental damage and possibly costly in terms of human health. The driving force that causes metals to corrode is due to the natural consequence of their temporary existence in metallic form. The primary corrosion product of iron, exists as, eg. Fe(OH2), or more likely FeO•nH2O, but the action of oxygen and water can yield other products having different colours [1]:
Fe3O4•H2O or hydrated magnetite, known as ferrous ferrite, written as (Fe2O3•FeO), most often green but can be deep blue in the presence of organic complexants.
Fe3O4 or magnetite which is black.
Mild steel being the important alloy of iron has found a wide application in industries, constructional materials and machines due to its low cost and excellent mechanical properties despite of its tendency to corrosion in aqueous solution, especially in acidic media [2-5]. Acid solutions are often used in the industry for industrial acid cleaning, pickling, descaling, oil well acidizing and petrochemical processes which are normally accompanied by considerable dissolution of metal [6-10]. The use of corrosion inhibitor is usually the most promising, effective, flexible and cost attractive method to reduce the corrosive attack of acid solutions [11, 12]. Corrosion inhibitors are chemical compound usually used in small concentration which when added to a corrosive media retards the corrosion process and keeps its rate to a minimum [13, 14]. Among them, organic compounds containing heteroatoms such as nitrogen, oxygen, sulphur and phosphorus, π electrons in triple or conjugated double bonds possess the ability to act as good corrosion inhibitor as they are easily adsorbed onto the metal surface [15-19]. It is widely accepted that organic inhibitors exhibit corrosion via adsorption. The inhibition mechanism is a separation process involving (i) the inhibitor is adsorbed on the surface of the metal forming a compact protective thin layer and (ii) the inhibitor forms a precipitate on the surface of the metal, acting on the aggressive media to form protective precipitates or remove the aggressive agents [20]. Adsorption, on the other important notes can be described by two main types of interaction, which are physisorption and chemisorption, where [21, 22]:
Physisorption: involves electrostatic forces between ionic charges or dipoles on the adsorbed species and the electric charge at the metal/solution interface. The heat of adsorption is low, thus, this adsorption is only stable at relatively low temperature.
Chemisorption: involves charge transfer or sharing from the inhibitor molecules to the metal surface to form a coordinate type bond. This type of adsorption is known to have much stronger adsorption energy compared to the other mode of adsorption. Thus, such bond is more stable at higher temperature.
[image:2.596.179.438.651.727.2]Unfortunately, most of the reported inhibitors used in the industry are highly toxic, so they are very hazardous to the environment, expensive and non-environmentally friendly, thus these factors limit their applications [23, 24]. Many environmental laws have been made to impose and to divert researchers to the use of natural products as an alternative substitution. The employment of natural products extracted from leaves, rhizomes, seeds or bark of the extracts are due to its ‘green’ effects, practical use, inexpensive, relatively non-toxic, readily available and comes from renewable resources.
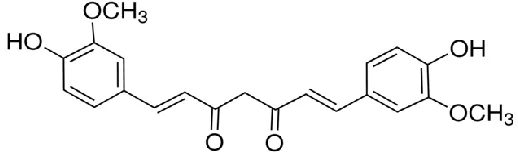
Curcuma longa or generally known as turmeric has long been used as a common household medicine, food colorant and spice in Southeast Asia. It is known that curcumin; 1,7-bis(4-Hydroxy-3-methoxyphenl)-1,6-heptadiene-3,5-dione (Fig. 1) is the major active compound found in turmeric.
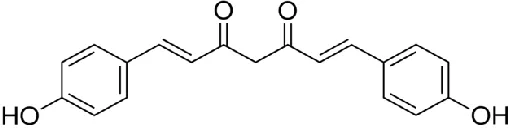
[image:3.596.169.424.255.322.2]The other two curcuminoids are demethoxy curcumin (Fig. 2) and bis-demethoxy curcumin (Fig. 3). These three curcuminoids are natural phenol and they are responsible for the yellow colour of turmeric. The structural of these curcuminoids itself which possess heterocyclic compounds with polar functional group, conjugated double bonds, hydroxyl, oxygen and the non-toxicity factors that show the ability to act as organic corrosion inhibitor, there comes our interests to choose turmeric extracts to be used as corrosion inhibitor.
Figure 2. Chemical structure of demethoxy curcumin.
Figure 3. Chemical structure of bis-demethoxy curcumin.
Thermodynamic adsorption parameters and kinetics of corrosion parameters are useful for clarifying the adsorption behaviour of an inhibitor [21]. The effect of temperature on the inhibited acid-metal reaction is highly complex because many changes occur on the metal surface, such as rapid etching, desorption of inhibitor and the inhibitor itself may undergo decomposition and/or rearrangement [21, 26]. The aim of this work is to investigate the inhibition, pH and temperature effects of turmeric extracts, hence to study the thermodynamic of adsorption and activation energies of the extract in order to clarify how this inhibitor works on mild steel in 1 M HCl by using gravimetric measurements.
2. EXPERIMENTAL 2.1Preparation of extract
[image:3.596.171.430.395.461.2]
powder (~250 mesh) followed by further drying at 50 oC to a constant weight. The dried rhizome powder of turmeric was defatted twice overnight using 25 mL hexane (1:5 m/v) at 200 rpm at room temperature (30 ± 2 o
C) by means of maceration technique for the removal of lipid and oils from the extract. The defatted residue was then extracted with 95% aqueous ethanol (1:10 m/v) incubated for 3 hours by means of orbital shaker at 200 rpm. Afterwards, the extract was concentrated at 50 oC under reduced pressure by means of rotary evaporator to remove the ethanol. The aqueous fraction was then freeze dried to remove the water content.
2.2 Preparation of metal specimen
The mild steel specimens having composition (wt%) of 0.14% C, 0.20% Si, 0.15% Mn, 0.10% Ni, 0.14% Cu and remaining Fe were mechanically abraded with a series of emery papers from 120 to 1200 grades. The samples were then washed thoroughly with distilled water, degreased with isopropanol and air dried.
2.3 Preparation of test solution
The test solutions were prepared by the dilution of analytical grade 37% HCl with distilled water up to the optimum inhibitor concentration of the extract. For pH studies, the test solutions were prepared by the dilution of distilled water up to the optimum concentration where it can reach by adjusting the pH using HCl and NaOH. Inhibitors were dissolved in acid solution at required concentrations in ppm (mg L-1) and the solution in the absence of inhibitor was taken as blank for comparison purposes. Due to the fact that curcumin which is the major active compound in turmeric has low aqueous solubility, hence both of the test solutions were first dissolved in 10% ethanol and they were put in sonicator for 5 minutes.
2.4 Determination of total phenolic content
2.5 Gravimetric study
The gravimetric method (weight loss, wL) is known to be the most widely used method of
monitoring inhibition efficiency [18]. The mild steel specimens of dimension 4 x 3 x 0.1 cm were used in these studies. The weight loss measurements were conducted under total immersion using 250 mL capacity beakers containing 100 mL of test solutions with and without the extract for 24 hours at 30, 35, 45 and 55 oC (303 K, 308 K, 318 K and 328 K) maintained in a thermostated water bath. The specimens were weighed before and after the tests using an analytical balance with a precision of 0.1 mg. The specimens were taken out after the 24 hours of immersion, washed, dried and reweighed accurately to determine the weight loss of mild steel. For pH studies, same method have been applied, except the pH of the test solutions were first been adjusted to the desired pH. All measurements were performed few times and average values were reported to obtain good reproducibility. The corrosion rate (ρ) in mg cm-2
h-1 in the absence and presence of extract was determined using the following equation:
(1)
where ∆W is the average weight loss of the mild steel specimens, A is the total area of mild steel specimen and t is the immersion time in 24 hours. The percentage inhibition efficiency (IE%) was calculated using the relationship:
(2)
where Wo and Wi are the weight loss values in the absence and presence of extract.
2.6 SEM-EDX analysis
The surface morphology of the corroded and inhibited species of mild steel was investigated by using scanning electron microscopy (LEO Supra 50 VP Field Emission SEM) equipped with Oxford INCA x activation energy dispersive x-ray microanalysis system (Carl-Ziess SMT). The images were taken after immersing the samples for 24 hours at room temperature in 1 M HCl without and with the presence of 60 ppm and 80 ppm of the extract.
3. RESULTS AND DISCUSSION 3.1 Total phenolic content
standard curcumin clearly proved that the extract gives 97.13 mg GAE/ g dry sample while standard curcumin gives 184.63 mg GAE/ g dry sample. The theory of Folin-Ciocalteau assay lies on the reduction of a phosphotungstate-phosphomolybdate complex by phenolics to a mixture of blue oxides which have a maximal absorption in the region of 760 nm [28]. In conjunction with the extract and standard curcumin, after the addition of Folin-Ciocalteau reagent to the samples, the yellow colour of the reagent will be converted into blue colour solution as an indication that there is phenolic content present in the extract as in the standard curcumin.
Table 1. The effect of different samples on phenolic profile.
Sample(s) TPC (mg GAE/g dry sample)
Extract 97.13 ± 3.01
Standard curcumin 184.63 ± 3.01
Data are expressed as mean ± standard deviation (n=2)a .
[image:6.596.96.494.429.698.2]3.2 Gravimetric study 3.2.1 Effect of pH
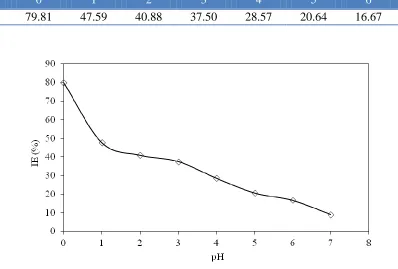
Table 2. Inhibition efficiency for various pH of 80 ppm extract at 30 oC for the corrosion of mild steel.
pH 0 1 2 3 4 5 6 7
IE (%) 79.81 47.59 40.88 37.50 28.57 20.64 16.67 9.09
The influence of pH on the corrosion of mild steel has been studied in the range of pH 1-7 of 80 ppm extract at room temperature (30 oC). This study is important to gain knowledge concerning the efficiency of the extract at various pH to which the addition of the extract will gives highest inhibition, and to which the mild steel is seriously corroded. Fig. 4 and Table 2 show the results on the effect of pH.
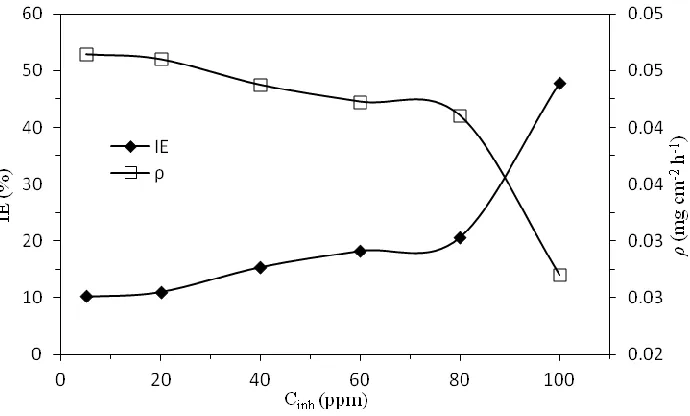
[image:7.596.129.474.279.487.2]As pH values approaching 0, which is the pH values in 1 M HCl media, the inhibition efficiency is at its maximum. It is remark from the results that the corrosiveness of acid is the main factor contributing to the aggressive attack on the mild steel surface, thus leading to the highest inhibitory effect of the extract. The corrosion parameters obtained by conducting the weight loss study at pH 5, which is the pH at which the extract is being prepared in distilled water media are presented in Fig. 5.
Figure 5. Relationship between corrosion rate (ρ) and the inhibition efficiency (IE) with the concentration of extract for mild steel in 1 M HCl after 24 hours at pH 5.
It is apparent that the inhibition efficiency increases with increasing concentration and the corrosion rate decreases as the concentration of the extract increases. However, due to the fact that mild steel is mildly corroded at pH near neutral and the corrosive attack of mild steel in 1 M HCl at pH 0 is severe, the studies on 1 M HCl is in our main scope of interests.
3.2.2 Effect of temperature
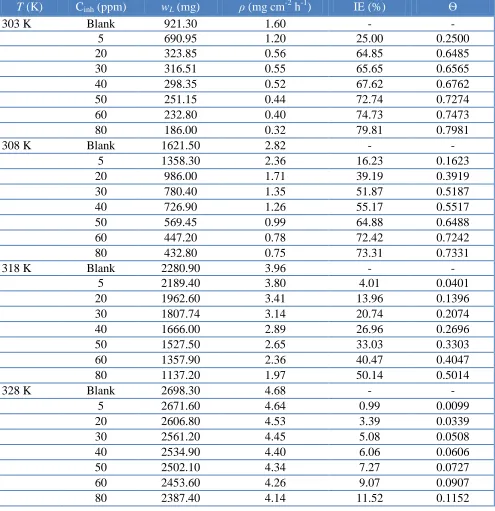
[image:8.596.53.548.192.703.2]
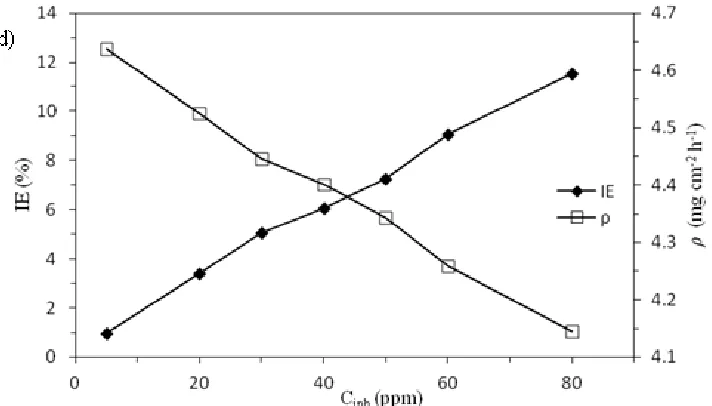
extract. The variation of corrosion rate and inhibition efficiency with concentration of the extract are shown in Figs. 6 (a, b, c and d). It can be observed that the corrosion rate of mild steel decreases while the inhibition efficiency increases as the concentration of the extract increases.
Table 3. Corrosion parameters for mild steel in 1 M HCl containing various concentrations of extract at the influence of temperature.
T (K) Cinh (ppm) wL (mg) ρ (mg cm-2 h-1) IE (%) Ѳ
303 K Blank 921.30 1.60 - -
5 690.95 1.20 25.00 0.2500
20 323.85 0.56 64.85 0.6485
30 316.51 0.55 65.65 0.6565
40 298.35 0.52 67.62 0.6762
50 251.15 0.44 72.74 0.7274
60 232.80 0.40 74.73 0.7473
80 186.00 0.32 79.81 0.7981
308 K Blank 1621.50 2.82 - -
5 1358.30 2.36 16.23 0.1623
20 986.00 1.71 39.19 0.3919
30 780.40 1.35 51.87 0.5187
40 726.90 1.26 55.17 0.5517
50 569.45 0.99 64.88 0.6488
60 447.20 0.78 72.42 0.7242
80 432.80 0.75 73.31 0.7331
318 K Blank 2280.90 3.96 - -
5 2189.40 3.80 4.01 0.0401
20 1962.60 3.41 13.96 0.1396
30 1807.74 3.14 20.74 0.2074
40 1666.00 2.89 26.96 0.2696
50 1527.50 2.65 33.03 0.3303
60 1357.90 2.36 40.47 0.4047
80 1137.20 1.97 50.14 0.5014
328 K Blank 2698.30 4.68 - -
5 2671.60 4.64 0.99 0.0099
20 2606.80 4.53 3.39 0.0339
30 2561.20 4.45 5.08 0.0508
40 2534.90 4.40 6.06 0.0606
50 2502.10 4.34 7.27 0.0727
60 2453.60 4.26 9.07 0.0907
80 2387.40 4.14 11.52 0.1152
Figure 6. Relationship between corrosion rate (ρ) and the inhibition efficiency (IE) with the concentration of extract for mild steel in 1 M HCl after 24 hours at different temperature: (a) 303 K, (b) 308 K, (c) 318 K and (d) 328 K.
The increase in temperature might stimulate larger metal surface kinetic energy, which has an adverse effect on the adsorption process where it weakens the adsorption process and encourage desorption process, hence the equilibrium shift towards desorption as follows [30]:
(3)
3.2.3 Corrosion kinetic parameters
The dependence of the corrosion rate on temperature can be expressed by the Arrhenius equation and transition state equation as presented in Eqs. (4) and (5), respectively [29-33]:
(4)
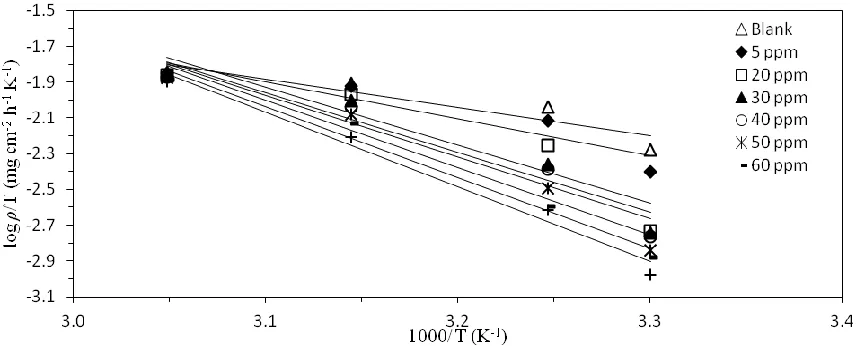
(5)
where ρ is the corrosion rate, Ea is the apparent activation energy, R is the universal gas
constant (8.314 J mol-1 K-1), T is temperature, A is the Arrhenius pre-exponential factor, h is the Plank’s constant (6.626176 x 1034
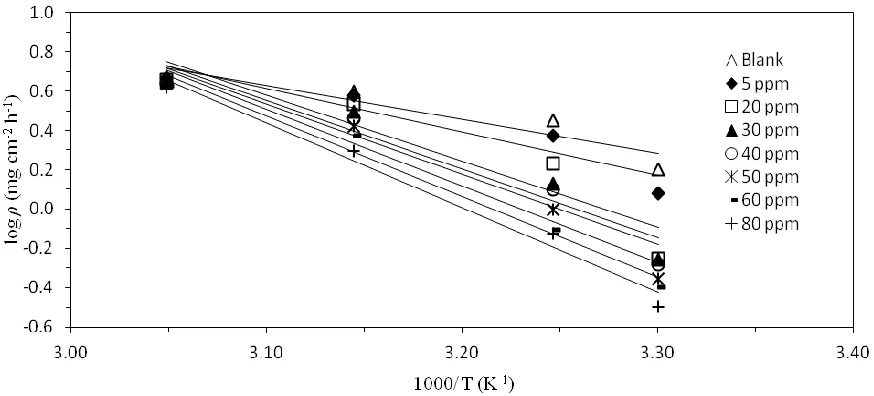
Js), N is the Avogadro’s number (6.02252 x 10²³ mol-1), ∆S is the entropy of activation and ∆H is the enthalpy of activation. The plot of log ρ against 1/T is presented in Fig. 7. The slope of the line is (-Ea/2.303 RT) and the intercept of the line extrapolated gives log A.
[image:10.596.125.481.75.278.2]
increase in Ea in presence of inhibitor compared to the absence, is frequently being interpreted as the
[image:11.596.79.516.139.337.2]formation of an adsorptive film of physisorption [34].
Figure 7. Arrhenius plots for mild steel corrosion in 1 M HCl in the absence and presence of different concentrations of extract.
All calculated parameters are given in Table 4. Higher values of Ea in the presence of extract
which acts as inhibitor is a good indication of strong inhibitive action of the extract by increasing the energy barrier for the corrosion process. Higher values of Ea in the presence of extract can also be
correlated with the increase in thickness of the double layer that enhance the Ea of the corrosion
[image:11.596.46.551.565.714.2]process [35].
Table 4. Activation parameters, pre-exponential factor, enthalphy and entropy of dissolution reaction of mild steel in 1 M HCl containing various concentrations of extract.
Media (ppm)
A (mg cm-2 h-1)
Ea
(kJ mol-1)
r2 ∆H
(kJ mol-1)
∆S (J mol-1 K-1)
r2
Blank 9.40 x 10⁵ 33.02 0.8731 30.40 -139.39 0.8531
5 2.81 x 10⁷ 42.22 0.8864 39.60 -111.15 0.8725
20 1.06 x 10¹¹ 64.51 0.8646 61.89 -42.67 0.8544
30 2.45 x 10¹¹ 66.94 0.9235 64.32 -35.69 0.9174
40 3.81 x 10¹¹ 68.23 0.9375 65.61 -32.01 0.9326
50 3.90 x 10¹² 74.64 0.9603 72.02 -12.67 0.9573
60 1.67 x 10¹³ 78.75 0.9804 76.13 -10.63 0.9789
80 6.32 x 10¹³ 82.52 0.9805 79.90 10.49 0.9791
respectively were calculated and also listed in Table 4. The positive values of ∆H reflect the endothermic nature of the mild steel dissolution process. The negative values of ∆S imply that the disorderness is increased on going from reactant to product. It is observed that the shift of ∆S to more positive values on increasing the concentration of the extract is the driving force that can overcome the barriers for the adsorption of inhibitor onto the mild steel surface.
Figure 8. Transition state plots for mild steel corrosion in 1 M HCl in the absence and presence of different concentrations of extract.
3.2.4 Adsorption isotherm
It is useful to describe the adsorption process by an appropriate adsorption isotherm. The extent of corrosion inhibition mainly depends on the surface conditions and mode of adsorption of the inhibitor. Assumptions were made that the uncovered parts of the metal surface is equal to zero and the corrosion process takes place only at the uncovered parts of the metal surface. The degree of surface coverage (Ѳ) has been calculated as follows, Ѳ = IE/100 by assuming a direct relationship between surface coverage and inhibition efficiency as presented in Table 3 [36]. In order to gain an insight to the mode of adsorption of the extract onto the mild steel surface, the surface coverage values were fitted into few adsorption isotherms and the values of correlation coefficient (r2) were used to determine the best fit. The data were fitted to Langmuir, Frumkin, Temkin and Florry-Huggins adsorption isotherms according to the following equations [20, 37-45]:
(6)
(7)
[image:12.596.83.511.175.348.2]
(9)
where C is the concentration of extract, Kads is the adsorptive equilibrium constant, f is the
heterogenous factor of the metal surface describing the molecular interactions in the adsorption layer and the heterogeneity of the metal surface. If f > 0, mutual repulsion of molecules occur and if f < 0 attraction takes place. x is the number of inhibitor molecules occupying an active sites or the number of water molecules replaced by one molecule of the extract. Kads is related to the standard free energy
of adsorption, ∆G by the following equation [46-48]:
(10)
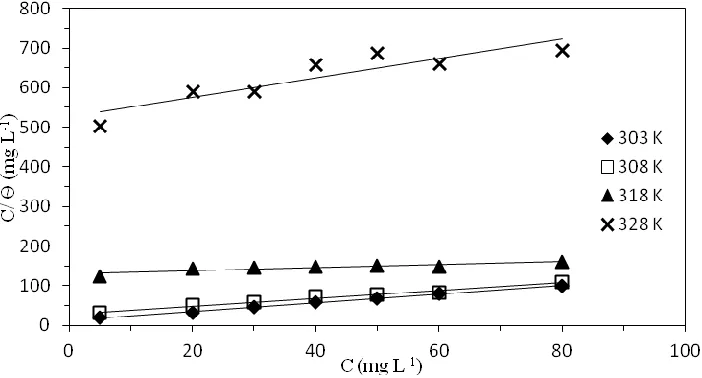
where the numeral of 55.5 is the molar concentration of water in solution, R is the universal gas constant (8.314 J mol-1 K-1) and T is temperature (K). The plots of C/Ѳ versus C which is the Langmuir adsorption isotherm gives a straight line with an intercept of 1/Kads as shown in Fig. 9. Kads values are
[image:13.596.122.473.365.554.2]given in the unit of L mg-1.
Figure 9. Langmuir adsorption isotherm plots at different temperatures.
Before calculating the parameters, the Kads unit should be changed into L mol-1 (M-1) in order to agree with the basic unit of SI and the calculated Kads values in the unit of M-1 are given in Table 5, as
well as various calculated parameters. Assumptions were made to account the molecular weight of the extract as 368.38 g mol-1as per the molecular weight of curcumin, which is the active compound in turmeric. Langmuir adsorption isotherm assumes that [49, 50]:
(i) The metal surface contains a fixed number of adsorption sites and each site holds one adsorbate.
(iii) The adsorbates do not interact with one another, i.e. there is no effect of lateral interaction of the adsorbates on ∆G.
The linearity of the Langmuir plot may be interpreted to suggest that the experimental data obeyed the Langmuir adsorption isotherm. The negative values of ∆G suggests that the adsorption of inhibitors on mild steel surface is a spontaneous process. Generally, the adsorption type is regarded as physisorption if the values of up to -20 kJ mol-1 or lower, while those more negative than -40 kJ mol-1 involve sharing or transfer of electrons from the inhibitor molecules to the metal surface to form a co-ordinate type of bond, regarded as chemisorption [51-53]. High value of Kads at lower temperature
[image:14.596.46.552.278.358.2]reflects the high adsorption ability of the extract on mild steel surface.
Table 5. Calculated parameters for Langmuir adsorption isotherm.
T (K) Kads(L mg-1) Kads(M-1) r2 ∆G (kJ mol-1)
303 0.0789 2.91 x 10⁴ 0.9944 - 36.01
308 0.0350 1.29 x 10⁴ 0.9835 -34.52
318 7.68 x 10⁻³ 2.83 x 10³ 0.8088 -31.63
328 1.90 x 10⁻³ 7 x 10² 0.8175 -28.82
3.3 SEM-EDX analysis
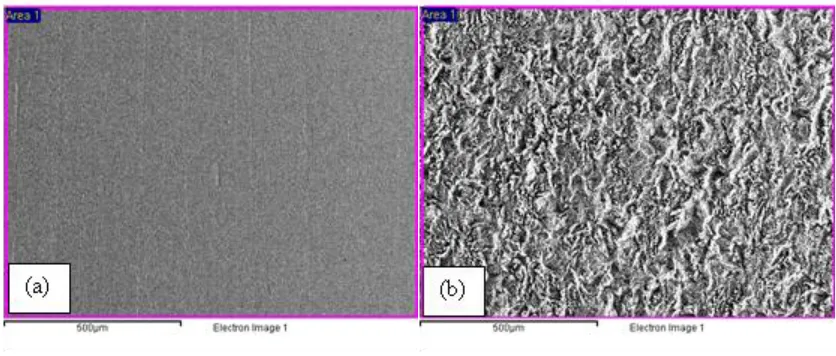
Fig. 11 (a) depicts the morphologies of polished mild steel. SEM micrographs obtained from mild steel surface after 24 hours of immersion in 1 M HCl for the untreated mild steel and treated mild steel in 60 ppm and 80 ppm extract are shown in Figs. 11 (b, c, d), respectively. Figs. 12 (a, b, c and d) represents EDX of polished mild steel, exposed to 1 M HCl, and treated mild steel in 60 ppm and 80 ppm extract, respectively.
[image:14.596.89.507.571.749.2]
Figure 11. SEM micrographs on the surface of mild steel: (a) Polished mild steel; after 24 hours of immersion: (b) Untreated mild steel in 1 M HCl, (c) Treated mild steel in the presence of 60 ppm extract and (d) Treated mild steel in the presence of 80 ppm extract.
[image:15.596.163.434.425.730.2]
Figure 12. EDX of (a) Polished mild steel; after 24 hours of immersion: (b) Untreated mild steel in 1 M HCl, (c) Treated mild steel in the presence of 60 ppm extract and (d) Treated mild steel in the presence of 80 ppm extract.
As shown in Figs. 12, it is clear that in presence of the extract, the weight percentage (wt. %) of C increased while Cl decreased. In other words, the peak of C observed increased and the peak of Cl decreased in the presence of extract. It is also observed from Fig. 12 (b) that the O peak is high in very corrosive media in comparison to the polished and treated mild steel. Thus, it can be concluded that there is a good protective film adsorbed on the mild steel surface which is responsible for the corrosion inhibitive effect.
4. CONCLUSION
The following results can be drawn from this study:
1) Inhibition efficiency values increase with the inhibitor concentration but decrease with rise in temperature suggesting physisorption.
3) The Langmuir adsorption isotherm provide a formal description of the adsorptive behaviour of the extract on mild steel surface. The values of ∆G and Kads indicate the spontaneous
interaction with high adsorption ability of extract at lower temperature.
4) SEM studies reveal that the corrosion of mild steel in 1 M HCl was diminished by the addition of the extract. A smoother surface were observed.
ACKNOWLEDGEMENT
This work was carried out in the frame of research project funded by Universiti Sains Malaysia under the Research University, RU-USM-Postgraduate Research Grant Scheme, (1001/PKIMIA/834082). One of the authors (Nurul Izni Kairi) gratefully acknowledge the financial support from Yayasan Sarawak Tunku Abdul Rahman scholarship for the full sponsorship award.
References
1. P.R. Roberge, Corrosion Engineering: Principles and Practice, The McGraw-Hill Companies, New York (2008)
2. G.E. Badr, Corros. Sci. 51 (2009) 2529
3. Z. Tao, W. He, S. Wang, S. Zhang and G. Zhou, Corros. Sci. 60 (2012) 205 4. A. Döner and G. Kardas, Corros. Sci. 53 (2011) 4223
5. M.K. Pavithra, T.V. Venkatesha, M.K. Punith Kumar and H.C. Tondan, Corros. Sci. 60 (2012) 104 6. E.E. Oguzie, Corros. Sci. 50 (2008) 2993
7. H. Keleş, Mater. Chem. Phys. 130 (2011) 1317
8. M.A. Amin, S.S.A. El-Rehim, E.E.F. El-Sherbini and R.S. Bayoumi, Electrochim. Acta. 52 (2007) 3588
9. E. Bayol, A.A. Gṻrten, M. Dursun and K. Kayakirilmaz, Acta Phys. Chim. Sin. 24 (2008) 2236 10. G. Kardaş, Mater. Sci. 41 (2005) 337
11. F.S. de Souza and A. Spinelli, Corros. Sci. 51 (2009) 642
12. X. Zhou, H. Yang and F. Wang, Electrochim. Acta. 56 (2011) 4268 13. A.Y. El-Etre, J. Colloid Interface Sci. 314 (2007) 578
14. P.B. Raja and M.G. Sethuraman, Mater. Lett. 62 (2008) 113 15. A.O. Yṻce and G. Kardaş, Corros. Sci. 58 (2012) 86
16. L. Valek and S. Martinez, Mater. Lett. 61 (2007) 148
17. M. Gopiraman, N. Selvakumaran, D. Kesavan and R. Karvembu, Prog Org Coat. 73 (2012) 104 18. I.B. Obot and N.O. Obi-Egbedi, Corros. Sci. 52 (2010) 198
19. X. Wang, H. Yang and F. Wang, Corros. Sci. 53 (2011) 113
20. A.R. El-Sayed, H.S. Mohran and H.M. Abd El-Lateef, Corros. Sci. 52 (2010) 1076 21. E.A. Noor and A.H. Al-Moubaraki, Mater. Chem. Phys. 110 (2008) 145
22. I.N. Levine, Physical Chemistry, McGraw Hill, New York (1995)
23. M.A. Amin, S.S.A. El-Rehim, E.E.F. El-Sherbini and R.S. Bayoumi, Electrochim. Acta. 52 (2007) 3588
24. H. Ashassi-Sorkhabi, D. Seifazadeh and M.G. Hosseini, Corros. Sci. 50 (2008) 3363 25. J. Ravindran, G.V. Subbaraju, M.V. Ramani, Bokyung Sung and B.B. Aggarwal, Biochem
Pharmacol. 79 (2010) 1658
26. H.H. Hasan, Electrochim. Acta. 53 (2007) 1722
29. H. Zarrok, A. Zarrouk, B. Hammouti, R. Salghi, C. Jama and F. Bentiss, Corros. Sci. 64 (2012) 643
30. M.M. Fares, A.K. Maayta and M.M. Al-Qudah, Corros. Sci. 60 (2012) 112
31. M. Behpour, S.M. Ghoreishi, M. Khayatkashani and N. Soltani, Mater. Chem. Phys. 131 (2012) 621
32. A.K. Singh, S.K. Shukla, M. Singh and M.A. Quraishi, Mater. Chem. Phys. 129 (2011) 68 33. Z. Tao, W. He, S. Wang, S. Zhang and G. Zhou, Corros. Sci. 60 (2012) 205
34. S. Garai, P. Jaisankar, J.K. Singh and A. Elango, Corros. Sci. 60 (2012) 193 35. M.R. Singh, K. Bhrara and G. Singh, Port. Electrochim. Acta. 26 (2008) 479 36. S.A. Umoren, Y. Li and F.H. Wang, Corros. Sci. 52 (2010) 1777
37. J. Zhang, W.W. Song, D.L. Shi, L.W. Niu, C.J. Li and M. Du, Prog. Org. Coat. 75 (2012) 284 38. E.S. Meresht, T.S. Farahani and J. Neshati, Corros. Sci. 54 (2012) 36
39. S. Hong, W. Chen, H.Q. Luo and N.B. Li, Corros. Sci. 57 (2012) 270 40. N.O. Obi-Egbedi and I.B. Obot, Corros. Sci. 53 (2011) 263
41. S.T. Keera and M.A. Deyab, Colloids and Surfaces. 266 (2005) 129 42. E.E. Ebenso, Mater. Chem. Phys. 79 (2003) 58
43. A.K. Singh, S.K. Shukla, M. Singh and M.A. Quraishi, Mater. Chem. Phys. 129 (2011) 68 44. M. Kissi, M. Bouklah, B. Hammouti and M. Benkaddour, Appl. Surf. Sci. 252 (2006) 4190 45. E.E. Foad El-Sherbini, S.M. Abdel Wahaab and M. Deyab, Mater. Chem. Phys. 89 (2005) 183 46. X. Zhou, H. Yang and F. Wang, Electrochim. Acta. 56 (2011) 4268
47. X. Li, S. Deng and H. Fu, Prog. Org. Coat. 67 (2010) 420
48. F. Zhang, Y. Tang, Z. Cso, W. Jing, Z. Wu and Y. Chen, Corros. Sci. 61 (2012) 1 49. A.K. Singh and M.A. Quraishi, Corros. Sci. 53 (2011) 1288
50. A.K. Singh, S.K. Shukla, M.A. Quraishi and E.E. Ebenso, J. Taiwan Inst. Chem. E. 43 (2012) 463 51. W.H. Li, Q. He, S.T. Zhang, C.L. Pei and B.R. Hou, J. Appl. Electrochem. 38 (2008) 289
52. E. Bensajjay, S. Alehyen, M. El Achouri and S. Kertit, Anti-Corros. Meth. Mater. 50 (2003) 402 53. X. Li, S. Deng and H. Fu, Corros. Sci. 51 (2009) 1344