Rochester Institute of Technology
RIT Scholar Works
Theses
12-19-2018
An Adaptive Inventory Management System for
Hospital Supply Chain
Pradeep G. Pai
pgp3733@rit.edu
Follow this and additional works at:https://scholarworks.rit.edu/theses
This Thesis is brought to you for free and open access by RIT Scholar Works. It has been accepted for inclusion in Theses by an authorized administrator of RIT Scholar Works. For more information, please contactritscholarworks@rit.edu.
Recommended Citation
Rochester Institute of Technology
AN ADAPTIVE INVENTORY MANAGEMENT SYSTEM FOR HOSPITAL SUPPLY CHAIN
A Thesis
Submitted in partial fulfillment of the
requirements for the degree of
Master of Science in Industrial and Systems Engineering
in the
Department of Industrial & Systems Engineering Kate Gleason College of Engineering
by
Pradeep G. Pai
DEPARTMENT OF INDUSTRIAL AND SYSTEMS ENGINEERING
KATE GLEASON COLLEGE OF ENGINEERING
ROCHESTER INSTITUTE OF TECHNOLOGY
ROCHESTER, NEW YORK
CERTIFICATE OF APPROVAL
M.S. DEGREE THESIS
The M.S. Degree Thesis of Pradeep G. Pai
has been examined and approved by the
thesis committee as satisfactory for the
thesis requirement for the
Master of Science degree
Approved by:
____________________________________ Dr. Michael E. Kuhl, Thesis Advisor
i
ABSTRACT
In healthcare, delivering high quality care to the patients typically requires significant
investment in supply chain management systems. Inventory management is an important part of
any supply chain system. Researchers have indicated great potential for optimizing existing
healthcare inventory systems, especially within hospitals. With ever changing needs, product
prices and policies, managing inventory of products in hospitals becomes difficult. As time
progresses, the inventory policies of products become sub-optimal. In this research, we study
multiple echelons of a hospital supply chain considering the distributors, to address the need for
an efficient and effective hospital inventory management system. We propose a method consisting
of two components: (1) system design and optimization; and (2) system monitoring, evaluation,
and forecasting. The system design and optimization methodology includes a sim-heuristic
approach where optimization of inventory levels and hospital operations is considered. As time
evolves, to monitor the relevant system performance measures over time, control-chart like
methods are used. When significant deviations in system performance occur, a re-evaluation of the
inventory decision variables and/or system operations is conducted to maintain an efficient
inventory system. A hierarchical procedure is used to determine the extent of evaluation of the
i
Table of Contents
1. Introduction ... 1
1.1. Inventory Management Concept ... 5
2. Problem Statement ... 8
3. Literature Review ... 10
3.1. Simulation in Healthcare ... 12
4. Design and Methodology ... 15
4.1. Hospital Supply Chain System Description ... 15
4.2. Modeling Assumptions ... 17
4.3. Adaptive Supply Chain System Framework ... 18
4.3.1. System Design and Optimization... 18
4.3.2. System Monitoring, Evaluation and Forecasting ... 20
4.4. Formulation of Adaptive Hospital Supply Chain Management System ... 27
4.5. Experimentation Methodology ... 36
5. Simulation Implementation ... 38
6. Adaptive Supply Chain Example ... 44
7. Experimentation ... 56
7.1. Performance Metrics ... 56
7.2. Experimental Factors ... 57
7.2.1. Supply Chain Configuration ... 58
7.2.2. System Demand ... 58
7.2.3. Demand Deviation ... 59
7.2.4. Product Demand Pattern in Units ... 59
7.2.5. Tracking Parameters ... 60
7.2.6. Forecasting Parameters ... 60
7.2.7. Operational Decisions ... 61
7.3. Test for Detection and Analysis of Evaluation Points ... 62
7.3.1. Large Hospital System ... 62
7.3.2. Small Hospital System ... 79
7.4. Discussion ... 85
8. Conclusion and Future Work ... 87
9. Bibliography ... 89
ii
A.1. Large Hospital System with High Deviation and Increasing Demand ... 96
A.2. Large Hospital System with Low Deviation and Increasing Demand ... 106
A.3. Large Hospital System with High Deviation and Constant Demand... 108
1
1. Introduction
Healthcare expenditures in the United States reached $3.3 trillion in the year 2016, more than
ten times the $256 billion spent in 1980 (CMS, 2017). Various reports indicate that supply chain
costs in a hospital contribute between 25 – 40% of the total healthcare expenditures (Conway,
2011; McKone-Sweet, Hamilton, & Willis, 2005). Supply chain expenses in hospitals are large
and growing fast, which makes it a necessary cost to be monitored continuously and actively
managed (Conway, 2011). Studies suggest that optimizing demand management, inventory
management, and order management may facilitate significant supply chain cost savings in
hospitals (Chandra & Kachhal, 2004; Darling & Wise, 2010) . For the healthcare sector in general,
inventory accumulation and obsolescence of products are high, when compared to the industrial
sector (Ebel, Shah, Larsen, George, & Ungerman, 2013). Inventory accumulation and
obsolescence of products are partly the reasons for the high expenses of hospital supply chains.
Since the primary focus in any hospital is towards the delivery of patient care, streamlining
inventory of a diverse set of products is rarely prioritized. Hence while maintaining the quality of
care given to patients, exercising control over the purchase and monitoring inventory levels of
each product within a hospital can help in saving supply chain related costs. In this thesis, existing
inventory management systems in a hospital are analyzed, and a new systems approach is designed
and developed to deliver quality patient care in terms of inventory service level while attempting
to minimize system cost over time.
A typical healthcare supply chain consists of multiple suppliers, manufacturers, distributors, a
central storage location in the hospital, care units, and patients. The diagram in Figure 1 represents
an overview of a healthcare supply chain. Suppliers of raw materials are upstream and form the
first echelon. Manufacturers are the second and sell their products to distributors. Distributors
2
contracts or get purchase orders from hospitals where small inventories of products are stored for
use in multiple hospital units. Healthcare supply chain involves a continuous flow of information,
products, and capital between different stakeholders. Co-ordination between stakeholders is a
critical component in the supply chain, which enables delivery of quality patient care. Hence,
healthcare supply chain is a multi-echelon network, interconnected with different people and
organizations, working together to provide high-quality patient care.
Figure 1 Healthcare supply chain stakeholders
Figure 2 represents the system components of interest in this research including distributors,
hospital central storage, care units and patients. Depending upon factors such as patient volumes,
type of contract with distributors, delivery location and hospital size, a hospital may decide
3
of products is stored in a central storage location, independent demands of each hospital care units
for different products are fulfilled. A hospital is typically comprised of care units for patient
treatment. Units are often designed for grouping patients based on the types of treatment, the
severity of the treatment, type of diagnosis and safety. Each time a unit needs to replenish its
inventory of a product, central storage fills the need. Demand flows upstream, while the products
flow downstream and are ultimately administered to patients. The decision about placing an order
for a product in the unit is typically made based on established criteria or rules such as a re-order
point. This process repeats itself in each echelon of the supply chain.
Figure 2 System components of interest in this research with inventory decision flow
The hospital supply chain should also be one that meets the seven principles of the supply
chain by delivering “the right product for the right customer, in the right quantity and the right
condition, at the right place, at the right time, at the right cost” (Anderson, Britt, & Favre, 2007).
An efficient healthcare supply chain would be the one in which nearly all the patient demand for
products will be met on time without any delay, by maintaining minimum levels of inventory in
4
Efficiently managed inventory in hospitals would balance the ordering costs and holding costs.
The cost of ordering may include a fixed price for placing the order, wages of the clerical personnel
at the hospital, transportation costs, labor costs for inspection, labor cost for moving the products
to central storage once they have been received at the hospital and other costs that vary between
different distributors. The holding cost includes the opportunity cost (money tied up in inventory),
the cost for storage space (rent, utilities), inventory risk cost (insurance, obsolescence, theft) and
other miscellaneous costs that depend on the amount of inventory on hand. Service level in a
hospital is the proportion of demand met on time. If there is a stock out, then usually a penalty cost
is associated with the unmet demand. Penalty cost represents the cost of expedited freight. The
stochastic demands and variable delivery leadtimes for diverse set of products in healthcare makes
inventory management a complex task.
A hospital inventory system operates under the dynamic and stochastic setting of demand and
variable delivery leadtimes. Demand for products in the system depends on the number of patients,
their medical condition over the length of stay and the duration they get the necessary treatment.
The condition of each patient, patient mix in the system and their length of stay are highly
unpredictable and change with the passage of time. In addition to the variability in demands, the
delays in the delivery of products from distributor to central storage and from central storage to
the care units increases the risk of product unavailability. This would require expedited delivery
from the distributor, which incurs an additional cost. So generally, hospitals tend to carry higher
inventory levels of products to succeed in dealing with the demand stochasticity and avoid higher
system costs. Because of such inventory practices, there is a risk of products being wasted due to
5
1.1. Inventory Management Concept
The concept of Economic Order Quantity (EOQ) explains the quantity to order or produce
based on the annual demand, holding cost per unit and ordering cost per order placed (Harris,
1913). EOQ establishes the order quantities to minimize the total cost on the system by balancing
the holding and ordering costs. The EOQ serves the purpose of optimality in costs, without any
consideration on service level when demand rate and leadtime for delivery of items are constant.
However, system demands and delivery leadtimes of products vary around an expected value.
Figure 3 represents the ordering and replenishment cycles of a single product under varying
demand and delivery leadtime.
Figure 3 Inventory control model for a product with varying demand and leadtime at care unit
As shown in Figure 3, the inventory of the product depletes with respect to varying rate of
demand and leadtime. When the level of inventory reaches the reorder level (𝑟), an order (𝑄) is
placed to the distributor of the product upstream. The reorder level (𝑟) of the product is calculated
based on the expected demand for the product over the time required to deliver the products after
an order is placed. Order quantities (𝑄) are decided based on the demand, ordering costs and the
holding costs of the product, which minimizes the system costs. Deciding the re-order level and
6
complex task. The deviations in demand and delivery leadtime must be taken into consideration
before deciding the parameters.
The inventory of a product in a care unit depletes continuously each day as shown in Figure 3.
If the inventory level of the same product is monitored at the central storage, the inventory level
will remain constant over a period of time. On filling the orders received, the inventory level is
reduced by an amount equal to the quantity ordered by the units as shown in Figure 4. There are
situations when multiple care units order the same product at the same time giving rise to a lumpy
demand. The central storage might run out of product inventory when a lumpy demand occurs.
Figure 4 Inventory model for a product with varying demand and leadtime at central storage
Under stable operating conditions, the inventory expenditure for the system would remain at a
constant expected value; that is, an established method is used to design the inventory policies of
products in the system and if the conditions do not change over time, the average system cost
would remain the same with some variability as shown in Figure 5. However, as time evolves
factors like variations in demand, variations in leadtime, introduction of new products, inefficiency
in the inventory policies and operational decisions will render the hospital supply chain system
inefficient. The increase in costs are due to inefficiency where the operational decisions create an
7
Figure 5 A depiction of cost due to inefficiencies in the internal supply chain within a hospital
Research has shown that maintaining up to date inventory parameters helps to improve
performance of hospital supply chains (Landry & Philippe, 2004). Integration of different logistics
activities that are internal to the hospital, introduces new avenues of efficiencies and impacts the
quality of care offered. Hence, for maintaining an efficient system over time, monitoring and
tracking different key performance measures for products individually and holistically becomes
important. The metrics being monitored continuously may be used as a reference to make any
decisions by identifying root cause for the change. Forecasting the metrics being monitored
facilitates starting all the necessary activities that support the changes ahead of time.
In this section, an understanding of healthcare supply chain is developed. A discussion on how
an optimal ordering policy used across a set of products results in sub-optimal performance of the
system is provided. Furthermore, a concept for monitoring and evaluating the system is discussed
to maintain system performance and address the variations in the system with the passage of time.
In the sections to follow, an adaptive approach for hospital supply chain system is described that
makes use of a combination of forecasting and statistical process control chart like techniques to
monitor, evaluate and configure the inventory system continuously.
Syste
m
Cost
Time Cost under constant conditions
8
2. Problem Statement
As discussed in the introduction, supply chain optimization has a significant effect on the
performance and cost of operations in any industry. Supply chain optimization in hospital involves
analyzing the current system conditions when establishing an optimized inventory policy.
Variations in demand, delivery leadtimes and storage space availability are some of the system
conditions that are analyzed before establishing the inventory policies. However, the system
conditions are bound to change with time. This research investigates the variations in the
performance arising due to the system dynamics and their impact on supply chain optimization
decisions.
As time evolves, the policies planned for the supply chain system at one point in time do not
stay optimal, resulting in inefficiencies. Thus, the system requires re-evaluation. Evaluating the
system frequently results in high evaluation cost, while late evaluation will give rise to high
inefficiency costs. Hence, identifying the point in time for optimization plays a pivotal role in
keeping the costs down. Optimization of operations could include changes in the schedule of
personnel, hiring people to accommodate any additional requirements. Optimization of inventory
policies is a complex task. To optimize existing policies, variations in system parameters are
analyzed, what-if scenarios are examined and a plan for implementing changes in the storage area
are developed. At the same time, the policies need not necessarily be changed for the entire system,
since the sub-optimality might be limited to a group of products, a single location, or a group of
locations. Evaluating the supply chain policy for the entire system would incur a higher cost than
the evaluation of a product, or unit, or group of units. Thus, evaluating at the right point, to the
9
Through this research, we aim to determine points in time at which it would be advantageous
to evaluate the inventory policies and operational decisions of a hospital supply chain system and
identify the extent to which the evaluation should be made, to facilitate effective and efficient
supply chain system with respect to service level and system costs. The evaluation ensures that the
supply chain system remains near optimal over time and adapts to the variations as time progresses.
The primary objectives of this thesis can be summarized as follows:
1. Investigate techniques that have the capability to monitor and predict system metrics over time
for effective and efficient system management;
2. Design and develop monitoring system approach to identify and decide the extent of evaluation
required in a hospital supply chain system to maintain system efficiency;
3. Re-evaluate the inventory policies to the extent identified using established methods; and
4. Conduct a simulation-based experimental performance evaluation of the system evaluation and
prediction methods, to determine their capabilities and limitations.
This research work could lead to the following benefits in healthcare supply chain systems:
1. Maintain desired service levels associated with the delivery of patient care;
2. Maintain efficient levels of inventory;
3. Efficiently adapt to changes in supply chain including changes to demand, product costs,
inventory ordering and carrying costs and changes in leadtimes;
4. Utilize system tracking to identify assignable causes of changes in system performance and
take corrective action as needed; and
5. Reduce the overall cost of inventory and supply chain operations versus the traditional
10
3. Literature Review
De Vries et al. (2011) and Varghese et al. (2012) realize the potential to save money in
healthcare supply chain and conclude that much needs to be accomplished with respect to
developing an efficient system. Studies performed on inventory management in hospitals have
been limited (Volland, Fügener, Schoenfelder, & Brunner, 2017) and hence less is known about
what is precisely being followed in practice. Existing literature has focused more on establishing
optimal inventory policies based on the system conditions at a given point in time. Dynamics of
the hospital is such that the system conditions change over time and the established inventory
policies require re-evaluation after a certain period of time.
Lapierre & Ruiz (2007) present an innovative approach to solve multi-item inventory
replenishment problem in a hospital. The model emphasizes on scheduling decisions for inventory
purchase and operations, instead of focusing on inventory decisions. Their approach uses a tabu
search meta-heuristic to solve a non-linear mixed-integer problem. However, the demand for
products in the system is assumed to be deterministic and known.
Bijvank and Vis (2012), develop two inventory models that consider the lost sales and limited
storage capacity in a hospital. The (𝑅, 𝑠, 𝑄) policy is a fixed order quantity that provides a more
insightful process for replenishment of products in which an order of quantity 𝑄 is placed when
the inventory falls below re-order level s during a periodic review after R time periods. However,
the (𝑅, 𝑠, 𝑆) policy results in the more efficient use of the storage capacity in which an order placed
does not exceed the maximum inventory level S when the level of products falls below re-order
level s during a periodic review after R time periods. According to the authors, both the inventory
models are quite common in hospitals and perform equally regarding required service levels to be
maintained. The scope of the research is limited to establishing the policies at point of use location
11
research. The parameters of the both the models would require a re-evaluation when the system
conditions have changed enough that the performance is not optimal.
The majority of the literature available on inventory theory cannot be used in a hospital setting,
since they are backorder models. A study suggests that the dynamics of hospital supply chain
systems are similar to the functioning of fast-moving consumer goods (FMCG) industries (Ebel et
al., 2013). The setup of hospital inventory systems is similar to spare part inventories for
production in industrial plants (Danas, Roudsari, & Ketikidis, 2006).
An iterative heuristic optimization algorithm capable of generating the inventory policy of
4000 items in a system for each echelon was developed by Al-Rifai and Rossetti (2007). The
algorithm is efficient in cases where the leadtimes are fixed and demands are backordered.
However, in a hospital setting, only lost sales model is applicable for items at the point of use and
leadtime vary for product delivery. Karaman et al. (2009) developed an optimization model for
setting up inventory control policies at each stage of a multi-echelon system, based on the system
performance metrics like backorder levels, service levels, and average inventory level. The reorder
levels and the replenishment batch sizes for each echelon were set up for smooth material flow.
This research looks at using similar performance metrics for different system levels in the
monitoring approach for making re-evaluation decisions to maintain system efficiency.
Guerrero et al. (2013) developed an approach to determine near-optimal inventory policies in
a multi-echelon supply chain network. The approach aims to minimize the total on-hand inventory
for the entire system. The order-up-to level is higher than the reorder point while reorder points
are derived using a probability criterion. Rosales(2011), Baboli et al. (2011), Tsai et al. (2013) and
Wang et al. (2013) have also explored a heuristic approach for solving the inventory problems in
12
Krajčovič & Plinta (2014) derived an algorithm for dynamic inventory control system
approach for the manufacturing sector to maintain an optimum inventory level based on a required
service level to keep the costs down. Based on the simulation of the future progress supply chain
requirements like reorder points, order quantities and control parameters were calculated and
reviewed continuously to maintain an optimal ratio between the value of inventory and level of
service to be provided.
3.1. Simulation in Healthcare
Simulation is a flexible tool that can be used to study the system operations and inventory
trends of multiple products under stochastic system conditions. A risk free and cost-effective tool
for system analysis, simulation requires a conceptual design of the real system to be developed.
Experiments may be run to draw conclusions based on the analysis and results. The model
developed is verified and validated before running the experiments.
Sezen (2006) applies simulation to investigate the system service level for an order-up-to
policy. The length of the review period is varied to study the changes in the service level. However,
the only provides some insights on the inventory policy and fails to propose any solution
methodology to find optimal order-up-to levels.
Kelle et al. (2012) used a simulation approach to reduce inventory expenditures for
pharmaceuticals. They were able to make a trade-off between the emergency shipments and
required service levels, to reduce the inventory cost. Gebicki et al. (2014) conducted a simulation
study that concluded making inventory decisions based on service levels, demand and cost
produced for better outcomes regarding both cost and patient safety. The author concludes that
incorporating product attributes like unit cost, criticality and availability at distributor in ordering
13
The research uses a par-level inventory system with (𝑅, 𝑆) policy but does not address when is it
appropriate to update the parameters as the conditions change.
Duan & Liao (2013), propose a metaheuristic simulation-optimization framework for highly
perishable products. They focused on reducing the product expiry rate under a maximum allowable
shortage level. The policy proposed was easy to implement with less information about inventory
age in both the centralized and decentralized type of controls for distribution. A simulation model
study to minimize inventory costs by balancing stock outs cost of different inventory levels and
the borrowing and holding costs of the medical products was conducted by Attanayake et al.
(2014). The model revealed inventory policies that would lead to low cost but did not take into
consideration the service level for the point of use of the products. Realistic operational scenarios
such as multi-echelon systems, diverse products, and multiple units within the hospital facility
were not included.
Garg and Kuhl (2017) propose a sim-heuristic approach to design an efficient multi-echelon
supply chain system to deliver products from distributor to patients at the care units. The method
uses stochastic demand and leadtimes information for products as inputs. The approach analyses
the tradeoffs between total cost and service level at the care units taking the system operations into
consideration. This research is an extension of the work by Garg and Kuhl (2017) where a dynamic
system is considered along with daily hospital operations to meet the demands over a time horizon.
Studies have shown that optimizing logistics activities that are internal to the hospital can
generate more savings and positively influence the quality of care provided (Landry & Beaulieu,
2013). Most of the approaches to the problem do describe the complex joint replenishment
problems of multiple products in a hospital but fail in determining a point in time for reviewing
the inventory policies and operational decisions. Modifying the existing mathematical models of
14
inventory optimization methods would go a long way in reducing the supply chain costs in
hospitals. Furthermore, the extent of optimization required to maintain system performance could
15
4. Design and Methodology
In this section, system description, modeling assumptions and research methodology being
implemented are presented. System description discusses the daily operations and sequence of
activities that takes place in a prototypical hospital. Close coordination between the echelons is
necessary for effective ordering and distribution of products. A synchronized approach is
developed that considers the sequence of activities for distribution of products from distributor to
care units in a hospital. The approach is used to design a simulation model under certain
assumptions.
An adaptive supply chain methodology is designed to accomplish the goal of identifying points
in time to optimize the inventory policies and operational decisions up to a required extent. The
method is used to implement a system with optimal inventory policies and monitor key
performance metrics over time to detect significant deviations and evaluate the system to a required
extent. The research methodology is built into the hospital simulation model to make integrated
inventory and operations decisions. Finally, an experimental performance evaluation of the method
is conducted to determine its capabilities and limitations.
4.1. Hospital Supply Chain System Description
The area of interest of the healthcare supply chain in this research is comprised of three
echelons, namely: the distributors, the central storage, all the individual hospital care units, and
the point-of-use (refer to Figure 2). The methodology is developed based on the design of the
hospital supply chains. Flow of diverse set of products from distributor up to the patients, order
quantities and reorder levels at distinct storage locations and all the operational aspects in the
hospital are considered in the design. A periodic inventory review policy is assumed as discussed
16
considered without any loss of generality to study the performance of the adaptive method being
developed.
Supply chain operations in a hospital include inventory activities including placing orders for
product, receiving the orders, replenishing the product stock and reconciling the inventory. The
sequence of activities facilitates the coordination of multiple echelons as shown in Figure 6.
Besides the task of administering the needs of patients, nurses / workers in the hospital units
also reconcile and order products from the central storage. The inventory of products in a hospital
unit is reviewed after fixed intervals of time as set by the hospital management. If the number of
products in stock is less than the re-ordering level (𝑟𝑢), an order (𝑄𝑢) is placed to the central
storage.
Upon receipt of order from unit, if the central storage has enough inventory to satisfy the order
quantity from unit, the order is fulfilled and a worker from the unit picks the product. After
Place orders to
distributors
Review
inventory
level at units
Fulfill orders
from the unit
Fulfill daily
demands
at unit
Replenish
inventory at
care units
Review
inventory level
at central
storage
Place orders
to central
storage
17
fulfilling the order, the central storage reviews the level of inventory. If the number of products in
stock is less than the re-ordering level (𝑟𝑐𝑠) for the central storage, an order (𝑄𝑐𝑠) is placed to the
distributor. The worker in the unit refills the shelves in the unit once the product is received from
the central storage.
4.2.Modeling Assumptions
Before discussing the system modelling approach in detail, various assumptions that are
considered as a part of this research are presented. The framework developed for a hospital supply
chain system is based on the following assumptions:
1. The hospital supply chain system has a central storage, which is responsible for ordering
products to a distributor and fulfilling demands from units.
2. The hospital system consists of multiple products distributed across the units with a long
shelf life (at least one year).
3. The product demands and leadtime for delivery of products is stochastic and is assumed to
be independent of each other.
4. The distributor has abundant supply of products and hence satisfies all the orders received
for hospital central storage without backorder.
5. Daily demand for products in hospital units are assumed to be normally distributed.
6. All the activities related to inventory reconciliation, ordering and replenishment occur in
coordinated sequence as discussed in section 4.1.
7. Situations like disasters or accidents in nearby locations which might result in a sudden
rise in demands of products is not a feature of the framework.
The design of the system configuration that will be developed in the sections to follow
18
4.3. Adaptive Supply Chain System Framework
To achieve the objectives of this research, an adaptive supply chain framework is designed.
The framework consists of two modules: (1) system design and optimization; and (2) system
monitoring, forecasting, and evaluation. A representation of the method with a feedback loop is as
shown in Figure 7.
The system design and optimization component uses a sim-heuristic approach as discussed
in Garg & Kuhl (2017) to optimize decision variables related to inventory policies and operations
based on the current system information. To maintain the efficiency of the system over time,
system performance metrics such as service level and cost at multiple levels are monitored through
the system monitoring module. When the performance metrics show significant deviations from
optimal values, system decision variables (order quantities, reorder points, etc.) and/or system
operations are re-evaluated to restore the efficiency of the system.
4.3.1. System Design and Optimization
The system design and optimization module perform two functions: (1) implement an optimal
system for a given design configuration; and (2) make integrated optimization decisions of
inventory policies considering the supply chain operations in the hospital.
The evaluation of inventory and operational decision variables under dynamic system
19
heuristic approach is used to optimize all decision variables simultaneously. In this approach,
established inventory methods are applied to derive inventory policies. The policies thus generated
are deployed as inputs to the synchronized hospital simulation model. The simulation model
evaluates the dynamic behavior of the supply chain system and provides feedback with information
of effective system parameters. The information from the feedback is then used to develop optimal
system design for a given system configuration. After analyzing the trade-offs between the service
level and cost for alternative system configurations, an optimal solution is implemented (refer to
yellow box in Figure 8).
Figure 8 Applicability of the adaptive supply chain framework in a hospital
The operations of the system use the information from the sim-heuristic optimization module
to function. The optimal design is employed in operations and inventory policies of the products.
As the system functions over time, the inventory policies set up through the sim-heuristic module
becomes sub-optimal due to inefficiencies in the inventory policies for the system parameters at
that point of time. The system thus requires re-evaluation -i.e., optimization of inventory policies.
20
parameters (refer to blue box in Figure 8). The sim-heuristic optimization module will be used
iteratively to maintain the system at a near optimal condition over time.
4.3.2. System Monitoring, Evaluation and Forecasting
The system monitoring, evaluation and forecasting module is used to track the key system
performance measures over a user defined performance review period (daily, weekly, monthly,
etc.). The monitoring system determines the point at which the system has diverged significantly
from the optimal configuration through control – chart type methods (tracking charts) to make
necessary adjustments in the system for restoring the efficiency. On identifying a re-evaluation
point, the evaluation module establishes the extent of optimization required; i.e. inventory policies
at three levels: the system, the location and the product. A representation of system monitoring,
evaluation and forecasting module is as shown in Figure 9.
Figure 9 A representation of system monitoring, evaluation and forecasting
Performance measures are monitored at each of the three levels simultaneously to maintain the
system efficiency. Threshold limits set on the tracking charts with respect to level of change that
21
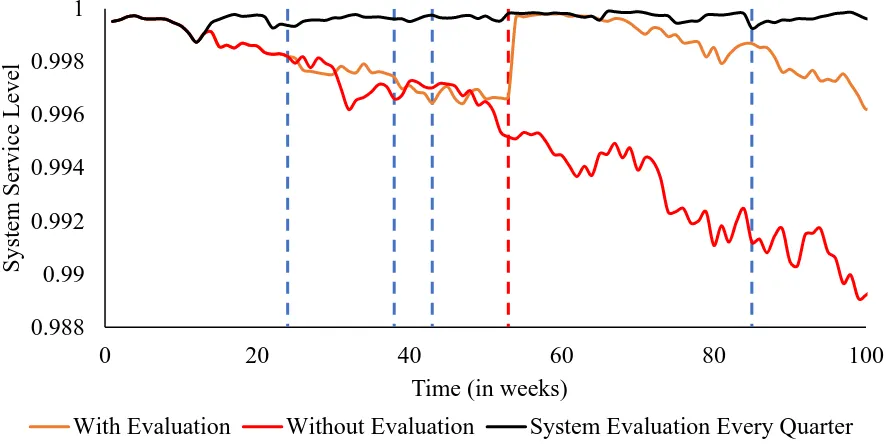
As the system functions, there will be changes to performance measures at various levels of
the system. There will be changes that are external to the control of system due to changes in
product prices, transportation costs, etc. There are changes that are due to sub-standard inventory
policies with respect to the current conditions. When any performance measure exceeds the
threshold limits, a feedback is sent to the system optimization module (refer to blue box in Figure
8) to re-evaluate the system to a desired extent. A hierarchical approach is adopted to determine
the extent of re-evaluation required for each performance review period as shown in Figure 10.
The system level performance metrics are evaluated at the top level. If the system performance
metric exceeds the threshold limit, then the decision variables for the entire system are optimized.
If the system performance metrics are within the limits, then the location level performance metrics
are evaluated. At location level performance metrics for central storage and hospital care units are
considered. If a location level performance metric exceeds the threshold limits, then the
optimization is carried out only for that location. Otherwise, the product level metrics are evaluated
for optimization of the product. This helps in saving time, money and effort, as the hierarchy of
evaluation reduces the scope of optimization, analysis required and hence reduces the complexity
of the decisions to that are required to be made. If the performance measures of all the three levels
are in control, then a forecast of the metric is provided to predict the evaluation points.
To summarize, the adaptive supply chain system framework establishes an optimal hospital
supply chain using a sim-heuristic approach and monitors and evaluates key performance
indicators such as service level and cost over time. On detecting an evaluation point, the
sim-heuristic is iteratively employed to optimize the hospital supply chain at the required level. The
module also provides forecast of expected evaluation points to provide a sense of when the
22
Figure 10 Hierarchy of evaluation
4.3.2.1. Tracking Charts using Control Chart Methods
A control chart like method is employed to monitor (refer to Figure 8) performance metrics
such as service level and cost at various levels of the hospital system. For instance, if we were to
plot actual values of the cost monitored at the system level, it would exhibit high variability from
its mean value as shown in Figure 11. Making an evaluation decision based on an actual cost value
is not a good approach as the system might still be in an optimal state. The system evaluation will
23
Figure 11 A plot of actual cost values at the system level
A sound approach would be to make decisions based on the average or smoothed values of the
actual cost. On smoothing the raw cost values, the variability of the data around the mean would
be reduced as shown in Figure 12. The concept of exponentially weighted moving average
(EWMA) is employed in smoothing the raw values of the cost obtained from system monitoring.
Figure 12 A plot of smoothed cost values at the system level
Exponentially weighted moving average control chart (EWMA) was developed by Allison
Jones (2002). EWMA chart detects small shifts in the variable effectively. For every period,
EWMA statistic (𝑆𝑡) averages the actual data (𝑋𝑡) by adding up the weighed values for the current
24
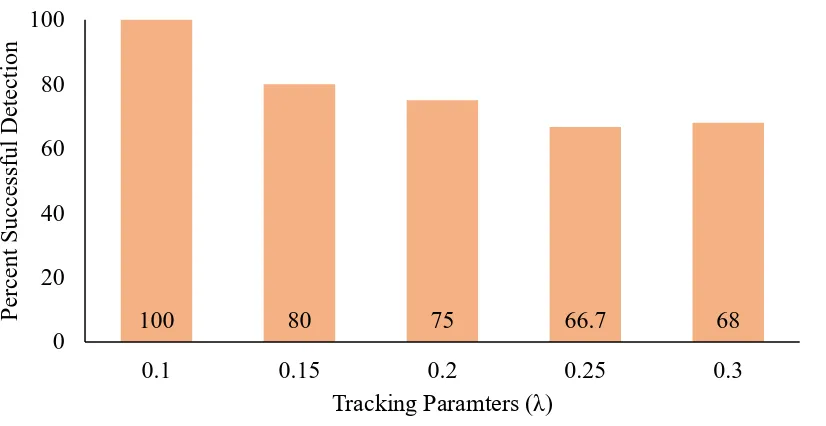
highly variable values from raw data. The value of the smoothing constant can be varied between
0 and 1. EWMA statistic would be the actual observation, when the value of smoothing constant
is set to 1. As discussed in the literature, smoothing constant values between 0.1 and 0.4 perform
well in practice (Montgomery, Jennings, & Kulahci, 2015). In this research, a tracking parameter
(𝜆) is used to calculate tracking statistic (𝑆𝑡) using the equation:
𝑆𝑡 = 𝜆𝑋𝑡+ (1 − 𝜆)𝑆𝑡−1. (1)
The performance metrics (service level and cost) at different levels of system for each
performance review period is used to determine their tracking statistic values. Tracking chart is
used to monitor the statistic determined. Tracking charts for multiple levels of the system are
combined to develop a monitoring and evaluation system.
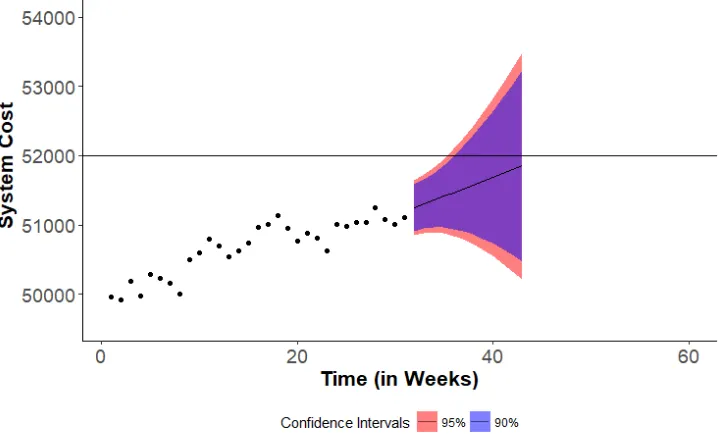
4.3.2.2. Forecasting
The optimization process of operations and inventory decision variables is a time-consuming
task. Current system conditions must be analyzed, and new parameters are to be used in
determining optimal decision variables. To accommodate the time required for analysis of decision
variables, it would be beneficial if we have an idea of when the next evaluation point is expected.
The forecasting module in the adaptive framework facilitates in planning the analysis part of the
optimization process ahead of time.
A simple forecasting module is built into the research methodology to forecast the evaluation
points of the system. The level (𝑙𝑡) and trend (𝑏𝑡) component of the cost statistic is used to predict
the estimates using forecasting method developed by Holt in (1957) (see also Holt 2004). Holt’s
linear trend forecasting method is an extension of simple exponential smoothing that considers the
trend and level component of historical values. The forecasting method involves determining level
and trend corresponding to the actual values. The level and trend parameters are then used to
25
𝑋̂𝑡+ℎ = 𝑙𝑡 ± ℎ𝑏𝑡 (2)
The level and trend parameters are calculated as follows:
𝑙𝑡 = 𝛼𝑋𝑡+ (1 − 𝛼)(𝑙𝑡−1+ 𝑏𝑡−1) (3)
𝑏𝑡 = 𝛽(𝑙𝑡− 𝑙𝑡−1) + (1 − 𝛽)𝑏𝑡−1 (4)
where,
α is the smoothing parameter for the level, such that 0 ≤ 𝛼 ≤ 1; and
β is the smoothing component for the trend, such that 0 ≤ 𝛽 ≤ 1.
The accuracy of the forecast generated is very important to identify the evaluation points. We
may calculate the accuracy of the forecast only after realizing the actual future values (𝐴𝑡) and
comparing them with the predicted values (𝐹𝑡) of all the fitted points (𝑛) of the data. The
performance of a forecasting method is measured using Mean Absolute Prediction Error (MAPE).
The formula for MAPE is:
𝑀𝐴𝑃𝐸 =
1𝑛
∑
(|
𝐴𝑡−𝐹𝑡𝐴𝑡
|)
𝑛𝑡=1
∗ 100.
(5)MAPE is also used in establishing optimal smoothing parameters for level and trend
component. The smoothing parameters for which the MAPE on the historical cost statistic is
minimum is selected to generate the forecast. The point at which the predicted values exceed the
threshold is deemed the forecasted evaluation point.
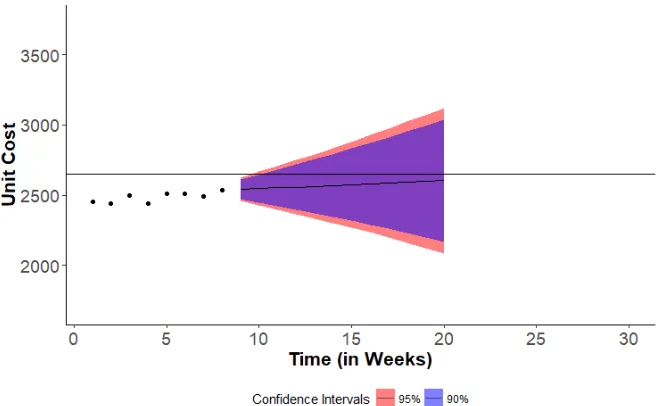
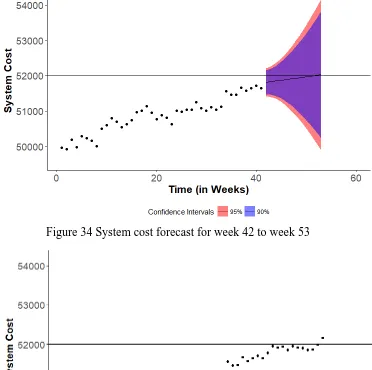
The accuracy of the forecast depends on the cost statistic values and their variations. Estimating
the prediction intervals of the forecast provides a range of the possible values that is going to be
observed. The prediction interval explains the amount of uncertainty present in the forecast and
26
policies. A wide prediction interval suggests that the variation in the historical data is high and
hence, the uncertainty must be considered for the forecast. The prediction intervals for the forecast
are determined using the formula (Hyndman & Athanasopoulos, 2018):
𝑋̂𝑡+ℎ ± 𝑍𝛼𝜎̂ℎ (6)
where,
𝑋̂𝑡+ℎ is the forecast for the period 𝑡 + ℎ;
𝑍𝛼 is the Z-score for the desired level of prediction interval; and
𝜎̂ℎ is the standard deviation estimate of the forecast value.
The adaptive supply chain system framework brings the evaluation heuristics, tracking charts
and forecasting module under one umbrella to make integrated decisions on inventory policies and
ensure system efficiency in a hospital. While the evaluation heuristic identifies the extent of
evaluation, optimization module is employed to update the decision variables through a
sim-heuristic approach. The forecasting module provides predictions as to when an evaluation point
27
4.4. Formulation of Adaptive Hospital Supply Chain Management System
In this section, a detailed discussion of all the inventory operations and re-evaluation of the
inventory policies are provided in a sequential manner. The inventory control parameters (𝑄, 𝑟)
are derived from established inventory methods (Nahmias & Olsen, 2015) for every product at
care units. Demand distribution, delivery leadtimes and various supply chain costs such as holding
costs and ordering costs of each product for the central storage and each hospital unit are the system
parameters used as inputs. For a product in any unit with demand being normally distributed with
a mean of 𝜇 and standard deviation 𝜎, with the leadtime normally distributed with a mean of 𝜇𝑡
and standard deviation 𝜎𝑡, the reorder level 𝑟 is given by:
𝑟 = 𝜇𝜇𝑡+ 𝑍𝛼√𝜇𝑡𝜎2+ 𝜇2𝜎𝑡2 (7)
where 𝑍𝛼 is the Z-score for the desired level of safety against the variations in demand.
The safety stock is given by:
𝑆𝑆 = 𝑍𝛼√𝜇𝑡𝜎2+ 𝜇2𝜎𝑡2 . (8)
A product usually incurs holding cost (ℎ), ordering cost (𝐾) and a penalty cost (𝑝) when the product
is unavailable. If 𝑛(𝑠) is the expected number of product shortages in a cycle, then order quantity
(𝑄)is given by:
𝑄 = √(2𝜇[𝐾 + 𝑝𝑛(𝑠)] ℎ⁄ ). (9)
If a product in central storage is present in n units, then the demand (𝜇𝑐𝑠) is the aggregated sum of
product demands across all the units.
𝜇𝑐𝑠 = 𝜇1+ 𝜇2… + 𝜇𝑛. (10)
For the standard deviation in demand (𝜎𝑐𝑠), the half width (𝑑) of the mean demand is derived from
the initial simulation runs and calculated as:
28
where 𝑡𝛼/2 is value from student’s t-distribution for a given level of significance 𝛼.
The design and optimization module is used to analyze trade-offs between key performance
indicators like system service level and system costs incurred under optimal (𝑄, 𝑟) parameters
integrated with operations decisions for each product. Table 1 discusses the notation used.
Table 1 Notation used in the algorithm and description
Sets
𝑃 𝐿 𝑇 𝑅
set of products 𝑝 ϵ [1,2…P]
set of locations 𝑙 ϵ [0,1, 2…L] where 𝑙 = 0 denotes CS and 𝑙 > 0 denotes unit
set of time periods 𝑡 ϵ [1, 2…T]
set of performance review periods, 𝑟 ϵ [1, 2…R]
Parameters 𝑦 𝑘𝑝𝑙 ℎ𝑝𝑙 𝑑𝑝𝑙𝑡 𝜔𝑝𝑙 𝐼𝑝𝑙0
Duration of each performance review period Ordering cost of product 𝑝 at location 𝑙
Holding cost of product 𝑝 at location 𝑙
Demand for product 𝑝 at location 𝑙 in time 𝑡
Emergency stock for product 𝑝 at location 𝑙
Initial inventory of product 𝑝 at location 𝑙
Decision Variables
𝑄𝑝𝑙𝑡
𝑟𝑝𝑙𝑡
Order quantity of product 𝑝 at location 𝑙 in time 𝑡
Reorder level of product 𝑝 at location 𝑙 in time 𝑡
Variables
𝐼𝑝𝑙𝑡
𝑄𝑝𝑙𝑡∗ 𝐸𝑝𝑙𝑡
𝐷𝑝𝑙𝑡 𝐷𝑝𝑙𝑡∗
𝐶𝑝𝑙𝑡
Inventory of product 𝑝 at location 𝑙 in time 𝑡
Amount of product 𝑝 on order at location 𝑙 in time 𝑡
Emergency stock for product 𝑝 used at location 𝑙 in period 𝑡
Demand met by product 𝑝 at location 𝑙 ϵ L: 𝑙 > 0 in period 𝑡
Demand not met by product 𝑝 at location 𝑙 ϵ L: 𝑙 > 0 in period 𝑡
Inventory costs for product 𝑝 at location 𝑙 in period 𝑡
Operations in any unit includes meeting the product demand (𝐷𝑝𝑙𝑡), auditing inventory
position (𝐼𝑝𝑙𝑡+ 𝑄𝑝𝑙𝑡∗ ) of each product and placing replenishment orders to central storage after fixed
intervals of time (b). A unit places a replenishment request equal to the order quantity of the
29
Algorithm 1. Algorithm for ordering and monitoring costs in a hospital care unit
Event 1: for each location 𝑙 𝜖 𝐿
for each product 𝑝 𝜖 𝑃 at location 𝑙
Initialize 𝐼𝑝𝑙0, 𝑄𝑝𝑙0, 𝑟𝑝𝑙0
Set 𝑄𝑝𝑙𝑡∗ = 𝑄𝑝𝑙𝑡−1∗ − 𝑄𝑝𝑙𝑡, 𝐶𝑝𝑙𝑡 = 0
end for end for
while the time 𝑡 for the next event is less than the end time for planning horizon do
Event 2: Check inventory position for each product at each location
for each location 𝑙 𝜖 𝐿: 𝑙 > 0
for each product 𝑝𝜖 P at location 𝑙 if 𝐼𝑝𝑙𝑡+ 𝑄𝑝𝑙𝑡∗ ≤ 𝑟𝑝𝑙𝑡 then
𝑄𝑝𝑙𝑡∗ = 𝑄𝑝𝑙𝑡−1∗ + 𝑄𝑝𝑙𝑡
𝐶𝑝𝑙𝑡 = 𝐶𝑝𝑙𝑡−1+ 𝑘𝑝𝑙
end if end for end for
𝐶𝑝𝑙𝑡 = 𝐶𝑝𝑙𝑡−1+ ℎ𝑝𝑙
set the time for next event to 𝑡 + 𝑏
end while
Each replenishment request being placed to central storage incurs ordering cost (𝑘𝑝𝑙) on
the unit. Holding product inventory in units incurs a holding cost per unit (ℎ𝑝𝑙). Ordering costs
and holding costs are recorded and accumulated over each performance review period as discussed
in Algorithm 1.
In each period, total demands (𝑑𝑝𝑙𝑡), demands met (𝐷𝑝𝑙𝑡) and emergency stock used (𝐸𝑝𝑙𝑡)
are recorded at each care unit for each product as discussed in Algorithm 2. The demands met, and
total demands information is used to calculate the service level metric in algorithm 4.
30
Algorithm 2. Algorithm for updating inventory and filling patient demands in a hospital care unit
Event 2: for each location 𝑙 𝜖 𝐿: 𝑙 > 0
for each product 𝑝 𝜖 𝑃 at location 𝑙 𝐼𝑝𝑙𝑡 = 𝑀𝑎𝑥(𝐼𝑝𝑙𝑡− 𝑑𝑝𝑙𝑡, 0)
𝐷𝑝𝑙𝑡 = 𝑀𝑖𝑛(𝐼𝑝𝑙𝑡−1, 𝑑𝑝𝑙𝑡)
𝐷𝑝𝑙𝑡∗ = 𝑀𝑎𝑥(𝑑𝑝𝑙𝑡 − 𝐼𝑝𝑙𝑡−1, 0)
if𝐷𝑝𝑙𝑡∗ > 0then
𝐸𝑝𝑙𝑡 = 𝑀𝑎𝑥(0, 𝜔𝑝𝑙𝑡+ 𝐼𝑝𝑙𝑡− 𝑑𝑝𝑙𝑡)
end if end for
end for
The cumulative inventory costs are recorded over each performance review period, before
being reset in the evaluation algorithm. On receiving the products sent from central storage, the
inventory on hand is updated by
𝐼𝑝𝑙𝑡 = 𝐼𝑝𝑙𝑡−1+ 𝑄𝑝𝑙𝑡−1∗ ∀ 𝑡 𝜖 𝑇, 𝑝 𝜖𝑃, 𝑙 𝜖 𝐿: 𝑙 > 0. (12)
Simultaneously, the products on order is reset to facilitate the inventory review processes
in the following time periods by
𝑄𝑝𝑙𝑡∗ = 𝑄𝑝𝑙𝑡−1∗ − 𝑄𝑝𝑙𝑡 ∀ 𝑡 𝜖 𝑇, 𝑝 𝜖𝑃, 𝑙 𝜖 𝐿: 𝑙 > 0. (13)
At central storage, the replenishment request for products from multiple units are fulfilled in
the order being received. The level of inventory on hand for a product is updated several times if
multiple units place replenishment request. Based on the amount of inventory available (𝐼𝑝0𝑡) and
the quantity of replenishment request, the central storage decides the number of products to be sent
to units. If the inventory (𝐼𝑝0𝑡) is not sufficient to satisfy the order quantity in replenishment request
31
fulfilled completely or partially, the inventory review at central storage ensures that an order for
products (𝑄𝑝0𝑡∗ ) is placed to the distributor.
Like the case of units, each replenishment order placed to distributor incurs ordering cost (𝑘𝑝0)
on the central storage. The order quantity to the distributor is determined based on the average
replenishment request from the units and their deviations. Holding product inventory in central
storage incurs a holding cost per unit (ℎ𝑝0). Ordering costs of the replenishment requests and
holding costs are recorded and accumulated over each performance review period, for facilitating
evaluation processes as discussed in Algorithm 3.
Algorithm 3. Algorithm for order filling and product ordering process in hospital central storage
Event 1: Receive order information from each unit
Event 2: for each product 𝑝 𝜖 𝑃
for each location 𝑙 𝜖 𝐿 with product 𝑝 𝑄𝑝𝑙𝑡∗ = 𝑀𝑖𝑛(𝐼𝑝0𝑡, 𝑄𝑝𝑙𝑡∗ )
𝐼𝑝0𝑡 = 𝐼𝑝0𝑡−1− 𝑄𝑝𝑙𝑡∗
end for end for
Event 3: Check inventory position for each product at central storage
for each product 𝑝 𝜖 𝑃
if 𝐼𝑝0𝑡+ 𝑄𝑝0𝑡∗ ≤ 𝑟𝑝0𝑡then 𝑄𝑝0𝑡∗ = 𝑄𝑝0𝑡−1∗ + 𝑄𝑝0𝑡
𝐶𝑝0𝑡 = 𝐶𝑝0𝑡−1+ 𝑘𝑝0
end if end for
32
After the products from distributors arrive at central storage, the workers at central storage
place the products in racks. The inventory level (𝐼𝑝0𝑡) of the product is updated and the number of
products on order (𝑄𝑝0𝑡∗ ) are reset to zero, such that
𝐼𝑝𝑙𝑡 = 𝐼𝑝𝑙𝑡−1+ 𝑄𝑝𝑙𝑡∗ ∀ 𝑡 𝜖 𝑇, 𝑝 𝜖𝑃, 𝑙 = 0. (14)
At unit level, an additional quantity of inventory called emergency stock is held to prevent
situations of unmet demand, which is not admissible in a hospital. At units, emergency stock is
setup to meet the demands that would have not been met, had there been a delay in processing due
to operations or the inventory policy was not efficient at that point of time. The emergency stock
(𝜔𝑝𝑙𝑡) for any product at any location is given by
𝜔𝑝𝑙𝑡 = 𝑀𝑎𝑥(𝐷𝑝𝑙𝑡∗ ) ∀ 𝑡 𝜖 𝑇, 𝑝 𝜖 𝑃, 𝑙 𝜖 𝐿: 𝑙 > 0. (15)
The cumulative values of inventory costs, demands met over a performance review period
of pre-determined duration (𝑦) are used to arrive at performance measures at different levels of the
system. The system service level is defined as the ratio of total demands met to total products
demanded at the point-of-use (patients). For each performance review period, the system service
level is calculated by
𝛼𝑟𝑠𝑦𝑠 = ∑ ∑ ∑𝐷𝑝𝑙𝑡 𝑑𝑝𝑙𝑡
𝑃
𝑝=1
∀ 𝑟 𝜖 𝑅.
𝐿
𝑙=1 𝑟𝑦
𝑡=(𝑟−1)𝑦
(16)
The location service level for the units is defined as the ratio of total demands met to total
products demanded in that unit. The service level for units over each review period is given by,
𝛼𝑟𝑙 = ∑ ∑
𝐷𝑝𝑙𝑡
𝑑𝑝𝑙𝑡
∀ 𝑙 𝜖 𝐿: 𝑙 > 0, 𝑟 𝜖 𝑅
33
The service level for the product at unit level is defined as the ratio of demands met to total
quantity of product demanded in the unit. The service level might be affected due to the
inefficiency in the inventory policy at the unit-product level. Hence, when evaluating the product
level inventory policy, it also becomes necessary to evaluate the policy of the product in the central
storage. The service level for products is given by
𝛼𝑟𝑝 = ∑ 𝐷𝑝𝑙𝑡 𝑑𝑝𝑙𝑡 𝑟
𝑡=(𝑟−1)𝑦
∀ 𝑙 𝜖 𝐿: 𝑙 > 0, ∀ 𝑝 𝜖 𝑃, 𝑟 𝜖 𝑅. (18)
Similarly, the cumulative inventory costs at all the levels are summed up to arrive at the
total cost over a given performance review period, such that
𝑇𝐶𝑟𝑠𝑦𝑠= ∑ ∑ ∑ 𝐶𝑝𝑙𝑡
𝑃
𝑝=1 𝐿
𝑙=0 𝑟𝑦
𝑡=(𝑟−1)𝑦
∀ 𝑟 𝜖 𝑅. (19)
Exponentially smoothed values of the total cost and service level are calculated using
smoothing factor for cost (𝜆𝑐𝑠𝑦𝑠) and smoothing factor for service level (𝜆𝑠𝑙𝑠𝑦𝑠) as given below:
𝛿𝑟𝑠𝑦𝑠 = 𝜆𝑠𝑙𝑠𝑦𝑠𝛼𝑟𝑠𝑦𝑠+ (1 − 𝜆𝑠𝑙𝑠𝑦𝑠)𝛿𝑟−1𝑠𝑦𝑠 (20)
𝜁𝑟𝑠𝑦𝑠= 𝜆𝑐𝑠𝑦𝑠𝑇𝐶𝑟𝑠𝑦𝑠+ (1 − 𝜆𝑐𝑠𝑦𝑠)𝜁𝑟−1𝑠𝑦𝑠. (21)
Smoothing constants are also defined for the location level (𝜆𝑐𝑙, 𝜆𝑐𝑙) and product level
(𝜆𝑐𝑝, 𝜆𝑐𝑝) to determine the smoothed values of performance measures at respective levels, like in the
case for system. After each performance review period, the monitoring process discussed in
Algorithm 4 determines the smoothed values of performance measures for different levels and
34 Algorithm 4. Algorithm for monitoring process
for each performance review period 𝑟𝜖 R
for each location 𝑙𝜖 L
for each product p 𝜖 P at location 𝑙
Calculate αrp,TCrp
Calculate δrp, ζrp
end for
Calculate αrl, TCrl
Calculate δrl,ζrl
end for
Calculate αrsys, TCrsys
Calculate δrsys, ζrsys
end for
Threshold values are described for each performance measure at multiple levels. The values
are based on the performance which the hospital management may desire in terms of service level
and costs. The threshold levels for cost at multiple levels are represented by 𝑇𝐿𝑐𝑠𝑦𝑠, 𝑇𝐿𝑙𝑐 𝑎𝑛𝑑 𝑇𝐿 𝑐 𝑝
and the threshold levels for service levels are represented by 𝑇𝐿𝑠𝑙𝑠𝑦𝑠, 𝑇𝐿𝑙𝑠𝑙 𝑎𝑛𝑑 𝑇𝐿𝑝𝑠𝑙. The algorithm
for evaluation exactly follows the evaluation hierarchy. The inventory policy at different levels are
evaluated after each performance review period and if significant deviation is found from optimal
performance measure at that point of time, they are optimized to the optimal values with current
35 Algorithm 5. Algorithm for evaluation process
if δrsys ≤ TLsyssl ORζrsys≥ TLsysc then for each location 𝑙 𝜖 𝐿: 𝑙 ≠ 0
for each product 𝑝 𝜖 𝑃 in location 𝑙
Optimize 𝑸𝒑𝒍𝒕, 𝒓𝒑𝒍𝒕 end for
end for
else for each location𝑙 𝜖 𝐿: 𝑙 ≠ 0 if δrl ≤ TLlslOR ζrl ≥ TLlcthen
for each product p 𝜖 P in location 𝑙 Optimize 𝑸𝒑𝒍𝒕, 𝒓𝒑𝒍𝒕
end for end if
end for
else for each location𝑙 𝜖 𝐿: 𝑙 ≠ 0
for each product 𝑝 𝜖 𝑃 in location 𝑙 if δrp ≤ TL𝑝slOR ζr𝑝 ≥ TL𝑝c then
Optimize 𝑸𝒑𝒍𝒕, 𝒓𝒑𝒍𝒕 end if
end for end for end if else
36
4.5. Experimentation Methodology
The capabilities and limitations of the methodology designed in section 4.3 is investigated
through an experimental performance evaluation. The goal of the experimentation is to assess the
effectiveness of the methodology in capturing evaluation points and identifying the extent of
evaluation. The experimentation also tests the robustness of the methodology when applied to
alternate system configurations. This section provides an overview of all the factors considered in
the experimental design for performance testing.
The methodology is based on hospital design, monitoring, evaluation and forecasting module.
The robustness test of the approach considers the hospital size, product demands and deviations in
demand and lead time as important factors to investigate. The effectiveness of the methodology is
based on the smoothing parameters using in the tracking chart and the smoothing parameters in
the forecasting method to capture the points of evaluation. Hence, factors in both the categories
for robustness and effectiveness are brought together to develop an experimental design.
Running the test in a physical hospital is a time-consuming process, since monitoring and
analyzing the results from the observations takes a long time. Testing of the experimental design
is done efficiently through a hospital simulation model. Simulation techniques provide an added
advantage of what-if analysis which is helpful in running different scenarios of the experimental
design. The simulation model mimics the hospital operations and monitors performance measures
such as service level and cost as shown in Figure 13. The algorithms discussed in section 4.4 are
used as a reference to build the supply chain operations like placing replenishment orders,
inventory audits, administering patient demands and replenishing the product shelves. The
smoothed values of the performance measures are compared with the thresholds to make an
37
Figure 13 Experimentation methodology of the adaptive framework
The simulation model structure and implementation are discussed in detail in the section
to follow. The experimental design factors are discussed in detail in section 7.2. In addition to the
experimental factors the effect of forecasting parameters, the effect of tracking chart parameters
and the effect of the hospital system configuration on the performance of the approach is discussed
38
5. Simulation Implementation
Discrete event simulation is used to model the daily operations in a hospital. The process of
patient arrival, inventory audit, administering the demands, and daily operations of replenishment
are modeled using the SIMIO simulation software, to analyze the performance of hospital supply
chain. The simulation model is built using SIMIO objects. A brief description of each SIMIO
object used in the model and their basic functionalities are provided in the table.
Table 2 List of SIMIO objects used in building the model
SIMIO Object
Description of functionality System processes
Source Creates model entities that arrive to the system.
Facilitates in modelling the patient arrival process and the inventory audit process.
Vehicle Transports the model entities between
two SIMIO objects.
Used as a worker who carries the products from central storage to units and from the receiving docks to central storage.
Path A pathway between two points in the
system on which the entities travel.
Represents hallways within the hospital system in which the worker carries the products.
Resource Models any type of resource that can be
used for processing by other objects.
Used to model the nurses and workers who stay within the units and central storage executing the inventory audit process.
Server Models a service process that can handle
a queue.
Models the various inventory
related operations like ordering
replenishments, refilling the
products and inventory audit
process. Transfer
Node
A point or a location in the system where entities wait for vehicles to go to a destination.
Facilitates as a point where the products are transferred from one location to another. Represents a dock where the products are received from the distributor or the interface between unit and central storage.
Sink Destroys entities and records statistics as
required.