FINANCIAL REPORT
2005
FINANCIAL
REPOR
T
EUROPEAN UNION
FINANCIAL REPORT
A great deal of additional information on the European Union is available on the Internet. It can be accessed through the Europa server (http://europa.eu).
Cataloguing data can be found at the end of this publication.
Luxembourg: Office for Official Publications of the European Communities, 2006
ISBN 92-79-01047-6
© European Communities, 2006
Reproduction is authorised provided the source is acknowledged.
Printed in Belgium
PRINTED ON WHITE CHLORINE-FREE PAPER
Europe Direct is a service to help you find answers to your questions about the European Union
Freephone number (*): 00 800 6 7 8 9 10 11
FOREWORD
You are reading the 2005 edition of the European Union Financial Report. This document pro-vides you with an overview of the main policies and activities financed by the European Union budget in 2005, figures on the budgets since the birth of the EU, and much more valuable infor-mation. The EU budget evolves according to the challenges it is meant to answer, and the least that can be said is that 2005 was no exception!
A year of challenges
The year 2005, the first full calendar year of the Barroso Commission, was a challenging year for European integration. It was marked by negative referendums on the Constitution in two of the founding Member States, the inconclusive European Council during the Luxembourg Presi-dency in June and heated debates about the next EU financial framework for 2007–13. We wit-nessed persistent slow economic growth and high unemployment in several Member States. It was also a year of tragic natural disasters and horrifying terrorist attacks.
The year was not bereft of important positive developments, however. In my area of responsibil-ity, the December European Council averted a major crisis by agreeing on a compromise pro-posal concerning the multiannual financial framework 2007–13. Earlier in the year, the spring European Council gave fresh impetus to the efforts of economic modernisation, by deciding to focus in future on two main goals: achieving stronger and more lasting growth and creating more and better jobs. More progress was achieved at the informal meeting of Heads of State or Government at Hampton Court, during which a consensus emerged that confirmed the Commis-sion’s analysis on how to safeguard the values of the European social model in a globalised world. It was agreed that action at European Union level was essential to tackle themes of vital importance for its future: research and innovation, higher education, energy, border management and immigration, and the demographic future of Europe. More on the European Union strategy for growth and jobs and the contribution the EU budget makes to achieving its objectives can be found in a separate section of this report.
Although working hard to remain a top-of-the-league economic power, the EU certainly does not forget its responsibility to the rest of the world and in particular to the developing countries. In 2005, the Commission was one of the world’s top five providers of official development as-sistance (ODA). The Commission speeded up its disbursement of support which totalled EUR 6.2 billion during the year (an increase of 10 % compared with the previous year). A new devel-opment policy statement — the European consensus on develdevel-opment — was adopted by the Council and the European Parliament on the basis of a proposal from the Commission. For the first time in 50 years, the Declaration defines at EU level the common values, principles, objec-tives and means of eradicating poverty and achieving the millennium development goals (MDGs).
The 2005 budget in figures
pay-ments below the ceilings of the financial perspective, which fixes the spending limits for any given year (agreed with the Member States and the Parliament).
The revenue required from Member States to finance the payments represented only 0.93 % of EU GNI, as a small surplus of EUR 2.7 billion was deducted from the own resource payments to be made by Member States to the EU.
In terms of surplus, 2005 was a benchmark year, with a reduction in the level of unspent credits to less than EUR 1.1 billion compared with EUR 1.2 billion in 2004, and an overall surplus (in-cluding revenue) of EUR 2.4 billion, EUR 0.3 billion less than the previous year. Public re-sources are scarce and need to be managed as efficiently and rationally as possible. For this rea-son, I am particularly vigilant on the correct use of the resources put at the disposal of the EU, ensuring that the appropriations requested from Parliament and Council correspond to those ac-tually needed and are therefore used up at the end of the year.
Active management also means being able to respond quickly to disasters. This was particularly true in the case of the Commission’s reaction to the tsunami in Asia on 26 December 2004. Within days, the first payment had been made and more followed in the course of 2005. All told, for the year 2005, the Commission pledged a total of EUR 281 million comprising EUR 123 million in emergency aid, and EUR 158 million in reconstruction aid.
Preparing the future
The year 2005 saw significant movement towards a modernisation of the structure of future EU budgets. Intense negotiations took place on the next multiannual financial framework which will cover the years 2007–13. After heated discussions under both the Luxembourg and UK Presi-dencies, the December European Council reached an important compromise on the issue, open-ing the door to final negotiations with the European Parliament and the Commission in 2006. The Commission played an important role in these discussions, defending overall European in-terests and playing the honest broker by providing its technical expertise and compromise pro-posals. I am particularly proud of the Commission’s contribution to achieving the compromise between Member States during the crucial December summit.
Page
Foreword 3
1. The economic situation of the European Union in 2005 7
2. The financial perspectives of the European Union 9
3. The budget procedure 2005 13
4. EU budget revenue in 2005 21
5. Budget implementation 2005 26
6. How the EU budget creates more growth and jobs 31
7. The European Development Fund: funding the EU’s commitment
to development in Africa, the Caribbean and the Pacific 39
8. Policy areas and activities by activity-based budgeting (ABB) 47
— Economic and financial affairs — Enterprise
— Competition
— Employment and social affairs — Agriculture and rural development — Energy and transport
— Environment — Research
— Information society — Direct research — Fisheries — Internal market — Regional policy
— Taxation and customs union — Education and culture — Press and communication — Health and consumer protection — Area of freedom, security and justice — External relations
— Trade
— Development and relations with ACP countries — Enlargement
Page
9. The fight against fraud 117
10. Borrowing and lending activities in 2005 120
11. Treasury report 124
Annexes
Annex I — The budget of the European Union — Historical tables (1958–2005) 127
After growing at potential in 2004, the eco-nomic performance of both the euro area and the EU was less dynamic in 2005. The aver-age growth rate of GDP for 2005 was 1.3 % in the euro area and 1.5 % in the EU as a whole. However, these annual figures hide some en-couraging developments concerning the strengthening of domestic demand during the course of the year.
At the beginning of 2005, the main contribu-tion to growth came from the external sector, while in the second half of 2005 the main stimulus to growth shifted towards the domes-tic demand components. Also the survey indi-cators, following the poor readings during the first half of 2005, began to send out positive signals during the third quarter on the prospects for a recovery. In the EU, the contri-bution to growth was predominantly stem-ming from consumption and investment, while in the euro area the accumulation of in-ventories also supported domestic demand.
Growth in investment picked up in both areas in the first three quarters of 2005. After an in-crease of 0.9 % in the second quarter, invest-ment in the euro area grew by 1.3 % in the third quarter. The corresponding figures for the EU were 1.0 % and 1.5 %, respectively. The annual rate of growth of loans to the non-financial corporate sector rose to 6.8 % in the third quarter from 6.1 % in the second quarter. In the third quarter, private consumption also gave a positive contribution to growth. Private consumption expenditure accelerated to 0.4 % in the EU and to 0.3 % in the euro area, up 0.1 % respectively from the previous quarter. The annual growth rate of loans to the house-hold sector accelerated to 9.2 % in the third quarter, from 9.0 % in the second quarter.
The growth slowdown in the last quarter of 2005 was mainly due to subdued output growth in Germany and France, while eco-nomic activity remained buoyant in Spain and the UK. Investment growth remained robust while private consumption growth slowed
down. Ongoing dynamism for investment is in line with business survey data that suggest continued optimism in the corporate sector. In view also of a gradual but sustained improve-ment in consumer surveys, it was expected that the slowdown in the fourth quarter of 2005 was of a temporary nature and economic vigour would resume in the first half of 2006.
After falling below 2 % in the beginning of 2005, the annual rate of headline inflation in the euro area fluctuated around 2.1 %, before rising to 2.5 % in September–October. The HICP (harmonised index of consumer prices) inflation rate eased somewhat by the end of the year. The stickiness of euro-area inflation mainly reflected the rise in energy inflation, triggered by soaring oil prices. During the course of 2005, crude oil prices rose by more than 60 % in euro terms. In contrast to the up-ward trend in headline inflation, core inflation (HICP inflation excluding energy and un-processed food) declined in early 2005 and hovered around this level for the rest of the year. In the euro area, core inflation dimin-ished from 2 % at the end of 2004 to 1.4 % in December 2005. A similar decelerating pat-tern was evident for the EU. In terms of annu-al averages, headline HICP inflation in the euro area was 2.2 % in 2005, marking a sixth consecutive year of the average annual infla-tion somewhat above 2 %.
un-employment rates and in the average duration of unemployment spells, as well as an im-provement in the matching process. In line with the usual lagged response of the labour market, employment is expected to have in-creased by 1 % in the euro area and by 0.9 % in the EU in 2005.
The general government deficit in the euro area is estimated to have risen to 2.9 % of GDP in 2005, up from 2.7 % of GDP a year earlier, in the wake of slowing economic growth. Based on the usual assumption of un-changed policies, the fiscal stance is expected to be broadly neutral. These projections are confirmed in the most recent updates of the stability programmes. Thanks to the planned fiscal adjustment effort in some non-euro-area countries, the fiscal stance is expected to be slightly restrictive for the EU as a whole in 2006. The upward trend in the euro-area debt to GDP ratio observed since 2003 is not
ex-pected to reverse during the forecast period. It is projected to reach 71.7 % of GDP in both 2005 and 2006, and 71.8 % of GDP in 2007, around 1 percentage point higher than in 2004. A similar development is expected in the EU, where the debt ratio is set to increase, to close to 64.5 % of GDP in 2007, up from 64 % of GDP in 2005.
Since 1988, the Community budget has been defined within a multiannual financial frame-work — the financial perspective (FP) — in order to ensure tighter budgetary discipline and to improve the functioning of the bud-getary procedure and interinstitutional cooper-ation.
The current financial perspective was agreed at the European Council in Berlin in March 1999 for a period of seven years (2000–06). It is the third financial programming period after those of 1988–92 and 1993–99. Its definition and implementing provisions are set out in de-tail in the interinstitutional agreement (IIA) of 6 May 1999 on budgetary discipline and im-provement of the budgetary procedure.
Structure of the financial
perspective
Following the adjustment of the financial per-spective for enlargement adopted in 2003, the financial framework consists of eight head-ings — some of them broken down into sub-headings — with an annual ceiling for com-mitment appropriations set for each heading. The sum of the ceilings of all eight headings gives the total ceiling of commitment appro-priations. A corresponding estimate is then es-tablished for the annual ceiling of payment appropriations.
Implementation of the
financial perspective (FP)
Technical adjustment
Under the terms of the IIA, at the beginning of each budgetary procedure the Commission carries out the technical adjustment of the FP in order to take into account inflation and the trend in the growth of evolution of gross na-tional income (GNI). As the financial perspec-tive framework was originally expressed in
constant prices (1999 prices), it has to be ad-justed to the most recent economic environ-ment before the preliminary draft budget for the following year is established.
The technical adjustment exercise is differen-tiated by heading. A fixed rate of 2 % per year is used as a deflator for:
amounts entered under heading 1 ‘Agricul-ture’;
amounts entered under the ‘Structural Funds’ subheading of heading 2.
The GNI deflator in euro is applied to the amounts entered in all other headings (actual deflator). Because the enlargement to include the 10 new Member States took place in the middle of the year (on 1 May 2004), the Com-mission exceptionally adopted the technical adjustment for 2004 in two steps. On 23 De-cember 2002, the Commission made the tech-nical adjustment for 2004 concerning the EU with 15 Member States. On 19 May 2003, the technical adjustment of the financial perspec-tive for the EU with 25 Member States was adopted, together with the adjustment of the financial perspective for enlargement.
Table 1 shows the financial perspective for the enlarged European Union with 25 Mem-ber States, adjusted to 2005 prices.
European Union Solidarity Fund
en-dowed with a maximum annual amount of EUR 1 billion and can be mobilised above the relevant financial perspective ceilings.
In 2005, the EU Solidarity Fund was mo-bilised following violent storms in Slovakia and then in Estonia, Latvia, Lithuania and Sweden for a total of EUR 99 million.
Flexibility instrument
The flexibility instrument is a new feature of the 1999 interinstitutional agreement. It offers the possibility to cover the financing of clear-ly identified expenditure for a given financial
year, which cannot be met within the ceilings available under one or more headings. It has an annual ceiling of EUR 200 million and its mobilisation is decided jointly by the two arms of the budgetary authority on the basis of a Commission proposal.
[image:12.680.168.555.253.526.2]In 2005, the flexibility instrument was mo-bilised for the extension of the Peace II pro-gramme (EUR 45 million), the funding of de-centralised agencies (EUR 40 million), the reconstruction of Iraq (EUR 100 million), and reconstruction assistance to the tsunami-affected countries (EUR 15 million).
TABLE 1
Financial perspective (EU-25) adjusted for enlargement at 2005 prices
(million EUR)
Current prices 2005 prices
Commitment appropriations 2000 2001 2002 2003 2004 2005 2006
1. Agriculture 41 738 44 530 46 587 47 378 49 305 51 439 51 587 1a Common agricultural policy 37 352 40 035 41 992 42 680 42 769 44 598 44 610 1b Rural development 4 386 4 495 4 595 4 698 6 536 6 841 6 977 2. Structural actions 32 678 32 720 33 638 33 968 41 035 42 441 43 701 Structural Funds 30 019 30 005 30 849 31 129 35 353 37 247 37 768 Cohesion Fund 2 659 2 715 2 789 2 839 5 682 5 194 5 933 3. Internal policies 6 031 6 272 6 558 6 796 8 722 9 012 9 138 4. External actions 4 627 4 735 4 873 4 972 5 082 5 119 5 130 5. Administration (1) 4 638 4 776 5 012 5 211 5 983 6 185 6 356
6. Reserves 906 916 676 434 442 446 446
Monetary reserve 500 500 250
Emergency aid reserve 203 208 213 217 221 223 223 Guarantee reserve 203 208 213 217 221 223 223 7. Pre-accession aid 3 174 3 240 3 328 3 386 3 455 3 472 3 472
Agriculture 529 540 555 564
Pre-accession structural instrument 1 058 1 080 1 109 1 129 Phare (applicant countries) 1 587 1 620 1 664 1 693
8. Compensation 1 410 1 305 1 046
Total appropriations for commitments 93 792 97 189 100 672 102 145 115 434 119 419 120 876 Total appropriations for payments 91 322 94 730 100 078 102 767 111 380 114 060 116 555
Ceiling, appropriations for payments
as % of GNI (ESA 95) 1.07 % 1.07 % 1.09 % 1.11 % 1.11 % 1.09 % 1.08 % Margin for unforeseen expenditure 0.17 % 0.17 % 0.15 % 0.13 % 0.13 % 0.15 % 0.16 % Own resources ceiling 1.24 % 1.24 % 1.24 % 1.24 % 1.24 % 1.24 % 1.24 %
Following the presentation by the Commis-sion, in 2004, of the main documents related to the financial framework 2007–13, includ-ing the main communication of 10 February 2004, the proposal of 14 July 2004 on the re-newal of the IIA (document COM(2004) 101 final) and most of the legislative proposals re-lated to the same period, discussions and ne-gotiations in the European Parliament and Council got into full swing in 2005.
In the European Parliament, the Temporary Committee on Policy Challenges and Bud-getary Means of the enlarged Union 2007–13 concluded its work, setting the tone of the Eu-ropean Parliament resolution of 8 June 2005 which explains Parliament’s position on the issue in detail. Under the Luxembourg Presi-dency, the Council discussed several ‘negoti-ating boxes’ which drastically reduced the fi-nancial framework available for the EU, but it proved impossible for the Heads of State or Government, who met at the European Coun-cil of June 2005, to agree on the figures.
After several months during which negotia-tions were stalled, they were relaunched in October 2005 through a Commission initia-tive (letter of 20 October 2005 from Commis-sion President J. M. Barroso to the President of the European Parliament and the President of the Council) on five specific issues: the
earmarking of cohesion spending, the creation of a shock absorber to meet the challenges of globalisation (the European Globalisation Ad-justment Fund), the consolidation of agricul-tural reforms, the commitment to review the EU budget, and the increasing of democratic scrutiny and coherence of external actions.
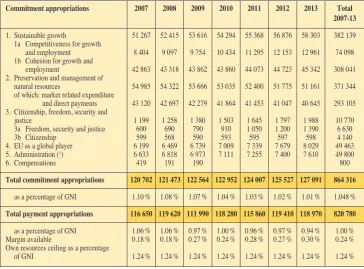
After intensive negotiations during the last weeks of the UK Presidency, Member States were finally able to reach a deal at the Euro-pean Council of 15–16 December 2005 in Brussels. Compared with the initial Commis-sion proposal, which set the annual average ceiling on commitment appropriations for the period 2007–13 at 1.22 % of the gross nation-al income (GNI) of the enlarged Union, the European Council agreed on a global financial framework of EUR 862.3 or 1.045 % EU-GNI.
TABLE 2
Financial framework 2007–13
(million EUR, 2004 prices)
Commitment appropriations 2007 2008 2009 2010 2011 2012 2013 Total
2007-13
1. Sustainable growth 51 267 52 415 53 616 54 294 55 368 56 876 58 303 382 139 1a Competitiveness for growth
and employment 8 404 9 097 9 754 10 434 11 295 12 153 12 961 74 098 1b Cohesion for growth and
employment 42 863 43 318 43 862 43 860 44 073 44 723 45 342 308 041 2. Preservation and management of
natural resources 54 985 54 322 53 666 53 035 52 400 51 775 51 161 371 344 of which: market related expenditure
and direct payments 43 120 42 697 42 279 41 864 41 453 41 047 40 645 293 105 3. Citizenship, freedom, security and
justice 1 199 1 258 1 380 1 503 1 645 1 797 1 988 10 770 3a Freedom, security and justice 600 690 790 910 1 050 1 200 1 390 6 630 3b Citizenship 599 568 590 593 595 597 598 4 140 4. EU as a global player 6 199 6 469 6 739 7 009 7 339 7 679 8 029 49 463 5. Administration (1) 6 633 6 818 6 973 7 111 7 255 7 400 7 610 49 800
6. Compensations 419 191 190 800
Total commitment appropriations 120 702 121 473 122 564 122 952 124 007 125 527 127 091 864 316
as a percentage of GNI 1.10 % 1.08 % 1.07 % 1.04 % 1.03 % 1.02 % 1.01 % 1.048 %
Total payment appropriations 116 650 119 620 111 990 118 280 115 860 119 410 118 970 820 780
as a percentage of GNI 1.06 % 1.06 % 0.97 % 1.00 % 0.96 % 0.97 % 0.94 % 1.00 % Margin available 0.18 % 0.18 % 0.27 % 0.24 % 0.28 % 0.27 % 0.30 % 0.24 % Own resources ceiling as a percentage
of GNI 1.24 % 1.24 % 1.24 % 1.24 % 1.24 % 1.24 % 1.24 % 1.24 %
Budget guidelines
In its conclusions adopted on 9 March 2004, the Council underlined the importance of maintaining overall budget discipline and stressed once again the importance of keeping a tight grip on payment appropriations. Whilst supporting the presentation of the budget on the basis of the ‘activity based budgeting’ method, the Council called on the Commis-sion to improve the quality of information provided during the 2005 budget procedure.
On 22 April 2004, Parliament adopted a reso-lution on the Commission’s annual policy strategy. It set out its priorities for the 2005 budget, namely the Lisbon strategy, justice and home affairs, information policy, and co-hesion policy.
Preliminary draft budget (PDB)
2005
The preliminary draft budget for 2005 (the first budget covering expenditure for 25 Member States over the whole year) was ap-proved by the Commission on 28 April 2004.
Commitment appropriations for the enlarged Union came to EUR 117.2 billion, which rep-resented an increase of 5.2 % over 2004. The total amount left a margin of EUR 2.4 billion under the ceiling for 2005.
[image:15.680.132.512.249.552.2]The level of EUR 109.5 billion in payment appropriations proposed by the Commission was equivalent to 1.03 % of the gross national income (GNI) for the Union of 25 Member States. The financial framework agreed for the
FIGURE 1
The budget procedure
COMMISSION Preliminary draft budget in April/May (PDB)
COUNCIL Draft budget (DB) in July (qualified majority)
PARLIAMENT First reading of the DB in October
Amendments of non- Proposed modifications to compulsory expenditure compulsory expenditure
COUNCIL Second reading of amendments/modifications
YES NO YES NO
Qualified majority Qualified majority
Council fixes
PARLIAMENT Second reading of non-compulsory expenditure in December
YES = NO =
Amount and remarks voted First reading/New amount Majority of Members + three-fifths votes)
enlarged Union provided for a maximum of 1.08 %. The preliminary draft was therefore far lower — by EUR 4.7 billion — than the ceiling agreed for 2005. The overall increase of EUR 9.7 billion compared with the 2004 budget was due to the full incorporation of the new Member States (EUR 3.9 billion), the re-form of the common agricultural policy for an amount of EUR 1.3 billion, and the improved use of the Structural Funds (EUR 2.7 billion). These three factors accounted for more than 80 % of the total increase in payments over 2004.
The broad lines of the proposed preliminary draft budget, by financial perspective heading, are described below.
In agriculture, the appropriations for the EU-25 came to EUR 50.7 billion, of which EUR 6.8 billion was earmarked for rural development (15 % more than in 2004). The new Member States were allocated EUR 3.6 billion, of which EUR 1.9 billion was for rural development. The amount for market and veterinary expenditure in the new Member States had substantially in-creased, but was still relatively low, as di-rect aid was being phased in.
The Structural Funds received an increase of 3.3 % in commitment appropriations for the enlarged Union. Out of a total of EUR 42.4 billion, EUR 7.7 billion would be al-located to the new Member States. Pay-ment appropriations for the Structural Funds came to EUR 35.4 billion for the enlarged Union, 14.8 % more than in the 2004 voted budget.
The level of expenditure allocated to inter-nal policies in 2005 remained relatively stable. Total commitment appropriations were put at EUR 8.9 billion, with payment appropriations at EUR 7.7 billion — an in-crease of 2.8 %. A total of EUR 5 billion in commitment appropriations was available for expenditure on research.
As regards external aid, the Commission proposed commitments of just over EUR 5.2 billion for foreign policy measures, maintaining approximately the same level as in 2004. It proposed EUR 200 million for continued support to Iraq, including EUR 115 million from the flexibility in-strument, while allowing the stabilisation of aid to eastern Europe and central Asia (EUR 515 million) and Latin America (EUR 315 million). There was a boost for the neighbourhood policy with the Mediterranean countries and the Middle East (a total of EUR 1 070 million, includ-ing EUR 200 million for Iraq).
Under the pre-accession strategy, the Commission proposed to increase pre-accession aid for Bulgaria and Romania to EUR 1 550 million, while EUR 300 mil-lion in commitment appropriations was available for Turkey.
In accordance with the Copenhagen deci-sions of December 2002, total payments of EUR 1.3 billion would be available for the new Member States in the 2005 budget in the form of compensation, thus ensuring that the new Member States would contin-ue to be net recipients after accession.
The estimated administrative expenditure of the EU institutions (heading 5) came to EUR 6.36 billion, 4.2 % higher than in the 2004 voted budget. The Commission was asking for 700 new posts as part of the medium-term adjustment to enlargement, of which approximately half were for the language services.
Draft 2005 budget
increase of 5.2 % in appropriations for com-mitments and 5.4 % in appropriations for ments. As a result, the total amount of pay-ment appropriations was equivalent to 0.99 % of Community GNI.
Letters of amendment
No 1/2005. Adopted by the Commission on 13 October, this letter of amendment covered mainly appropriations to finance the econom-ic development of the Turkish Cypriot com-munity and finance for the pre-accession strat-egy for Croatia as well as a number of technical corrections to the budget remarks in order to take account of the legal bases adopt-ed since the presentation of the PDB for 2005.
No 2/2005. The Commission adopted on 29 October a second letter of amendment to PDB 2005, providing for: the establishment of an executive agency for education and culture to implement programmes in that field; the es-tablishment of an executive agency for the public health programme (2003–08) to sup-port the Commission services in the imple-mentation of that programme; and the creation of a supervisory authority for the European global navigation satellite system.
No 3/2005. On 26 October, the Commission adopted the ad hoc letter of amendment, pro-vided for in the interinstitutional agreement of 6 May 1999, updating the estimates for agri-cultural expenditure and for international fish-eries agreements. The overall impact of the letter of amendment was a reduction of agri-cultural expenditure by EUR 224 million, mainly due to changes in market conditions.
Parliament’s first reading
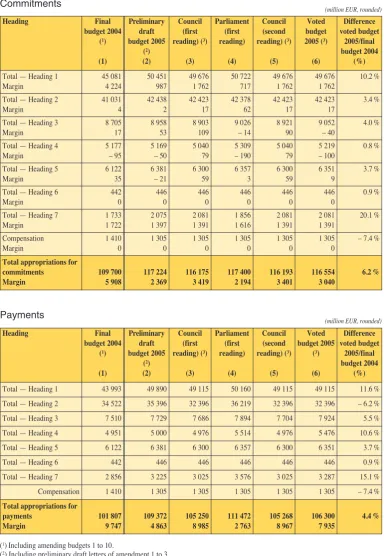
By its vote in first reading, which took place on 28 October, the European Parliament adopted a budget of EUR 117.4 billion in commitment appropriations and EUR 111.5
billion in payment appropriations. These new amounts represented an increase of 7.0 % in commitment appropriations and of 9.5 % in payment appropriations compared with the 2004 voted budget.
Council’s second reading
The Council had its second reading of the 2005 draft budget on 29 November, following the conciliation meeting with a delegation from Parliament on 25 November, as provided for in the interinstitutional agreement of 6 May 1999. The second reading resulted in a total of EUR 116.2 billion in commitment ap-propriations and EUR 105.3 billion in pay-ment appropriations.
Parliament’s second reading
(voted budget)
The 2005 budget was adopted on 16 Decem-ber 2004 after Parliament’s second reading. It totalled EUR 116.6 billion in appropriations for commitments and EUR 106.3 billion in appropriations for payments, in line with the agreement reached at the conciliation meeting between Parliament and the Council. Com-pared with the 2004 voted budget, this was an increase of 6.2 % in commitments and 4.4 % in payments. The volume of appropriations for payments represented 1.004 % of the gross national income (GNI) of the enlarged Euro-pean Union. This left a margin of EUR 3.04 billion in commitments and EUR 7.9 billion in payments beneath the ceilings of the finan-cial perspective. The use of the flexibility in-strument was confirmed (EUR 30 million to finance the decentralised agencies and EUR 100 million for assistance to Iraq).
TABLE 3
Various stages of the budget procedure
Commitments
(million EUR, rounded)
Payments
(million EUR, rounded)
Heading Final
budget 2004 (1)
(1)
Preliminary draft budget 2005
(2)
(2)
Council (first reading) (3)
(3) Parliament (first reading) (4) Council (second reading) (3)
(5)
Voted budget 2005 (3)
(6) Difference voted budget 2005/final budget 2004 (%)
Total — Heading 1 Margin 45 081 4 224 50 451 987 49 676 1 762 50 722 717 49 676 1 762 49 676 1 762 10.2 %
Total — Heading 2 Margin 41 031 4 42 438 2 42 423 17 42 378 62 42 423 17 42 423 17 3.4 %
Total — Heading 3 Margin 8 705 17 8 958 53 8 903 109 9 026 – 14 8 921 90 9 052 – 40 4.0 %
Total — Heading 4 Margin 5 177 – 95 5 169 – 50 5 040 79 5 309 – 190 5 040 79 5 219 – 100 0.8 %
Total — Heading 5 Margin 6 122 35 6 381 – 21 6 300 59 6 357 3 6 300 59 6 351 9 3.7 %
Total — Heading 6 Margin 442 0 446 0 446 0 446 0 446 0 446 0 0.9 %
Total — Heading 7 Margin 1 733 1 722 2 075 1 397 2 081 1 391 1 856 1 616 2 081 1 391 2 081 1 391 20.1 % Compensation Margin 1 410 0 1 305 0 1 305 0 1 305 0 1 305 0 1 305 0
– 7.4 %
Total appropriations for commitments
Margin 109 700 5 908 117 224 2 369 116 175 3 419 117 400 2 194 116 193 3 401 116 554 3 040 6.2 %
(1) Including amending budgets 1 to 10.
(2) Including preliminary draft letters of amendment 1 to 3. (3) Including letters of amendment 1 to 3.
Heading Final
budget 2004 (1)
(1)
Preliminary draft budget 2005
(2)
(2)
Council (first reading) (3)
(3) Parliament (first reading) (4) Council (second reading) (3)
(5)
Voted budget 2005
(3)
(6) Difference voted budget 2005/final budget 2004 (%)
Total — Heading 1 43 993 49 890 49 115 50 160 49 115 49 115 11.6 %
Total — Heading 2 34 522 35 396 32 396 36 219 32 396 32 396 – 6.2 %
Total — Heading 3 7 510 7 729 7 686 7 894 7 704 7 924 5.5 %
Total — Heading 4 4 951 5 000 4 976 5 514 4 976 5 476 10.6 %
Total — Heading 5 6 122 6 381 6 300 6 357 6 300 6 351 3.7 %
Total — Heading 6 442 446 446 446 446 446 0.9 %
Total — Heading 7 2 856 3 225 3 025 3 576 3 025 3 287 15.1 %
Compensation 1 410 1 305 1 305 1 305 1 305 1 305 – 7.4 %
Total appropriations for payments
Budgetary adjustments
Carryover from 2004
The situation of commitment appropriations carried over into 2005 was as follows:
(million EUR)
(1) Includes reconstituted appropriations.
There was almost full (99 %) implementation of the commitment appropriations carried over.
Heading Carryover from 2004 Implemented 2005 Cancelled
1. Agriculture 49.5 49.0 0.5
2. Structural operations (1) 115.2 115.2 0.0
3. Internal policies 35.0 33.8 1.2
4. External actions 8.9 8.3 0.6
5. Administration (Commission) 0.4 0.3 0.1
7. Pre-accession 1.5 1.5 0.0
Amending budgets (Part III — Commission)
(million EUR)
Amending
budget (AB) Adoption date Subject Heading CAAmountsPA
AB 1/2005 22.12.2004 Reorganisation of the Commission’s services and thenecessary technical modifications to the 2005 budget 5 0 0
AB 2/2005 30.3.2005 Adjustment of administrative appropriations (annual
adaptation of salaries and pensions for the institutions) 5 – 39.0 – 39.0
AB 3/2005 27.4.2005 Rehabilitation and reconstruction assistance to theearthquake/tsunami-affected countries 4 15.0 0
AB 4/2005 13.5.2005 Budgeting the surplus resulting from implementation
of the budget year 2004 n.a. Income Income
AB 5/2005 7.9.2005
Revision of the forecast of own resources and mobilisation of the EU Solidarity Fund requested by Slovakia
3 5.7 0
Amending
budget (AB) Adoption date Subject Heading Amounts
CA PA
AB 6/2005 17.11.2005 Mobilisation of the European Solidarity Fund for
Estonia, Latvia, Lithuania and Sweden 3 92.9 92.9
AB 8/2005 13.12.2005
To take into consideration the exceptional increase in forecast revenue, in particular for the revision of the forecast of VAT and GNI balances and the redeploy-ment of appropriations within heading 2 and a decrease in heading 1
1, 2 – 653.0 – 650.0
The impact of these amending budgets on the headings of the financial perspectives is given in the following table:
(million EUR)
Heading CA PA
1. Agriculture – 650 – 650 2. Structural operations – 3
3. Internal policies + 99 + 93 4. External actions + 15
5. Administration – 59 – 59 7. Pre-accession aid
Transfers
Transfers from the reserve
The initial reserve is composed of provisional appropriations placed there by the budgetary authority whilst awaiting the adoption of a legal base or for other reasons.
(million EUR)
Heading
Commitments Payments
Initial
reserve Transfersto operational
lines
Unused reserve end 2005
Initial
reserve Transfersto operational
lines
Unused reserve end
2005, after transfers
1. Agriculture (rural development only) 0 0 0 0 0 0
2. Structural operations 0 0 0 0 284.3 0
3. Internal policies 71.3 67.7 3.6 42.7 7.7 13.3
4. External actions 134.8 344.1 0.7 25.1 – 278.4 0
5. Administration 8.2 6.9 1.3 8.2 6.7 1.3
6. Reserve 120.0 – 210.0 0 0 – 100.0 0
7. Pre-accession aid 120.0 120.0 0 26.8 167.8 0
Total 334.2 328.7 5.5 102.7 88.2 14.5
Transfers between chapters
In 2004, the number of transfers submitted to the budget authority rose sharply compared with previous years: 71 were submitted for
(million EUR)
Heading
Commitments Transfers
to a chap-ter
Transfers from a chapter
Impact between headings
1. Agriculture 356.4 – 356.4 0
2. Structural operations 0.1 – 0.1 0
3. Internal policies 103.0 – 94.8 8.2
4. External actions 419.8 – 333.2 86.6
5. Administration 50.0 – 54.9 – 4.9
6. Reserves 140.1 – 350.1 – 210.0
7. Pre-accession aid – 1.5 121.5 120.0
Total 1 068.0 1 068.0 0
By comparison, in 2004 the transfers between chapters were EUR 798 million for commit-ment appropriations and EUR 1 676 million for payment appropriations. The number of transfers submitted to the budget authority was similar to that of 2004: 64 were submitted for decision and 20 for information. Of the
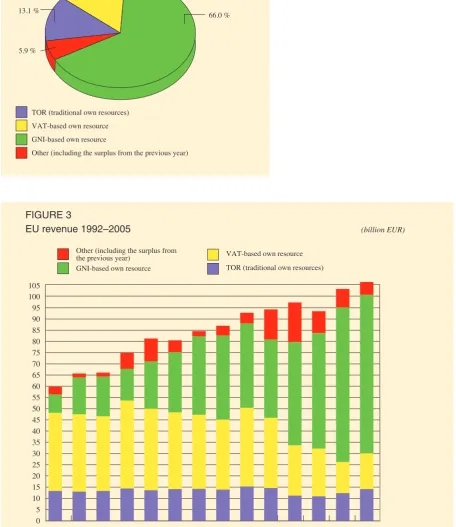
The budget of the European Union is financed by own resources and other revenue. In 2005, own resources amounted to EUR 100.8 billion and other revenue to EUR 6.3 billion (of which EUR 2.7 billion corresponded to the surplus carried over from the previous year).
When the Council and Parliament approve the annual budget, total revenue must equal total expenditure. The total amount needed to fi-nance the budget follows automatically from the level of total expenditure. However, since outturns of revenue and expenditure usually differ from the budgeted estimates at the end of the financial year, there is a balance result-ing from the implementation of the budget. Normally, there has been a surplus, which re-duces Member States’ own resources pay-ments in the subsequent year.
Own resources
The basic rules on the system of own resources are laid down in a Council decision (currently 2000/597/EC, Euratom), adopted by unanimity in the Council and ratified by all Member States. Own resources can be defined as rev-enue accruing automatically to the EU in order to finance its budget without the need for any subsequent decision by national authorities. The overall amount of own resources needed to fi-nance the budget is determined by total expen-diture less other revenue. The total amount of own resources cannot exceed 1.24 % of the EU gross national income (GNI).
Own resources can be divided into the follow-ing categories:
traditional own resources (TOR), which in-clude two categories: agricultural duties and sugar levies on the one hand and cus-toms duties on the other hand;
the VAT-based own resource;
the GNI-based own resource (‘the addi-tional fourth resource’), which acts as a residual resource.
Finally, a specific mechanism for correcting budgetary imbalances in favour of the United Kingdom (UK correction) is also part of the own resources system.
Traditional own resources
(customs duties, agricultural
duties and sugar levies)
Traditional own resources (TOR) are levied on economic operators and collected by Mem-ber States on behalf of the EU. TOR payments accrue directly to the EU budget, after deduc-tion of a 25 % compensadeduc-tion retained by the Member States as collection costs.
Agricultural duties and customs duties are levied on imports of agricultural and non-agri-cultural products from third countries, at rates based on the Common Customs Tariff. In 2005, these resources corresponded to 1.3 % and 11.9 % of total own resources, respectively.
Sugar levies are paid by sugar producers to fi-nance the export refunds for sugar. Revenue from this resource amounted to 0.7 % of total own resources payments in 2005.
The own resource based on
value added tax (VAT)
prosperity, consumption and hence VAT tend to account for a higher percentage of a coun-try’s national income.
In 2005, the 50 % ‘capping’ was applied to 13 Member States (Czech Republic, Estonia, Greece, Spain, Ireland, Cyprus, Lithuania, Luxembourg, Malta, Poland, Portugal, Slove-nia and the United Kingdom).
The maximum percentage rate of the VAT base that can be called was fixed at 0.50 % in 2005. However, this rate must be decreased to take account of the UK correction (see below). The actual rate of call of VAT in 2005 amounted to 0.3179 % (rounded figure).
The total amount of the VAT-based resource (including adjustments for previous years) levied in 2005 reached EUR 16.0 billion or 15.9 % of total own resources.
The own resource based on
gross national income (GNI)
The GNI-based own resource (‘additional fourth resource’) was introduced in 1988 to balance budget revenue and expenditure, i.e. to finance the part of the budget not covered by other rev-enue. The same percentage rate is levied on each Member State’s GNI, which is established in ac-cordance with Community rules.
The rate is fixed during the budgetary proce-dure. The amount of the GNI resource needed depends on the difference between total expen-diture and the sum of all other revenue. In 2005, the rate of call of the GNI-based resource amounted to 0.6518 % (rounded figure).
The total amount of the GNI-based resource (in-cluding reserves and adjustments for previous years) levied in 2005 reached EUR 70.9 billion or 70.3 % of total own resources.
The correction of budgetary
imbalances in favour of the
United Kingdom (UK correction)
The current UK correction mechanism was in-troduced in 1985 to correct the imbalance be-tween the United Kingdom’s share in payments to the Community budget and its share in Community expenditure allocated to the Mem-ber States. This mechanism has been modified on several occasions to compensate for changes in the system of EU budget financing, but the basic principles remain the same.
This imbalance is calculated as the difference between the percentage share of the UK in EU expenditure paid in the Member States (‘allo-cated expenditure’) and the UK share in total VAT-based and GNI-based own resources pay-ments. The difference in percentage points is multiplied by the total amount of EU expendi-ture allocated to the Member States. The UK is reimbursed 66 % of this budgetary imbalance.
The cost of the correction is borne by the other 24 Member States. The distribution of the fi-nancing is first calculated on the basis of each country’s share of total EU GNI. The financing share of Germany, the Netherlands, Austria and Sweden, however, is restricted to one fourth of its normal value. This cost is redistributed across the remaining 20 Member States.
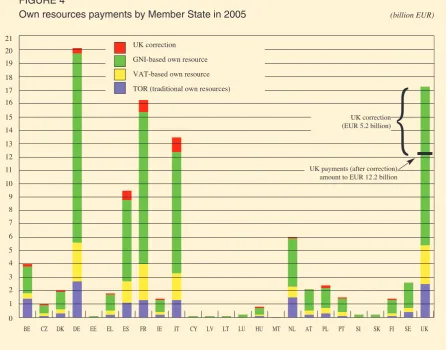
The total amount of the UK correction paid in 2005 amounted to EUR 5.2 billion.
Other revenue
previ-ous year. However, this last item is mainly de-rived from the difference between the outturn of own resources payments and expenditure in the previous year.
[image:25.680.129.518.321.674.2]In 2005, other revenue amounted to EUR 6.3 billion, of which EUR 2.7 billion correspond-ed to the surplus carricorrespond-ed over from the year 2004.
TABLE 4
Own resources payments by Member State in 2005
(EUR)
Traditional own VAT-based GNI-based UK correction (2) Total
resources own resources own resources own resources
payments, payments at payments (1) payments
net (75 %) uniform rate
(1) (2) (3) (4) (5)=(1)+(2)+(3)+(4)
Belgium 1 373 194 617 422 810 665 2 000 160 946 227 587 594 4 023 753 822 Czech Republic 146 129 824 150 645 832 614 632 972 78 784 207 990 192 835 Denmark 298 202 668 253 067 275 1 289 260 860 148 488 377 1 989 019 181 Germany 2 724 357 677 2 888 310 840 14 153 712 793 369 925 177 20 136 306 486 Estonia 16 004 063 14 907 226 61 225 091 7 579 685 99 716 065 Greece 199 648 547 286 074 084 1 173 594 284 142 237 984 1 801 554 898 Spain 1 097 809 043 1 616 646 836 6 075 331 845 685 129 043 9 474 916 768 France 1 337 260 736 2 655 486 340 11 431 427 732 1 429 916 578 16 854 091 385 Ireland 182 249 608 229 719 838 923 538 527 106 961 354 1 442 469 326 Italy 1 341 876 925 2 003 793 199 9 092 984 303 1 108 008 384 13 546 662 811 Cyprus 35 236 120 20 459 094 83 418 950 10 891 043 150 005 208 Latvia 20 353 457 17 113 961 82 327 478 9 955 264 129 750 159 Lithuania 34 136 442 29 823 786 126 871 518 16 168 908 207 000 654 Luxembourg 15 812 471 37 724 539 153 613 894 19 879 068 227 029 972 Hungary 113 270 119 108 508 616 540 850 792 70 567 374 833 196 901 Malta 11 896 430 6 816 910 27 680 325 3 748 006 50 141 671 Netherlands 1 484 302 730 757 954 347 3 649 736 514 55 059 122 5 947 052 713 Austria 188 517 191 326 279 958 1 588 908 338 40 327 233 2 144 032 720 Poland 272 033 773 366 061 214 1 495 712 197 193 428 582 2 327 235 766 Portugal 108 026 520 283 685 312 1 025 315 912 109 951 135 1 526 978 879 Slovenia 28 146 118 43 926 763 179 511 791 23 160 725 274 745 397 Slovakia 44 072 834 45 307 827 238 806 003 30 797 591 358 984 255 Finland 112 719 411 214 129 270 1 011 406 434 126 656 189 1 464 911 304 Sweden 351 034 756 338 188 099 1 925 138 621 39 921 593 2 654 283 070 United Kingdom 2 526 846 539 2 900 588 542 11 915 424 337 – 5 185 794 482 12 157 064 936
Total 14 063 138 619 16 018 030 374 70 860 592 456 – 130 664 265 100 811 097 184
% of total 13.9 % 15.9 % 70.1 % 0.1 % 100.0 %
(1) For the simplicity of the presentation, GNI-based own resources payments are presented including the adjustment for the im-pact of non-participation of certain Member States in the justice and home azffairs policy.
0 5
– 5 10 15 20 25 30 35 40 45 50 55 60 65 70 75 80 85 90 95 100 105
1993
[image:26.680.169.626.295.823.2]1992 1994 1995 1996 1997 1998 1999 2000 2001 2002 2003 2004 2005
FIGURE 3
EU revenue 1992–2005 (billion EUR)
Other (including the surplus from the previous year)
GNI-based own resource
FIGURE 2
EU revenue in 2005
TOR (traditional own resources) VAT-based own resource GNI-based own resource
Other (including the surplus from the previous year) 15.0 %
13.1 %
5.9 %
66.0 %
0 1 2 3 4 5 6 7 8 9 10 11 12 13 14 15 16 17 18 19 20 21
FIGURE 4
Own resources payments by Member State in 2005 (billion EUR)
UK correction GNI-based own resource VAT-based own resource TOR (traditional own resources)
BE CZ DK DE EE EL ES FR IE IT CY LV LT LU HU MT NL AT PL PT SI SK FI SE UK UK payments (after correction)
amount to EUR 12.2 billion
{
2. Agriculture
1. Introduction
The commentary that follows concentrates on the financial perspective headings that are the key contributing factors to the underutilisation of budget appropriations (comprising the ini-tial budget appropriations, the iniini-tial reserve, amending budgets, transfers, and carryovers). The tables show, at heading level, the imple-mentation for the total voted budget including transfers and amending budgets (ABs).
The utilisation of earmarked revenues is pre-sented separately. The assessment of the im-plementation of earmarked revenues (for ex-ample, interest on advance payments,
reimbursements on the occasion of pro-gramme/contract closures, EFTA contribu-tions, etc.) needs to be different from general budget appropriations in the sense that its use is subject to specific conditions, is difficult to programme or, in some cases (refunds follow-ing closure of certain programmes), is not meant to be reused. Normally, payments are entered in the budget for an amount corre-sponding to the earmarked commitments, even if it is clear from the outset that these corresponding payments will be implemented only in later years. Furthermore, earmarked revenues remaining unused at the end of the year will not be cancelled but carried forward automatically.
Budget implementation 2005 of authorised appropriations by financial perspective
head-ing is summarised below in percentage terms, in comparison with the previous year.
Heading
Implementation of commitment appropriations (including earmarked revenue)
Implementation of payment appropriations (including earmarked revenue)
2005 2004 2005 2004
1. Agriculture 100 % 97 % 99 % 96 %
2. Structural operations 100 % 99 % 100 % 98 %
3. Internal policies 91 % 92 % 82 % 80 %
4. External actions 97 % 97 % 92 % 90 %
5. Administration 97 % 96 % 85 % 85 %
6. Reserves 59 % 41 % 41 % 41 %
7. Pre-accession aid 94 % 94 % 84 % 95 %
8. Compensation new Member
States 100 % 100 % 100 % 100 %
Total 99 % 98 % 96 % 95 %
Agriculture Final budget Implementation
Heading 1a (million EUR) 42 534.4 42 136.4 Heading 1b (million EUR) payment appropriations 6 373.6 6 329.3 Heading 1 (total, million EUR) 48 908.0 48 465.7
Implementation (%) 99 %
Carryover to 2006 (million EUR) 285.5
Total agricultural expenditure (heading 1) for the year based on commitments made was EUR 48.3 billion (100 %), leaving only some EUR 162 million unused. This compares favourably with the 99 % outcome for the same period last year.
For CAP (common agriculture policy) -related expenditure (heading 1a), an underutilisation of EUR 768 million compared with the initial budget was recorded, of which EUR 650 mil-lion had already been included in AB 8/2005. The under-implementation compared with the initial budget is a net result of:
milk and milk products: – EUR 769 million, due to a more favourable internal and exter-nal market situation than expected;
additional revenues: + EUR 458 million rev-enues, of which EUR 280 million extra super levy and EUR 178 million additional
financial corrections as compared with the forecasts;
euro/dollar exchange rate: some – EUR 100 million, due to an appreciation of the dollar compared with the estimates from October 2004;
additional expenditure, mostly for plant products, due to extra storage and as a result of cuts in direct payments by the budget au-thority.
For rural development, subheading 1b, under-spending amounted to EUR 44 million, which relates entirely to the new early retirement scheme. This compares with EUR 95 million last year. Of the unused appropriations for the heading, the full amount of EUR 44 million for rural development programmes was car-ried forward to 2006.
3. Structural operations
Structural operations Implementation of commitmentsFinal budget Implementation Final budgetImplementation of paymentsImplementation
Implementation (million EUR) 42 490.1 42 535.7 32 829.7 32 755.4
Implementation (%) 100 100
Under-implementation (million EUR) 45.6 74.3
Carryover to 2006 (million EUR) 43.8 13.9
Under-implementation after carryover (million EUR) 1.8 60.4
Structural operations
commitments
For this heading, practically full implementa-tion for commitment appropriaimplementa-tions was reached, with EUR 46 million unutilised that relate to Structural Fund programmes under Objective 1 (EUR 20 million), innovative measures and technical assistance (EUR 12 million), and to Community initiatives (EUR 11 million). Of the unused appropriations in 2005, EUR 20 million (concerning the Objec-tive 1 programmes, due to a programme
mod-ification in eastern Germany under EAGGF-Guidance) was carried forward to 2006.
Structural operations payments
mea-4 Internal policies
Internal policies commitments
Commitments made for internal policies amounted to EUR 9.5 billion, or 91 % of the total available appropriations, an underutilisa-tion of around EUR 900 million. This com-pares with 92 % for the same period last year. Of the unused appropriations, EUR 564 mil-lion relates to earmarked revenue, and mostly concerns the completion of previous frame-work programmes under research and techno-logical development. The remaining EUR 344 million unused commitment appropriations are spread across the heading, but mainly con-cern AB 6/2005, under which EUR 93 million was transferred from the EU Solidarity Fund to cover emergency aid following the major storm in Estonia, Latvia, Lithuania and Swe-den. Due to the late adoption of AB 6, the grant decisions and bilateral implementation agreements could not be completed before year-end. Therefore, the full amount of EUR 93 million had to be carried over to 2006. Apart from the commitments for the
Solidari-ty Fund, another EUR 27 million of the ap-propriations that could not be used before end-year 2005 was carried forward to 2006.
Internal policies payments
Payments made amounted to EUR 8.0 billion from available appropriations of EUR 9.7 bil-lion, an implementation rate of 82 %. This compares with EUR 7.3 billion in 2004, an implementation rate of 80 %. The under-implementation is mainly accounted for by earmarked revenues (over EUR 1 billion), mostly related to payments for the completion of earlier programmes under research and technological development (carried over com-pletely). The remaining unused appropriations of EUR 730 million are budget appropriations spread across the heading, mostly for admin-istrative expenditure related to specific opera-tions. Of the total unused budget payment appropriations for the heading in 2005, an amount of EUR 147 million was carried for-ward to 2006.
Internal policies
Implementation of commitments Implementation of payments Final
budget marked Ear-revenues
Overall Final
budget marked Ear-revenues
Overall
Implementation (million EUR) 8 858.3 689.9 9 548.2 7 413.9 558.2 7 972.1
Implementation (%) 96 55 91 91 35 82
Under-implementation (million EUR) 324.0 564.8 888.8 725.0 1 043.0 1 768.0 Carryover to 2006 (million EUR) 120.3 564.8 685.1 273.3 1 043.0 1 316.3
Under-implementation after carryover (million EUR) 203.7 203.7 451.7 451.7 sures and technical assistance (EUR 25
mil-lion), and to Community initiatives (EUR 12 million). Given the practically full execution, no amounts for this heading are carried over to 2006.
The trends underlying the high level of imple-mentation are clear: the EU-15 2000–06
External actions commitments
Out of total available appropriations of EUR 5.7 billion for the heading as a whole, com-mitments of EUR 5.5 billion were made. This compares with EUR 5.2 billion in 2004, with a similar implementation rate (97 %). The un-derutilisation mainly concerns earmarked rev-enues (of around EUR 100 million, spread across the heading and carried over complete-ly). The unused budget commitments (EUR 41 million) partly relate to the cancelled macro-financial assistance to Georgia, and partly to the former BA lines. Of the budget appropriations that could not be used before end-year 2005, EUR 4 million was carried forward to 2006.
External actions payments
EUR 5.0 billion payments were made in 2005 from total available payment appropriations for this heading of EUR 5.4 billion, an
imple-mentation rate of 92 %, which reflects a con-tinuing improvement on the previous levels of EUR 4.6 billion (90 %) in 2004, EUR 4.2 bil-lion (88 %) in 2003 and 89 % in 2002. This continuous improvement shows the success of the deconcentration exercise and the reform of external aid.
Of the unused appropriations (EUR 420 mil-lion), EUR 80 million concerned earmarked revenues that are spread across the heading and were carried over completely. The re-maining unused budget appropriations partly relate to administrative expenditure for the heading (former BA lines), and on the other hand to cooperation with the western Balkans (EUR 140 million), partly due to lower than expected payments for the Reconstruction Agency. Of the unused budget appropriations, EUR 11 million for CFSP (concerning the EUJUST Rule of Law Mission for Iraq and the Aceh Monitoring Mission) will be carried over to 2006.
5. External actions
External actions
Implementation of commitments Implementation of payments Final
budget marked Ear-revenues
Overall Final
budget marked Ear-revenues
Overall
Implementation (million EUR) 5 411.2 104.9 5 516.1 4 878.0 135.1 5 013.1
Implementation (%) 99 51 97 93 63 92
Under-implementation (million EUR) 41.1 102.4 143.5 343.0 79.4 422.4 Carryover to 2006 (million EUR) 3.7 102.4 106.1 61.2 79.4 140.6
Pre-accession commitments
Implementation of commitment appropria-tions for this heading amounted to EUR 2.0 billion, from total available appropriations of EUR 2.2 billion, i.e. 89 %, compared with 94 % for 2004. Part of the unused appropria-tions of EUR 237 million concern earmarked revenues (EUR 110 million, as last year es-sentially from programme closure). The re-maining EUR 120 million relate to the can-celled financial assistance to the Turkish Cypriot community, as the legal basis could not be adopted.
Pre-accession payments
Based on initial forecasts of the implementing authorities of the beneficiary countries, a net amount of EUR 41 million was transferred to
this heading during the global transfer proce-dure. Payments amounting to EUR 3.0 billion were made, i.e. an implementation rate of 84 %, compared with EUR 3.1 billion or 95 % last year. Of the EUR 560 million remaining payment appropriations, EUR 18 million con-cern earmarked revenues (carried over com-pletely to 2006). The under-implementation of budget appropriations is spread across the heading (Sapard EUR 73 million, ISPA EUR 43 million, Phare EUR 312 million, Turkey EUR 75 million and the Turkish Cypriot com-munity EUR 27 million).
6. Administration (heading 5)
Administration Final budget Provisional implementation
Heading 5 (million EUR) 7 299.9 6 191.3
Implementation (%) 85
Under-implementation 1 108.6
Carryover to 2006 (million EUR) 775.9
Under-implementation after carryover (million EUR) 332.7
7. Pre-accession aid
Pre-accession aid
Implementation of commitments Implementation of payments Final
budget marked Ear-revenues
Overall Final
budget marked Ear-revenues
Overall
Implementation (million EUR) 1 955.3 39.1 1 994.4 2 896.3 88.4 2 984.7
Implementation (%) 94 81 94 84 81 84
Under-implementation (million EUR) 127.2 9.1 136.3 541.4 20.4 561.8 Carryover to 2006 (million EUR) 9.1 9.1 15.4 20.4 35.8
Introduction
Creating more growth and jobs is the number one priority of the European Commission headed by President José Manuel Barroso. But how can the EU’s budget of approximate-ly EUR 115 billion a year contribute towards this goal? This chapter aims to show how the Union’s budget is increasingly geared towards promoting employment, competitiveness and sustainable economic growth in the 25 mem-bers of the EU.
Why Europe needs more
growth and jobs
The European Union has a lot to be proud of in the economic sphere. A continent that was in ruins at the end of the Second World War 60 years ago has become one of the most de-veloped areas in the world. Partly due to the peace and stability the EU has helped anchor,
the 25 countries that form the Union make up the largest economy on the planet. The EU has created a single market that allows goods, people, capital and services to flow freely across borders. Twelve countries have scrapped their national monies and adopted the euro as their common currency. And Eu-rope is home to some of the most competitive and cutting edge companies in the world.
But the European Union is more than a com-mon market. It has a unique social model based on high education standards, generous welfare provisions and protective labour laws. And it has made more progress towards sus-tainable development than any other region in the world. Despite this progress, Europe has structural problems that threaten to undermine these advances.
The Lisbon strategy produced some signifi-cant achievements during its first five years. But a mid-term review in 2004 noted insuffi-cient progress in meeting growth and job tar-gets.
Fresh focus on enhancing
growth and creating jobs
With its policy paper entitled ‘Working to-gether for growth and jobs — A new start for the Lisbon strategy’, the Commission re-launched the initiative in February 2005. and the United States experiencing growth
rates almost twice the average of EU States, Europe risks being left behind in the global economy without deep-seated changes.
Low growth often goes hand in hand with high unemployment, a sickness that has af-flicted most EU countries during the 1990s and the first years of the 21st century. Euro-pean jobless rates, which have remained above 8 % for much of the last decade, are substantially higher than US or Japanese lev-els and youth unemployment in some coun-tries hovers around 20 %. Unemployment is not just a waste of human talent, it is a drain on scarce resources that could be better spent on education, training or social services.
The European Union’s growth and employ-ment woes are compounded by the fact that the continent’s population is rapidly ageing. Currently there are four people in work for every retired person, but by 2050 there will be only two. The Commission estimates that the impact of ageing populations will be to reduce the potential growth rate of the EU from just over 2 % to 1.25 % by 2040, cutting GDP per head by some 20 % below what could other-wise be expected.
Growth and jobs: work in
progress since 2000
It was against this backdrop that European Heads of State or Government met in the Por-tuguese capital Lisbon in March 2000 to com-mit themselves to making the European Union the most dynamic and competitive knowl-edge-based economy in the world, capable of sustainable economic growth with more and better jobs, greater social cohesion and re-spect for the environment.
‘Europe must rise to the challenge. We need to build on economic integration and turn the biggest economic and trade entity in the world into an area generating more growth and prosperi-ty. The evidence suggests that unless action is taken now the European economy will decline. Robust, coordi-nated and coherent action is needed to reverse this trend.’
Speech by Dalia Grybauskaitė, Com-missioner for Financial Programming and Budget, 4 December 2004
The targets set at the Lisbon summit:
an average of 3 % growth a year,
an extra 20 million jobs by 2010,
an overall employment rate of 70 % by 2010,
research and development spending exceeding 3 % a year,
The revised plan focuses like a laser beam on creating more growth and jobs and hands greater responsibility to Member States in at-taining these targets. It also sets two main EU-wide targets: achieving an employment rate of 70 % and an R & D investment level of 3 % of GDP by 2010.
In July 2005, the Commission tabled a more detailed set of measures to boost growth and create more jobs, while urging governments to concentrate on the following eight key measures with a high European added value.
1. Supporting knowledge and innovation in Europe
2. Reforming State aid policy
3. Improving and simplifying the regulatory framework in which business operates
4. Completing the internal market for ser-vices
5. Reaching an ambitious agreement in the Doha round of trade liberalisation talks
6. Removing remaining obstacles to physi-cal, labour and academic mobility
7. Developing a common approach to eco-nomic migration
8. Supporting efforts to deal with the social consequences of economic restructuring
At their spring summit in March 2005, EU leaders agreed to most of the targets proposed by the Commission. The Heads of State or Government also noted that the reforms agreed at Lisbon were beginning to bear fruit, with growth on the rise and 6 million new jobs expected to be created between 2005 and 2007, helping to reduce unemployment from a peak of 9 % at the end of 2004 by roughly 1 % in 2007.
The European Union budget
Contrary to popular belief, the European Union’s annual budget is tiny in com-parison with the revenues of EU govern-ments. For example, government expen-diture in Denmark is about 55 % of the country’s GDP, whereas the Union’s budget cannot exceed 1.24 % of the EU’s gross national income. This corre-sponds to a contribution of EUR 0.70 per day per European citizen, although it is actually less than this.
In 2005, the total amount of commit-ments entered into by the EU was al-most EUR 116 billion. However, as funding for many EU programmes is spread out over several years, the amount of actual payments made dur-ing 2005 was significantly less, to-talling just over EUR 105 billion.
In commitment terms, the budget for 2005 was split in the following way:
7 % 1 %
36 %
39 %
11 % 6 %
Growth and jobs: competitiveness and cohesion
Fostering rural development and protecting the environment Modernising agriculture and ensuring high food quality Citizenship, freedom, security and justice
The EU as a global partner
In December 2005, EU leaders reached an agreement on the Union’s budget for 2007–13. Under the deal, spending on agricul-ture and rural development will fall slightly over the seven-year period and expenditure on cohesion for growth and jobs will rise by al-most 3 % a year. But the big winners in the budget battle are funds to boost competitive-ness.
How the EU budget
contributes to growth
and jobs
In the past, EU budget lines contributed to specific objectives — such as helping poorer regions catch up, protecting the countryside, fighting poverty in developing countries — but lacked one overarching theme or cohesive goal. The Barroso Commission has attempted to shift funding towards meeting the European Union’s central aim of creating more jobs and growth.
Expenditure aimed at boosting competitive-ness has increased drastically in the 2005 and 2006 budgets and will continue to do so throughout the next seven-year financial per-spective. By 2013, annual funding on compet-itiveness for growth and employment will be over 64 % higher than in 2006. In the same year, the EU will be spending 20 % more than in 2006 on measures to encourage more growth and jobs in the Union’s less prosper-ous regions.
The European Union is not just spending more per year on budget headings that con-tribute to growth and employment; it is devot-ing a greater share of EU funds to meetdevot-ing the Lisbon objectives. At present about half of the projects financed by EU Structural Funds di-rectly contribute to the growth and jobs agen-da. In December 2005, EU leaders declared that in future 60 % of regional and structural funding and 75 % of competitiveness should be earmarked for ‘growth and jobs’ policies.
B
ES T PR AC TI CEComputer literacy for all
Public administrations and private companies are increasingly moving to-wards the use of IT to provide infor-mation and services to citizens and customers. But this trend risks margin-alising those citizens, particularly older people, who neither have access to computers nor the skills to use them.
In central Italy, the municipality of Pe-rugia has teamed up with vocational training centres to offer free courses in new technologies, foreign languages and other specialised fields for all adults over the age of 25.
Now in its third phase, the organisers have received 12 000 requests to par-ticipate and over 2 000 people — 40 % of them over the age of 50 — have at-tended courses. In addition to IT, par-ticipants can choose from courses in English, French and Spanish, entrepre-neurship, and health and safety in the home.
‘The courses are helping to meet a real need for training outside the formal ed-ucation system,’ says Anna Schippa, project coordinator with the associa-tion FORMA.Azione, which is helping to run the scheme. ‘Older people in particular come not only to learn new skills, but also to meet new people and to give a structure to their day.’
Promoting jobs and growth
through R & D
To be a genuinely competitive, knowledge-based economy, Europe must become better at producing knowledge. This requires increased investment in research and development, in particular in the field of information and com-munication technologies.
At present, the EU currently invests just below 2 % of its GDP in R & D — almost a third less than the United States. Of this, only 20 % is devoted to ICT research expenditure, compared with 30 % by Europe’s main com-petitors. The Lisbon strategy calls on EU Member States to invest 3 % of GDP in re-search and development by 2010.
At the European level, most R & D projects are funded by the framework programme for research and technological development. In 2005, EUR 3.5 billion was earmarked for R & D payments. In keeping with the growth and jobs strategy, the seventh framework pro-gramme (2007–13) will place an even stronger emphasis on research in fields which can help create more growth and jobs. For ex-ample, stimulating investment in information and communication technologies and the Eu-ropean space industry are important ways to ensure Europe remains a key actor in the global commercial marketplace.
ICT is a powerful driver for growth and inno-vation. It is a motor of change in public ser-vices, lowering costs and raising efficiency. It also supports industry and makes services bet-ter and more accessible to citizens. Of 900 ICT research projects part-funded by the EU, 30–40 % produced fully validated products, 20 % led to spin-offs, and a third influenced standards.
B
ES T PR AC TI CESmart moves in smartcards
Imagine how convenient it would be to pay bills, buy plane tickets and transfer money securely using your mobile phone. The technology breakthrough achieved by an EU-funded project on smartcard development now makes this possible on the new generation of mobiles.
Smartcards use tiny microprocessor chips embedded in them to hold and process data at phenomenal speeds. But in the past they have been too slow and unsafe for use in mobile phones. Before the breakthrough, which was achieved by a consortium of universi-ties, SMEs and leading service providers, a smartcard chip could only hold and transmit 424 Kb of data per second through a radio frequency in-terface. However, the 10 partners of the MEDEA+ project for advanced R & D in microelectronics succeeded in achieving 1.7 Mb of data per second on a smartcard chip. This is fast enough to perform transactions requir-ing high security when connected to the Internet through a wireless inter-face.