OF
SOUTHERN GLOBULAR CLUSTERS
J.W. Menzies
A thesis submitted for the degree of Doctor of Philosophy in the Australian National University ,
Canberra.,
The origin a l work report ed i n t h is t he sis is th a t of the c a ndid a te a lone e xcept for so me
observation a l ma teri a l supplied by ot h er worker s a s noted in the text & In p a rticul a r 9 Mr. J . V. Hindma n h a s kindly lent some 21cm observa tions of globular
clusters. Al l subsequent reductions and interp r et a tion of these d a ta h a ve been ma de by the c a ndidate .
r · am deeply grateful to Professor S.C . B . Gascoigne who introduced me to the problem of the globul a r clusters, and who has freely given up his ti~e for much helpful a dvice a nd for discussions on every aspect of my thesis work .
I wish to thank my father , Mr . C . J. Menzies, for
arranging the final printing of the finding charts included in this thesis. I also wish to thank Mr . V. Hunt of Mount Stromlo who carried out the intermediate photographic work for the finding charts and for most of the diagrams .
Miss Flora Ogston typed this thesis and assisted
generally with much helpful advice , and for this I offer her my sincere thanks.
Finally , the work on this thesis was undertaken with the support of an Australian National University Research
TABLE OF CONTENTS
Chapter 1. The Intrinsic Properties of Globular Clusters ••• 1 1.1 Introduction
1.2 RR Lyrae Variables
1o3
Spectra, Metal Abundance1o4
The Colour-Magnitude Diagrams1o5 The Synthesis
1.6
T~3Si3 o~tline1.7
Bibliography of Colour-Magnitude DiagramsChapter 2. Photographic and Photoelectric Photometry ••••• 22 2.1 Photographic Photometry
2fl2 Photoelectric Photometry
Chapter
3.
NGC 67233
0 1 The Colour-Magnitude DiagramJo2 The Colour-Magnitude Diagram
for the Bright for the Faint
3o3
The Composite Colour-Magnitude Diagram3.4
The Variable StarsChapter 4., NGC
104
4.1 Observations4.2
Two-Colour Diagram4.3
The Colour-Magnitude Diagram4.4
Comparison with Tifft4.,5
ConclusionChapter
So
NGC 3625o1 Introduction
5.2
Observations5.3
Colour-Magnitude and Two-Colour Diagrams5o4
Discussion••••• 37
Stars Stars
..•.. 94
Table of Contents - continued
Chapter
60
NGC 32016.1
Photoelectric Sequence6 ~2
P~otographic Photometry603
The Colour- Magnitude Diagram6" 4 nedc.ening
605
DiscusGionChapter
7.
- -~...,..:::: ... ,..
---
Integrated Colours of Globular Clusters7.1
The Observations7o2 Intrinsic Colours of Globular Clusters
7.3
The Dust to Gas Ratio784
Comparison with Published Resultsrr.,..., e1p+ e -r 8
v J .. 1. v -- c, Summary and Conclusions
--·- ··~ r::. __. ., . .__.,_ ...
801 Summary of Results 8.2 The Horizontal Branch
8 03
Future Work.t3ibli o graphy ..
-
_
... _. ,,..:__
,__
I
. . . 1
25
••••• 142
••••• 159
1 • CHAPTER 1
THE INTRINSIC PROPERTIES OF GLOBULAR CLUSTERS
1.1 Introduction
The globular clusters in the Galaxy are amongst its
oldest members , and are certainly the most easily recognisable representatives of this old group. Consequently , any
information we can gain concernihg the intrinsic properties of these clusters and of their individual stars will tell us something about conditions at an early epoch in the history of the Galaxy. The intrinsic properties of elobul~r clusters may be considered under two headings, viz. a) photometric
and spectroscopic properties, and b) kinematics and dynamics. We shall not be very much concerned with the second category here. Arp (1965b) has recently reviewed the kinematics and
distribution of globular cluste~s in relation to galactic structure, while Michie (1964) has discussed the dynamics of star clusters.
This thesis is mainly concerned with four southern globular clusters for which photoelectric and photographic photometry on the U , B,V system has been carried out. Al~o , we shall discuss the integrated U ,B,V colours for a large number of globular clusters, mostly in the south .
In this first chapter we shall consider the context within which the work for this thesis has been carried out. The history of the study of globular clusters consists mainly
-2.
and of attempts to explain these differences. Let us discuss now the results which are relevant to the present study of
the intrinsic properties of globular clusters. 1.2 RR ·Lyrae Variables
The first significant work on globular clusters was done by Bailey who discovered large numbers of RR Lyrae variables in some clusters. Other clusters searched were found to have no variables at all. Bailey classified the variables into
three groups, a, band Ce The a and b types have asymmetric
light curves with amplitudes of about 1~0 and 0~6, respectively. They are generally considered together as ab type variables.
Type c variables have nearly sinusoidal light curves, with m
amplitudes of about 0.5. Considering all the data then available, Oosterhoff (1939, 1944) was able to separate globular clusters into three groups on the basis of their RR Lyrae star populations. Clusters in the first group have no c type RR Lyrae variables at alle Those in the second
group have relatively few c type and relatively many ab type variables, the mean period of the latter being in the range
Approximately equal numbers of c type and of ab type variables, the latter having a mean period in the range 0~62 to 0~65, characteris Q +->. e clusters in the third group. Fur·ther work (van Agt and Oosterhoff, 1959) seems to confirm
this division and the occurrence to two discrete period groups, but the reason for i t is not yet known.
Sandage (1958; Kinman, 1959a) has suggested that the
J.
are related to their absolute magnitudes in the sense th a t the intrinsically brighter stars have longer mean periods. However, there are s t i l l considerable observation a l
di ff iculties which have prevented a ny decisions being ma de on this point ..
Schwarzschild
(1940)
found th at , in the colour-magnitude diagram of MJ, the RR Lyrae variables are confined to a narrow range of colour in the horizontal branch. He noted that no non-variable stars occur in this region and suggested that this "gap" in the horizontal branch represent s 2. region ofinstability and th a t any star appearing in i t must be a variable. The discovery that the variables in
M92
occupythe same colour region (Arp et al,
1953)
strengthened this suggestion.This has had important consequences for comparisons amongst globular cluster colour-magnitude diagramso It has become customary to fit the diagrams together at the RR Lyrae gap and to assume that all RR Lyr ae stars in globular clusters have the same absolute magnitudeo As mentioned above, this
may not be the case, and Sandage a nd Wallerstein
(1960)
have suggested th a t the a b s olute magnitudes of the variables may be dependent on the metal a bundance in the cluster stars.Sandage a nd Eggen
(1959;
Eggen and Sand age,1962)
showed that, when the colours of subdwarfs a re corre cted for lineblanketing, the subdwarf main sequence and the Hyades main sequence coincide Hase lgrove and Hoyle
(1959)
and Demarquesequence is close to the metal rich main sequence provided that, in the former case, helium is deficient also. Since globular cluster stars are weak lined like the subdwarfs, i t is reasonable to assume that, after correction for blanketing, the cluster main sequence should coincide with the Hyades
main sequence. It should thus be possible to determine the absolute magnitudes of the cluster RR Lyrae stars by means of a fit of the cluster main sequence to the Hyades main sequence.
From such a fitting technique, Sandage (1964) has recently found a mean absolute magnitude of +0~42 ±0~08 (m.e.) for
the RR Lyrae stars in four clusters, although for M1J he found M
V
m
-0.09. Arp (1962b) obtains systematically brighter magnitudes than this because he applies reddening corrections determined from a cosecant reddening law to his data.
Sandage's methods of correcting for reddening seem preferable, though. There are many uncertainties involved in the fitting procedure, in the blanketing and reddening corrections, and
in the observations of very faint main sequence stars. The absolute magnitudes of the RR Lyrae stars in clusters are
s t i l l uncertain and many more accurate observations down to
the main sequence in more clusters are necessary. 1.J ~ c t r a , Metal Abundance
In the course of an analysis of the radial velocities of globular clusters, Mayall (1946) found that the integrated
5.
that a small group of clusters in the region of the galactic nucleus have later spectral types than the average of the cluster system as a whole. Morgan (1956, 1959) confirmed Mayall's results and extended them by showing that globular clusters can be assigned to one of eight groups, depending on the strengths of the metal lines in their integrated spectra. Clusters in group I have extremely weak lined spectra while those in groups VI to VIII have relatively strong lined
spectra and are concentrated in the direction of the galactic nucleus.
,
Working on coude spectra of globular cluster giants, Deutsch suggested a division of the clusters into three groups, A, Band C$ Giants in group A clusters have
relatively strong metal lines in their spectra, those in group B clusters have spectra with intermediate metal line
strengths, and the spectra of giants in Group C clusters are extremely weak lined.
Kinman (1959b) extended this work and that of Mayall and of Morgan to some southern globular clusters, Using a
semi-quantitative method, he found that the ratio of metal to hydrogen abundance varies from less than 0.01 of its value in the Sun for giants in type C clusters to greater than 0.1 of the solar value for giants in type A clusters. This agrees well with the more detailed analysis carried out
by Helfer et al (1959) for giants in M1J and in M92 .
Hyades main sequence stars in the U-B, B-V diagram. She suggested that globular cluster dwarfs should exhibit the same effect, and indeed the first measurements (Johnson and Sandage,
1956)
confirmed this. The -ccurrence of anultra-violet excess in metal deficient stars is quite satisfactorily explained by the 'blanketing·' theory ( Sandage and Eggen,
1959;
Wildey et al,1962)&
For the Hyades stars of spectral types F and G, metallic absorption lines are strong and numerous in the ultraviolet and blue regions of the spectrum. Thecontinuum in these regions is depressed below the level i t would have in a line free star, the ultraviolet region being most affected, the yellow region only very l i t t l e affected.
Since the strong lined stars are used to derive the standard relation in the two colour diagram, the weak lined stars
appear to have an excess of ultraviolet radiation. After the spectroscopic abundance analysis of two subdwarfs by Chamberlain and Aller
(1951),
quantitative measures of the metal abundance in many other we ."''":. lined stars have been made, Wallerstein and Carlson(1960)
have calibrated the relation between ultraviolet excess and metal deficiency and this allows, in principle, the determination of metal abundances in globular cluster stars which are too faintfor high dispersion spectroscopy. Usually only the brighter stars in clusters are measured because of crowding problems and equipment limitations so that ultraviolet excesses are only derived for the giantso But the blanketing theory is only valid for dwarfs in the range
O~J
< (B-V) <0~7.
7 .
However , Eggen (Eggen and Sandage ,
1964)
has found emp iric ally from work on bina ries th at giants and dwarfs with the samemetal abundance have the s ame ultraviolet ex c ess , so that the giants can be used in the derivat ion of metal abundances in
globular clusters . Arp
(1959)
has noted that in the two - colour diagram the relations for metal rich stars of luQinosityclasses I and V intersect at (B- V) = 1~0 .
0 This is then a
luminosity insensitive reference point and ultraviolet
excesses derived at this point for globular cluster gi a nts
are presuma bly purely dependent on metal abundance . Sandage & Smith
(1966)
have found a good correl a tion between thisquantity and the Sandage - ~-lallerstein groups which we shall discuss later on .
1 . 4
The Colour- Ma gnitude DiagramsSh a pley ( 1 930 , p
. 25)
pioneered the work on globular clus ter colour- magnitude diagrams o He found the brightest st a rs tobe red giants and th a t fainter st a rs were progressively bluer down to the limit of his plates . This trend was just the
reverse of that found in most galactic clusters . Af ter Shapley ' s initial work , interest was sporadic and the very
a ccurate study of
M92
by Hachenberg(1939)
wa s l a rgely ign ored . Then Baade (1 944)
resolved the nucleus ofM3 1 ,
he ident i f ied the bright red stars he found ther e with the globular cluster g iants and introduced the concept of the two populations of(Population I) . However , no real progress was made until
1952 since only the brighter stars could be measured , work on the faint stars being prevented by technical difficulties .
The beginning of the modern era of the study of
globular cluster colour- magnitude diagrams came , largely
at the instigation of Baade , with the work on M92 (Arp et al , 1953; Baum , 1952) and on M3 (Sandage , 1953; Baum , 1952) by the Mount Wilson and Palomar group . Colour-magnitude diagrams were obtained down to the main sequence in both of these
clusters . The diagra~s are essentially similar, having a red giant branc h above a yellow subgiant branch which in turn joins on to a main sequence of relatively blue faint stars . About three magnitudes below the tip of the red
giant branch , a horizontal branch extends from the subgiant region to very blue colours . The representative points for the
RR
Lyrae variables lie in a narrow colour range, theRR
Lyrae "gap", midway along the horizontal branch . There are some differences between the two diagrams , however, mainly in the structure of the horizontal branch. This extends to bluer colours and has a higher population on the red side of theRR
Lyrae gap in M3 than in M92. Also, the giant branch at a given ab sol11.te magnitude is redder in M3 than in M92 . Spectra of individual stars in the twoclusters show that stars in M92 are much weaker lined than those with corresponding colours in M3 . Sandage (1953)
9.
the cluster stars . Fro~ these two colour-magnitude diagrams it was apparent that not all Population II clusters have the same characteristics .
To study the range in characteristics amongst globular clusters , Arp (1955) obtained colour-magnitude diagrams for five more . He found that the seven clusters could be divided into two groups. Clusters in group I have characteristics similar to those of
MJ
while the ones in group II are similar to M92 in many respects . Further , the group I clusters belong to Oosterhoff ' s (1939 , 1944) short period group , and clusters in group II belong to the long period group.Johnson and Sandage ( 1955) showed that the giants in Mp7 , an old metal rich galactic cluster , are fainter than those in
MJ ,
which have intermediate metal line strengths in their spectra . This raised the question of how much of the region between theMJ
and M67 giant branches in the colour - magnitude diagram is occupied by the globular cluster giant branches. Observations of some strong lined clusters were obviouslynecessary . However, these tend to occur in the nuclear region of the Galaxy or» at best , concentrated to the galactic disk .
The photometry of these objects is difficult due to the crowded nature of the field they occupy and to the much larger absorption suffered by the light from them compared with that undergone by the high latitude clusters .
1 . 5 The Synthesis
The first strong lined cluster to be observed was
---~
10.
as type VI by Morgan
(1959).
The division of globular clusters into halo and disc types by Sandage & Wallerstein and theirsubsequent discussion of the differences between the types was something of a landmark in the study of the systematics of
globular cluster colour-magnitude diagrams. It was suggested that the absolute magnitude of giants in globular clusters is directly dependent on the metal abundance. This effect had
been predicted by the theoretical work of Hoyle & Schwarzschild
(1955)
and of Kippenhahn et al(1958).
Further, the work onthis cluster allowed all the previously noted correlations or possible correlations to be combined in a systematic way.
The clusters for which accurate colour-magnitude diagrams were then available were divided into three groups on the basis of a parameter, 6V, defined as the height of the giant branch in magnitudes, measured at (B-V) =
1~4,
above the0
horizontal branch. This quantity is not affected by
uncertainties in the absolute magnitude scale for globular clusters, though i t does depend on the adopted reddening
for each cluster. Clusters with only slight metal deficiencies were found to have 6V ~ 2~1. They have horizontal branches populated predominantly by stars on the red side of the
RR Lyrae gap, and generally the number of RR Lyrae stars is small. Clusters with 6V
*
2~5
have intermediate metal deficiencies, fairly uniformly populated horizontal branches and generally a large number of RR Lyrae stars, mostly aand b types with a mean period of about
0~55.
Finally, m1 1 •
predominantly blue stars on the horizontal branch, and a mean period of about 0~65 for the R R Lyrae variables, the relative number of c-types being larger than in the short period g·roup .
There were a few exceptions . M13 and M22 have blue horizontal branches but fall into the second group on the basis of 6V., It was suggested that some other parameter,
such as age, may be affecting the correlations for these clusters. Some extragalactic systems were also found to be exceptional. The cluster studied by Burbidge & Sandage
(1958) 1 number
4
in Abell's catalogue (1955) of faint clusters found of Palomar Sky Survey prints, has a giant branchsimilar to that of M3, but its horizontal branch population is confined almost entirely to the red side of the
RR
Lyrae gap . NGC 121 in the SMC (Tifft , 1963a) has a similarcolour - magnitude diagram.
A number of other relatively metal rich globular clusters has now been observed, mostly to just below the horizontal
branch - 47 Tue (Wildey , 1961; Tifft , 1963b), NGC 6723
(Gascoigne and Ogston, 1963) , NGC 617 1 (Sandage and Katem , 1964) , and NGC 6712 ( Sandage and Smith , 1966) • All have a predominantly red horizontal branch and 6V is small , though there is some variation of these characteristics amongst them . Spectra of 47 Tue giants (Feast and Thackeray , 1960) show
branch of this cluster appears to be the f a intest of a ll such branches in globular clusterso S andage and Smith
(1966)
h a ve found a progression in colour of the giants at the level of the horizont a l branch in the sense th a t they a re redder in relatively metal rich clusters by about 0~2 than in extremely weak line d clusters . This can be explained satisfactorily onthe basis of differential blanketing d ue to the d ifferences in chemical composition amongst the cluster giants , together with differences in the position of giant sequences in the ~~ol ' log Te plane due to changes in radius as a function of metal a bundance (Hoyle and Schwar zs c hild ,
1955;
Kippenhahnet al ,
1958) .
In fact , the giant branches of globular clusters seem to be relatively well understood now .Figure
1.1,
taken from Sandage a nd Smith(1966) ,
summarises the systematics of globular c luster giant branches . Exceptfor NGC
67 12 ,
each cluster was f i tted to the Hyades mainsequence a nd its d istance nodulus derive d . All the horizontal branches were f ound to lie a t essenti a lly the same ab solute magnitude . The horizont a l branch of NGC
6712
was thenfitted to the mean of the o thers . The c o lour-magnitude diagrams for
M92 , M1J ,
NGC6712 , 47
Tue and NGC188
a re plotted i n the figure; re dden ing c o rrecti o ns, but not blanketing c o rrections h a ve been app li ed .The d ivision of globul a r clusters into three groups on the basis of their metal abundances and o f the
---,~
-2
0
M..,,o
+2
6
O·O
F,igure 1 . 1
M13 II-Ill
(VIII)
(B·V)0 ·8 1·2 1-6
Representation of the systematics of globular
cluster colour-magnitude diagrams (Smith &
Sandage, 1 966) .
given ~V group there ten d s to be a consi d er a ble v a riati o n in
the structure of the horizontal bran ch. EvidentlY, some o th e r
parameter besides metal abunda nce is o pera ting to pro duce
almost a continuum of horiz o ntal branch structures& An
important task of future work on colour-magnitud e diagrams
will be the explan a tion of this variatio n in the appearance
of globular cluster horizontal branches. There is als o as
yet no explanation of the incidence of variability in globul a r
clusters, but presumably it is determine d by the same factors
as is the horizontal branch population s
1. 6 Thesis Outline
The work undertaken for this thesis was conceived a s
possibly filling in some of the gaps in the framework discusse d
abo ve.
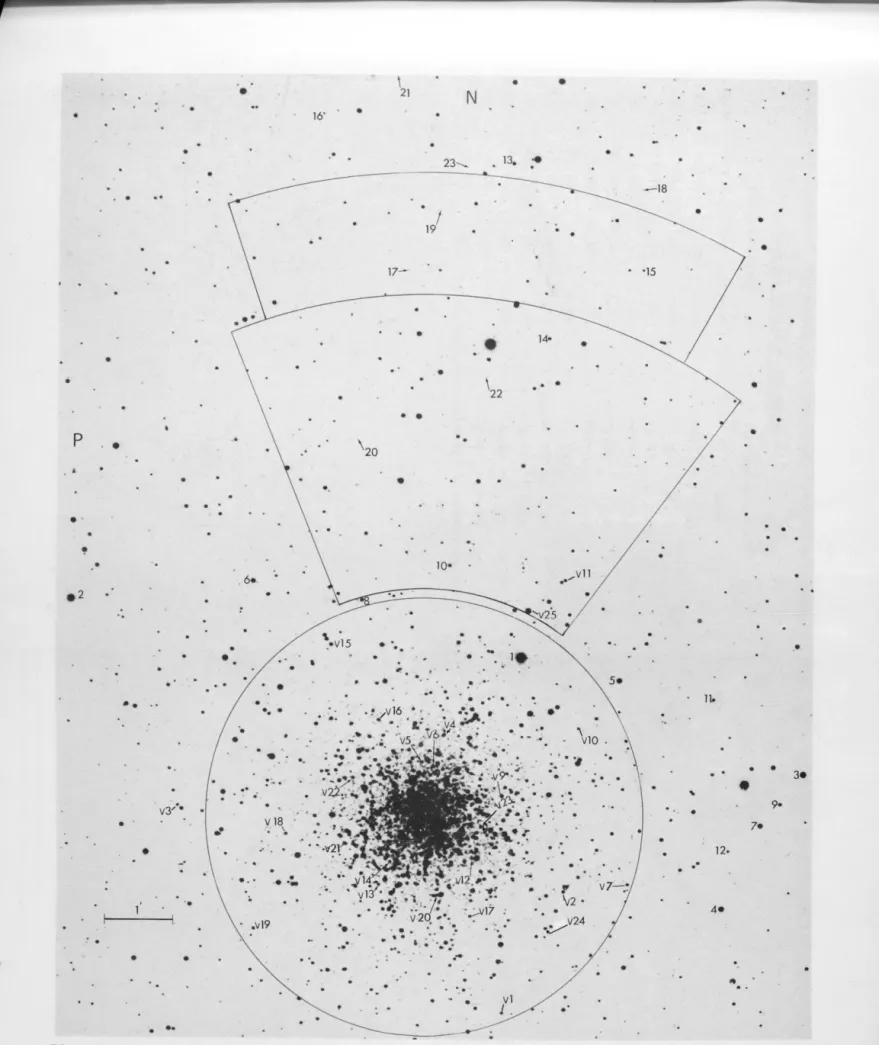
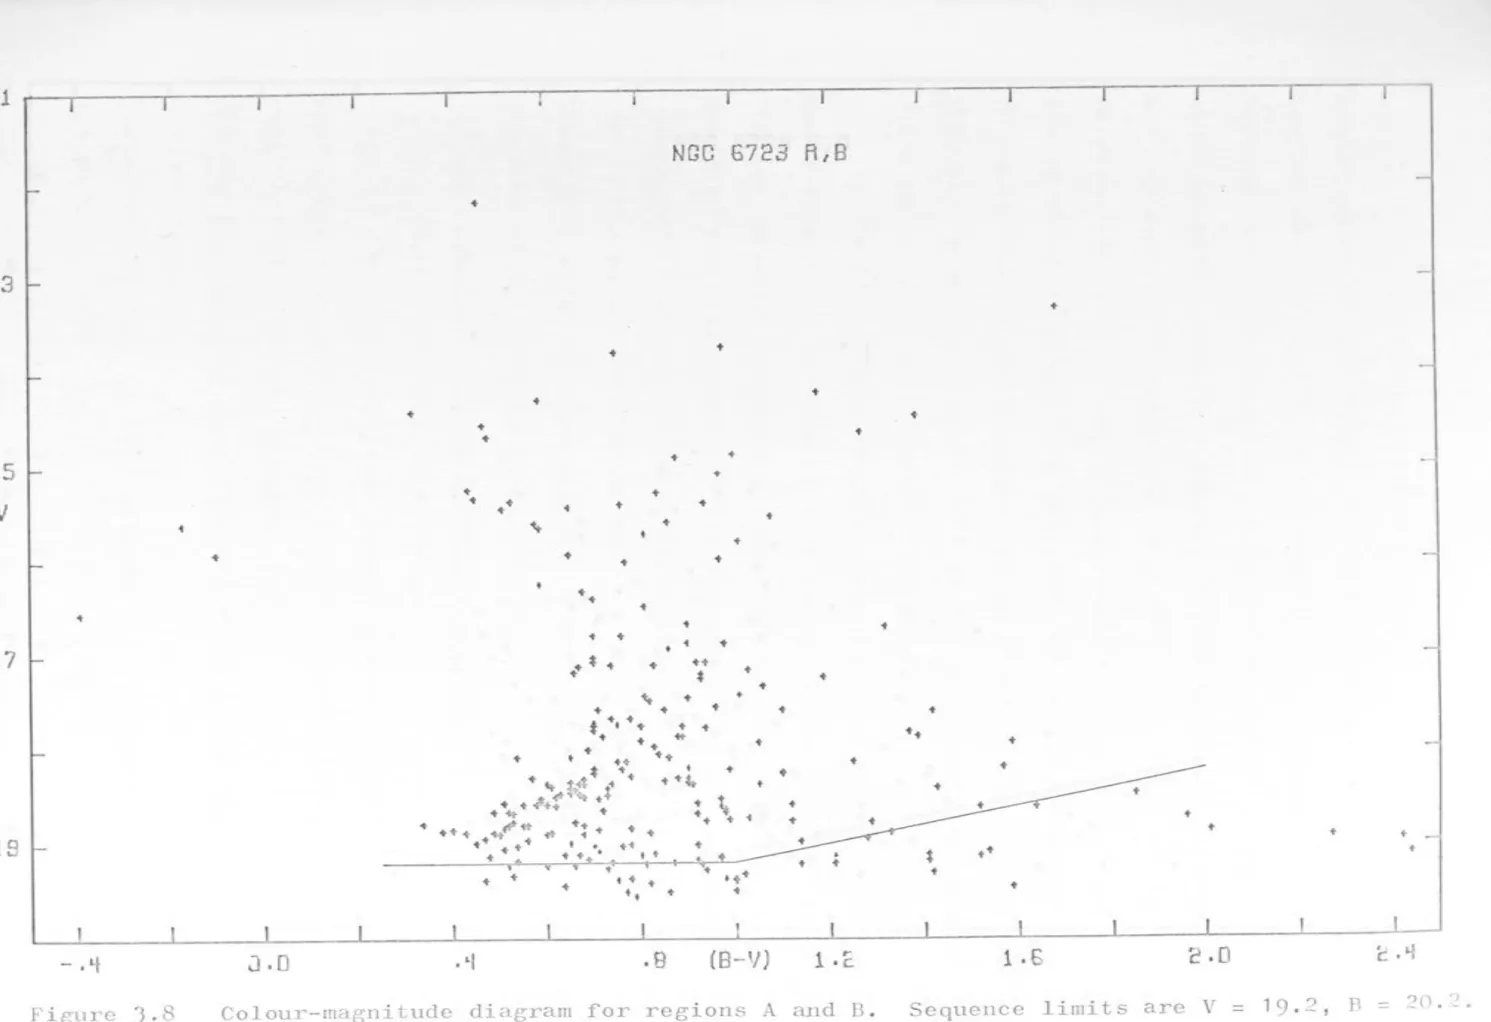
Gascoigne and Ogston (1963) showed NGC 6723 to be an
almost unreddened disc - type globular cluster. It is thus
the most accessible member of this group and it was decided
to extend the c o lour-magnitude d iagram to a s f a int magnitud es
as possible in an effort to calibrate out a ny age effects in
its colour-magnitude diagram . It h a s
24
RR Lyr a e vari a bles(5
discovere d by the author) and s o me of these were observe din an effort to le a rn something of the rel a tion between the
incidence of variability a nd met a l a bundance .
the subject of Ch a pter 3 .
This work is
47
Tue is obviously an important globul a r clusterbecause of its relatively high metal abundance. Pho t o electric
14.
in order to determine an accurate ultr a violet excess ,
8(U-B) , for the cluster~ The results nppear in Chapter
4 .
Close to 47 Tue and al so to the SMC , NGC 362 is wellsituatect for c omparative studies with these two objects . It
was observed for this reason and because the proximity o f the SMC makes it possible t o set an upper limit on the
reddening in front of NGC 362 , viz . the reddening in front
of the SMC stars in the background . discussed in Chapter
5 .
This cluster is
NGC 3201 is a relatively nearby cluster and is interesting
because it has the highest measured radial velocity of all the globular clusters . It was o bserved mainly to fill a gap in the author ' s observing program and is considered in
Chapter 6 .
Chapter 7 deals with the integrated
(u- B)
and (B- V)colours of a large number of globular clusters . This work was carried out with the intention of fin ding out if any
information on the intrinsic properties of globular clusters could be gained from the (U- B) colours .
In Chapter 2 we shall describe how the photographic photometry of the various clusters wa s c a rrie d out . Some photoelectric transfer wo rk has been done , which iB a lso discussed in this chapter .
The final chapter , Chapter 8 , consists of a d iscussi on of the structure of the horizontal branches of glob ular clusters .
by Sandage and Wildey
(1967).
1 . 7
Bibliography of Colour- Magn itude DiagramsDuring the course of work on this thesis it h a s been
necessary to make const an t reference to published
colour-magnitude diagrams of galactic globular clusters . A
bibliography of colour - magnitude d iagram s has been c ompiled
and is given at the end of this chapter (T ab le 1 . 1) . The
contents of the columns in the ·t ab le are as follows:
1. NGC number.
2 . Name of cluster ( M number , 6 number , etc . ) .
J .
Photometric system in which the work was done .UBV denotes the U , B , V system of Johnson and Morgan
( 1953 ).
PV denotes a combin a tion of a bluephotoeraphic magnitude (P) and a photovisual
magnitude
(v) ,
while P R d enotes a blue , redphotographic system . Not all PV systems are the
same and not all can be readily transformed to the
UBV system .
4 .
The limiting magnitude of the d iagr a m.5 .
An in d ication of whether ultr aviolet excesses we redetermined ; g , hb , and ms deno te ultraviolet excess
obtained for giants , for horizont al branch stars ,
and for main sequence stars, respectively .
6 .
A number indic at ing the rel e vant reference from thel i s t a t the en d of the table . Only work published
from
1952
onwards h~s been included in the main body16.
in the notes at the end of the table .
Bibliography of Globular Cluster Colour - Magnitude Diagrams
NGC Name System ml . 6 (u- B) a Reference
im
Galac tic Globular Clusters
104
47
Tue UBV14.6
1
UBV
18.5
2
4 147
UBV18 .3
g,hb J5024
M53
PV19
4
UBV
18.5
5
5139
w Cen PR15.8
6
UBV
19.5
7
UBV
16 . 3
8
5272
M3
PV19 . 3
9
PV
21 • 2
10
UBV
22
g,hb,ms1 1
5466
PV19
43
5904
MS
PV16 . 5
12
UBV
22
g , hb , ms13
6 17 1
UBV16 . 4
g , hb14
6205
M13
PV2J
15
PV
15 . 4
16
UBV
17 . 6
g , hb17
PV
18 . 3
18
UBV
21 • 5
ms19
625 4
i110
PV16
12
634 1
M92
PV18 .7
9
PV
19 .5
20
UBV
16 .2
g , hb21
6356
UBV19 . 2
22
6397
6366
P R16
23
UBV
18 . 1
g , hb,m s24
UBV
17
g , hb25
6522
UBV17
26
7
18.
Table 1.1
NGC Name System ml . 6 (U- B) Ref erence
im
6656 M22 PV 15 .5 28
6712 UBV 17 29
6723 t57J UBV 1 6 . 4 JO
6752 6295 UBV 16 JO
7078 M15 PV 17 12
7089 M2 PV 17 12
7 492 PV 17.5 31
Extragalactic Globular Clusters b,c
Pal
~}
UBV 22: J2Pal
Pal 1J UBV 21. 3 33
Intermediate-Ae;e Clusters d
752 UBV 14 ms J4
UBV 16 g , ms 35
2 158 UBV 19 g , ms 36
2477 UBV 16 g , ms 37
7789 UBV 16 . J g , rns
JS
Old Galactic Cluster s
188 UBV 1 9 " 5 g , ms 39
2682 M67 UBV 16 . 5 g,ms 40
UBV 16 g , ms 41
.._--- - -
---,-Notes to Table 1 . 1
a) See also:
Eggen , O . J . 1960 , The two - colour relation for horizon-tal branch stars in globular clusters , M. N.A.S . S . A.,
19, 115 •
..._..._. Arp , H. C .
metal
A . J . '
1958,
The absolute magnitudes , colors , and abundances of stars in globular clusters ,64, 441 .
,_.___
b) A summary and a l i s t of available colour-magnitude diagrams for gl obul a r c lusters in the Magellanic Clouds are given i n:
c)
Gas coi gne , S . C . B.
1966 ,
M.N . RAS , ...,..._,134 , 59 0
The colour - magnitude diagrams of two dwarf galaxies
(Draco and Sculptor) indicate that these systems may have a similar stellar content to that of the galactic globular clusters, at least as far as the brighter members are
co ncerned . However , there seem to be some an om a lous features i n the Sculptor colour- magnitude diagram which
are probably consequent upon the observation a l difficulties assoc i ated with the measurement of faint stars . For
details see:
Baade , W. & Swope, H.H . A . J • '
66, 348.
..._..._. (Draco) Hodge , P .. W.
ct)
See al so:19 65 ,
Ap .J.,14 2 , 1390.
(ScuJ_ptor)---Arp ,
H.
Intermediate - age star clusters,Ap . J. ,
ili,
66 .
Diagrams published before
1952,
mainly of historical interest:M15
Brown, A .1951 ,
Ap . J .,22)_ ,
344.
Johnson , H . L . & Schwarzschild , M. 19
51 ,
:~ i~~§}
Cuffey , J. Ap . J., ~ '49.
Greenstein , J . L .
1939,
Ap.J., 90 ,387 .
---Ap • J • '
630 .
---
133 ,
M4
M92
Hachenberg ,o.
1939 ,
Zs . f.Astrophys ., ~ '49 .
Shapley , H.
1930 ,
Star Clusters (New York ; McGraw-Hill Book Co . )For work in progress and for unpublished colour-~agnitude diagrams, see: Proceedings of CoITII!lission
37 ,
IAU Trans .,20 . References to Table 1.1
1 C
2 ..
J .
4 .
5 .
6 .
7 .
8 .9o
10. 11 • 1 2.1 J ..
1
4 .
1
5 .
1
6 .
17 . 18 . 19 .
20 . 21 •
22 .
2J . 24 .. 25 .
Wildey , R . L . Tifft , W. G.
1961 , 1963 ,
Ap . J ., 1JJ , 4JO .
---M: . N. RAS , 126 , 209 . ...,...._,..
Sandage , A . R . & Walker , M. F . 1955 , A. J .,
§9 ,
2JO . Cuffey , J . 1958, Ap . J ., ~ , 219 .
Cuffey , J . 1965, A. J .. , 70 , 732; 1966 ,
A . J ., 71 , 2 15.
,....__,...__
---Belserene , E ~P . 1956 , Contr . Rutherford Obs . Columbia Univ .
---
JJ ,
. 1 .Belserene , E . P . 1959, A . J .. , 64 , 58 .
---Woolley , R .v.d. _ . 1964, Roy . Obs . Bull .,
g ,
41 . Baum , W. A. 1952, A . J • ' 57 , 2220--Sandage , A . R . 195 3 , A . J •' 58 , 61 •
---Johnson , H. L . & Sandage , A . R . 1956,
Ap • J . ' 124, 379 . ...____ Arp , H . C C 1955, Ao J . , 60 ,
~ 317 .
Arp , H . 1962, Ap • J . '
ill,
J 11 •Sandage , A. & Katem , B. 1964, Ap . J .
1
---
1 39 , 1088.Baum , W. A. 1954, A . J . , 59 , 422 . _,..._
Brown , A • 1 9 5 5 , A p • J • , 1 2 2 , 1 4 6 •
---Arp , H. C. & Johnson , H. L . 1955, Ap . J ., 122 , 171 .
~ Savedoff , M. P . 1956 , A . J .,_
.§]_ ,
254.Baum, W. A., Hiltnery W. A., Johnson , H.L .
& Sandage , A . R .
Ap • J • , ]lQ_ , 7 4 9 •
Arp , H . C., Baum , W. A. & Sandage , A. R . 1953 , A. J ., 58, 4 .
---Sandage , A. & Walker , M. F . 1966 , Ap . J ., 14J, J1J .
...,._,,... Sandage, A . & Wallerstein , G. 1960,
Swope , H eH. & Greenbaum , I . 1952,
Ap.J.,
2-2.!_ ,
598 . A. J ., 57 ,---
BJ .Eggen , O. J . 1
9
60 , M. N . A . S . S . A . , 22_ , 1 15 •
Woolley , R . v . d . R .s Alexander , J . B., Mather , L . M. & Epps ,
E . A~ 19 6 1, Roy.O bs . Bull ., ~ -26 . Clube, S . V. M. 1965 , Roy .. Obs . Bull .,
22_ .
27 . Arp , H. 19 65 , Ap . J ., 141 , 4J .28 . 29 . JO .
...,..__,.. Arp , H. C . & Melbourne , W. G.
Sandage, A . & Smith , L . L .
1959, 1966 , Gascoigne , S . C .B. & Ogston , F . Ae
~ ' 64 .
A eJ ,, ~ ' 28 .
Re ferences - continued
J4e
JS ..
36 .
J7 .
JS .
39 .
40 .
4 1 C
42 .
4J.,
Cuffey , J .
1961,
M. N. RAS , ...,122 , J6J .
Burbidge , E . M. & Sandage, A.
1958,
Ap . J ., ~ ,527 .
Ciatti , F . , Rosina , L . & Sussi , M. G.1965 ,
As iagoContr . No o
85 .
---Johnson , H • L • 1
9 5 J ,
A p • J . , 1 17 , J 5 6
o---Eggen , O . J ~
1963 ,
Ap~J~ ,1J8 , J56 .
---Arp , H. & Cuffey , J .
1962 ,
Ap . J .,.2E s
51 .
Eggen, O. J . & Stoy , R .H .
1961 ,
Roy . Obs.Bull .,24 .
Burbidge , E . M. & Sandage , A .
1958 ,
Ap.J ., ...__.,..._..._128 , 174 •
1962,
ApoJ ., ...,.._.,.1J5, JJJ .
Sandage , A o
J ohns o n , H oL . & Sandage , A . R .
1955 ,
Ap • J • , 1 2 1 ,6
16 •
---Eggen , O eJ ~ & Sandage , A . R .
1964 ,
Ap , J ., ~ ,1JO .
Kinman , T . D.
1965 ,
Ap . J ., ---..,-....142 , 655 .
Cuffey s J .
19 61 ,
A,, J . ,6 6 , 7 1 •
---22. CHAPTER 2
PHOTOGRAPHIC AND PHOTOELECTRIC PHOTO:METRY
A considerable amount of photographic photometry has been done in the course of the work to be reported in this thesis , and it is convenient to consider at this time the procedures used~ Furthermore, photoelectric transfers were made to some Sma ll Magellanic Cloud (SMC) stars for use as
local standards for NGC 104 (47 Tue) and 362 , and to two stars near NGC 6723, all in the same observing run. We shall
describe these observations here and refer back to the results when necessary in l a ter chpaters .
2 . 1
a)
Photographic Photometry
Colour :=snn.t iQns : The 40 - inch telescope at Siding Spring Observatory was employed to obtain most of the plates measured for this thesis . This telescope is used at the
Cassegrain focus of f/8 , and its Ritchey - Chretien optics give a field of good definition of at least 40 min of arc in diameter with a scale of 2611/mrn .,
Under good conditions (good seeing , new mirror surface) , stars of V ~ 17m can be reached in about 10 minutes. The plate-filter combinations used with the 40-inch telescope for U,B ,V photographic
photometry are:
V: Eastman 103 a - D + 2mm Schott GG14* B: Eastman 103 a -O + 2mm Schott GG13
u~
Eastman 103a-0 + 2mm Schott UG2 .sensitive plate with 2mm Schoot GG11 be used to obtain V magnitudes on the U , B , V system~ Since then, manufacture of this type of filter has ceased, but it has been replaced by an equivalent filte~ , viz. GG 14.
Since the effective wavel engths of the bands defined by these combinations may differ from those of the U,B,V
system , some plates were tested for the presence of a colour equation between magnitudes on this system and
magnitudes derived photographically . The galactic cluster M67 is an ideal test object for this purpose since it
contains many stars in a small interval in V magnitude over a wide range of (B - V) colour. Accurate photoelectric
photometry has been carried out for these stars by Johnson and Sandage (1955) and by Eggen and Sandage (1964) .
blue (B) and two yellow
(v)
plates were obtained by Dr . Gascoigne who kindly lent them to the author forThree
measurement . Details of these plates are 0 iven in the following table (Table 2.1). No ultraviolet plates were available.
V: SJ70 SJ71
TABLE 2. 1 Plates Measured 10 minutes
10 minute s
B : s367 s368 s369
5 minutes 5 minutes 5 minutes
0
--..._---,.
24 . The plate s were measured by the author on the Sartorius Iris Photometer at Moun t Stromlo . Only stars in a one
magnitude interval were use~ and calibrat ion curves were obtained for each plate from plots of photoelectric
magnitude against iris reading for thes e stars. The deviations in magnitudes of each star from the mean curves were averaged over three plates f or B or over two plates for V a nd plott ed against the photoelectric (B-V) colour as shown in Figs . 2 . 1(a) and 2 .1 (b) . The residu a ls are measured in the s ense
(photoelectric - photographic). The least squares straight lines through the points a re given by :
LlB
-
B-
B pg = - 0 . 02(B-V) + 0 . 01 ••••• ( 1 ) ±0.02(s . e . ) ±0 .01 (s . e . )Ll V = V - V pg = o . o84(B - v)
-
0 . 06 • • • • • (2) ±0 • 0 3 ( s • e • ) ±0 . 02(s . e . )There is a significant colour equation in the V magnit udes , pg
but B is essentially on the U
1B ,V system . pg
The above process was repeated for the V measures , but this time with iris reading plotted against V as obtained
pg
from equa tion (2) . The devi a tions from the calibration curves for the two yellow plates were again averaged for
each star a nd plotted a gainst B- V. No further colour dependeuce was found and equation (2) was a dopted as final .
We may rewrite equation (2) as
V pg - V = -o.o84((B- V) - 0 . 71) .
• • • • • ( 3)
For a smal l magnitude interva \ we should expect the CTean
value of (v -
v)
to be zero , and hence the co nstant inside· 1
-+·
( b)
•
-+·
(C}
0
0
~ur.-- oo-- --o-- - - -- - -0-- - --0- - --0,0,.:)---~
·2
-v
1·0 1·2Figu re 2 . 1 : Residuals in the sense (pe - pg) plotted again~t
2 5. the brackets in equation (J) should be equal to the me a n
colour of the stars used to obtain this equation. The a ctu a l mean (B-V) colour of the stars measured in the present c a se is 0~66 , which agrees well with the above figure.
Some photographic photometry was also done on plates obtained at the Newtonian focus (f/5) of the 74-inch
telescope at Mount Stromlo . The scale of these plates is II
22 . 6/mm . Another set of filters of the same types as used with the 40-inch were employed here . Only one yellow plate and one ultraviolet plate of M67 , both taken by the author under poor seeing conditions , were available for measurement . A significant colour equation was found for the yellow plate and a fairly uncertain coefficient of 0 . 1 was derived . This was adopted and carefully checked when any 74 - inch plates were measured . Only a small number of stars was measured on the U plate , and Fig . 2 . 1(c) shows a plot of the residuals , 6U , in the sense (photoelectric - photographic) against B-V. There appears to be no colour equation . In the absence of any
other evidence , the 40 - inch photographic U magnitudes were also assumed to be on the U,B , V system. The a dopted
transformation equations from photographic magnitudes (vpg ' B , U ) to magnitudes on the U , B,V system are summarised
pg pg
in Table 2 . 2 .
TABLE 2 . 2
Photographic Transformation Equ a tions
Emulsion+ Filter 40-inch 74-inch
10Ja-D + GG14 V = V pg + 0 . 08 ( B-V) V = V + 0 . 10 ( B-V) pg
10Ja- 0 + GG1J B = B B = B
pg pg
10Ja-0 + UG2
u
=u
pgu
=u
Kinman (1965), using 10Ja-D + GG11 has found a similar
colour equation to those found here, though his is somewhat more marked, viz.
V = V pg + 0.155(B-V) + canst.
Johnson and Sandage (1955) found no colour equation for this same combination, and Arp (1965a)found non-linear corrections necess~ry, even for the blue magnitudes obtained with 10Ja-0 +
GG1J. It is evidently important to test for colour equations in any plate-filter combination used, especially if the
standard stars and the program stars have significantly different mean colours. Also, it is hardly necessary to
state that , whenever these equations are used, the magnitudes derived from them should be checked carefully to ensure that they are in fact on the U,B,V system.
b)
Plate Reductions: All photographic measurementsreported in this thesis were ~~de with the Sartorius Iris Diaphragm Photometer at Mount Stromlo Observatory. This instrument is similar to that described by, for example ,
Argue (1960), but has been modified to Make it semi-automatic in operation. A servo-motor attached to the iris diaphragm changes the iris diameter in such a way as to balance the intensities of the measuring and comparison beams. To make a measurement on a star, one centres its image in the iris and then shifts the plate carriage slightly in the X and Y directions until a maximum iris reading is found. An easily reproducible, objective result is obtained in this way.
The measuring procedure was standardised as follows;
'
27 .
1) The carriage wa s levelled, the e mulsio n focussed on the viewing screen and the iris focussed on to the e mulsion;
2) the background fog reading wa s r·o t a nd th e background checked for constancy across the pl a te;
J)
the photoelectric standards were the n me a sured ,followed by the program stars . The nor~ a l me a suring rate was about 1 10 stars per hour . The standa rds were remeasured every hour to check for drift in the photo - cell and a mplifier . Provided the instrument had been allowed sufficient time to reach thermal stability (about 45 minutes) , the sensitivity usually remained constant for periods of the order of
5
hours or more . Linear corrections were applied to the measur es of the program stars if any drift wa s detected.4) Calibrati o n curves were then drawn by eye in a plot
of the iris readings of the standards against their magnitudes which had been previously converted to the photographic syste m via the relevant colour equation from Table 2.2 . All of the
iris measures were punched on cards and process e d on the IBM
1620 computer at g aunt Stromlo with a reduction program due
originally to Prof. Gascoigne . The progra~ uses a second order interpolation formula . Each calibration curve is represented in the program by sixteen magnitudes re a d a t equal intervals in iris reading from the curveo Up to eight pl a tes , with an unlimited number of stars on each1 can b e process e d a t onc e .
the photographic magnitudes from all plates and the mean V and B- V are output on a punched card . These cards were then used with a program written by the author to produce a colour-magnitude diagram on the IBM
1627
curve plotter at MountStromlo ..
5) Finally , the residuals for the standards were plotted
against B- V to check that no colour equation remained .
2 . 2 Photoelectric Transfers
In photoelectric measurements of stars in globular
clusters , it is convenient to refer each night ' s observations to a few stars in or near the cluster . This removes the need for accurate dete r minations of the extinction coeffi c ients on each night . These secondary standards can then be
transferred to the U , B , V system on only the best nights . Such a procedur e has been fo l lowed in the observational programs on the clusters NGC
362 , 104 (47
Tue) and6723 .
The starsmeasured , and the clusters for which they have been used as se c ondar y standards are listed in Table
2 . 3
below .are identif i ed in the relevant chapters .
TABLE 2 .. 3
Local Standards
Star Cluster Star Cluster
SMC - p
362, 104
47
Tue -13
104
The stars
(Wesselink a; see Wildey ,
1961)
SMC - Q
362 , 104
NGC6723
-
16723
SMC - T
362
NGC6723 - 5
6723
29. The stars P , Q, T and E are only a small distance south of both NGC 362 and 47 Tue .
The 40-inch telescope at Siding Spring Observatory was
used on three nights , vizo 22 1 23 , 24/10/66, for the transfers.
A single channel photometer of the type described by Johnson
(1962, Fig . 8) was employed at the Cassegrain focus (f/18,
scale = 11
"/mm) ;
the cell was an RCA 1P 21 operated a t 800volts and cooled to dry ice temperature . The signals were recorded on a Brown strip chart recorder in parallel with a General Rad io d.c. amplifier, type 1230-A. The ampl ifier shunts were calibrated once during the run, a bright star being used as a constant current source for the coarse
shunts and a battery as a constant voltage source for the fine shunts . All measurements were made through 2n aperture
II
of 1 6 .5 diameter with the following filters:
V: 2 . 75mm Corning 3384
B: 2mm Schott GG13 + 1 mm Schott BG.12 U: 2mm S c hott UG2.
The time sequence of observations was generally y* , b* , u*
'
u , b , y , y* , b* , u* , where y* denotes an observation of the
star through the V filter , etc ., and y denotes an observation of the sky through the V filter , etc.
To obtain magnitudes , V, and colours , B- V and U-B, on the U , B , V systems the essential steps are as follows:
1 ) Measure the deflections , d , db ' d , corrected for
y u
log d , log d and log d were found directly.
y b u
2) Compute the magnitudes , y, band u, and the colours ,
b - y and u - b, on the natural syste~ of the 4O - inch , where
y =
s
2 . 5
log dy' etc .. y
and where
s
y' Sb and
s
u are the sensitivity constantscorresponding to the amplifier shunts used .
J)
Compute the extinction coefficients from the variationof u , b - y and u - b with sec z for the extinction stars , wh i ch
have been observed over a large range of zenith angle , z .
4 ) Obtain magnitudes and colours corrected for extinction
to outside the atmosphere as follows:
yo
=
y-
k y sec z(b - y) = (b - y)
-¾-y sec z 0
(u-b)
=
(u - b)-
k sec z ,0 u - b
where the extinction coefficients , k , k
y --b-y ' found in step
(J).
k b ' have been
u
-5) Use the known U , B, V magnitudes and colours for the
primary standards together with their natural u
0 , b0 , y0
magnitudes and colours to derive the transformation equations
between the two systems .
6)
Derive V , B- V and U-B for the program stars fromthese transformation equations .
7) Check that the final magnitudes and colours are on
the U, B , V system.
All of the stars in Table
2 . J
except NGC6723 - 5
weremeasured on the three nights together with stars from regions
31 • stars . The stars E8:11 (FO) and
EB:29
(KO) were used asextinction stars . The extinction coefficients obtained were as follows:
Date 22/10/66
1
~ (mag/sec z)0 . 24
y
23/10/66 0 . 17
24/10/66
0 . 18
k
b-y k
u-b
II
II
o . 100 - o . 04(b-y) o . 115-o . 04(b-y) o . 100 - o . 04(b-y)
0 0 0
0 . 3 1 0 . 33 0 . 31
The
EB ,
E9 and Johnson - Morgan stars were then used to obtain the transformation equations . The mean equations are given below , the range of variation of each constant being noted in brackets:B-V = 0 . 933 (± .. oo)(b-y) + or;1ss (± . 01) 0
U- B - 1 . oo (± . oo) (u - b) - 1 ~1
20 (± . 01) for (U-B) > 0~04
0
= 0 . 93 (± . 01) (u-b) - 11!121 (± . 02) for (U-B) < 01 ~04 0
V = Yo + 1~39 (22/10/66) yo + 1~30 (23/10/66) Yo + 11;'132 (24/10/6 6 )
No c ol our equation was found for the V magnitudes . The complex nature of the (U-B) transformation indicates that there is a significant difference between the co mbination of Schott UG2 + (1P21 attached to the 40-inch)and the original
combin a tion of Corning 9863 + (1P21 used to define the U
magnitud of the U , B, V system) (Johnson, 1955) . Such effects have been noted by other workers (e . g . Walker , 1964; Smak ,
program stars o However , for measurements on stars over a large range in U- B, a Corning
9863
filter is evidentlynecessary i f a linear transform at ion to th e U , B, V system is to be obtained . Of course, difficulties may als o be encountered eve n whe n this f i l t e r is used i f the cell i s other than an RCA 1P21 .
It was usually possible to decide , on the basis of i t s (B- V) colour , to which line a given star should be referred in the vicinity of U-B =
o?o4 ,
but this is obviously not a very satisfactory procedure . Table2.4
lists , in columns 2 to4,
the published values of V , B-V , and U- B for the E -region standards (Cousins and Stoy ,1961)
1963).
Johnson- Morgan standards (Johnson ,
and for the
Columns
5
to 8 co contain the observed magnitudes and colours an d the number of observations of e ach star . The mean errors for theobserved values are ±0,02 in each of V, B- V and U-B, as judged by the night to night diff e rences for each star.
The magnitudes and colours obt a i ned for the secondary standards a re listed in Table
2.5,
column s 2 to4.
All were observed on the three nights except for NGC6723 - 5 ,
whic h was observed only twice . The st ars Q, E and47
Tue - 13 were observed on three further n ights together with stars from33 .
TABLE
2 . 4
Ph o t o electr ic Standards
Star V B- V U- B V B- V
U- B n
EB
2
7 . 89
- 0 . 0J - 0 . 25
7 . 90
- 0 . 02
- 0 . 25
2
1
1
7 . 69
0 . 23
0 . 06
7 . 69
0 . 24
0.09
J
15
8 . 06
o .. 47
- 0 . 0 1
8 . 07
o . 47
0 . 0 1
2
16
8 .48
o . 44
- 0 . 07
8 . 49
o . 44
- 0 . 06
1
26
6 .54·
o. 88
0 . 58
6 . 53
o . BB
0 . 54
2
28
6 .57
1 • 22
1 • 22
6 . 56
1 . 24
1 • 22
1
29
6 . 93
1 . 01
0. 8 1
6 . 92
1. OJ
0 . 8 1
J
33
7 . 86
1 . 1 1
1 • 0 1
7 . 90
1 . 07
1 . 10
1
E9
1
8 . 0 5
0 . 05
0 . 04
8 . 06
0 . 06
0 . 09
J
8
8 . 2 J
0 . 37
- 0 . 02
8 . 22
0.36
o . o4
1
10
8 . 0 1
0 .3 7
- 0 . 06
8 . 11
0 . 38
- 0 . 06
1
19
8 . 50
o . 64
0 . 1 J
8 . 5 1
o . 64
0 .
lJ
J
20
8 . 4J
0. 89
0 . 53
8 . 43
0 . 91
0 . 53
2
JO
6 . 84
1 •1 J
1. 07
6 . 8J
1 •1
J
1 . 07
1
31
7 . 24
1 . 46
1 . 72
7 , 25
1 • 46
1 • 76
1
44
5 . 50
1. 3 2
1 . 42
5 . 49
1 . J4
1 • 43
1
56
8.,JJ
1 . 08
0 . 9 1
8 . J4
1 . 07
0 . 9 1
J
Johnson - Morgan
HD
184279
6 . 82
0 . 02
- 0 . 83
6 ..82
0 . 01
- 0 . 83
2
20630
4 . 82
o . 68
0 . 18
4 . 85
o . 66
0 . 19
1
2 164 94
5 . 8 1 - 0 . 08
- 0 . 32
5 . 82
- 0 . 07
- 0 . JO
2
35299
5 . 70
-0. 22
- 0 . 87
5 . 72
- 0 . 23
- 0 . 88
2
36395
7 . 97
1 . 47
1
021
7 . 97
1 • 41
1 . 1 4
1
TABLE
2o5
Photoelectric Transfers
Star V B- V U-B
SMC - Q
10065
1 • 20
1 . 2 1
p
10.32
0. 19
O. 14
T
10,,77
o ..
44
-0 .. 01
E
7 . 79
1 01 2
1 •OJ
47
Tue-
13
11 .. 92
1 • 60
10 84
NGC
6723
-
110042
Oo58
-0 .. 02
NGC
6723
-
5
13.,34
1 e48
1 •65
In Table
2,.6
we have assembled all the publishedphotometry for the SMC stars . Successive columns contain the results from different workers, the references being given below the table . The last column is taken from Table
2.5 .
The (B-V) colours from the present work agree well withthose in Table
2.6 .
There a re few (U-B) colours published, but , i f we ignore the results of Eggen & Sandage (column 2) which appear to be incorrect , our results agree reasonably well with them . However, the V magnitudes obtaine d here tend to be fainter than those in the rest of the table, especial ly in the case ofq .
It is difficult to find a re as on for thiseffect considering the small residuals obt ained for the E-region stars and the fact th at the observations of the
standards and of the program stars were made at effectively equal altitudese Also, altho ugh the program stars are in general somewhat fainter than the standards and were
. , _ ,
,
-TABLE 2 . 6
Comparison with Tublish e d Hesult c ( 1 ) (2) (J) (4) (5) (6)
SMC - Q
V 10.56 10.56 10.61 10.57 10.58 10.57 B-V 1.175 1 • 16 ( 1 • 22) 1. 20: 1 • 1 9 1 • 18
U- B 0.61
SMC - p
V 10.25 10.JO 10.27 10.29 10.28 10.29 B-V 0. 185 0. 16 (0.22) 0. 19 0. 18 0. 18
U-B -0. 10
SMC - T
V 1
o.
74 10.80 10.77 10.76 10.77 B-V o.hJJ o.405 (o.42) o.4J 0.39U-B -0.07
SMC - E
V 7.728 7.76 7.74
B-V 1 • 101 1 • 11 5 1 • 10
U-B 1.085 1. 05
References:
1 •
2 .•
J.
4.
Arp, H.C . Eggen , O .. J •
Cox, A .• N. &
Tifft, W.G .
1958, A. J •' 63, 118.
---& Sandage, A. R . 1960, M. N. RAS,
Hallam , K.L. 1953, Ap .J •, 11 8,
---1963, M.N.RAS, 125, 199.
-JS.
(7) (8)
10.60 10.65 1. 20 1. 20 1 • 1 J 1 • 2 1
10.32 10.32 0.20 0. 19 0. 12 0 .14
10.7 7 o.44 -0.01
7.81 7.79 1 • 12 1 • 12 1 .0 7 1.03
120,
---
79.314.
5. Cousins, A.W.J. , Lake , R . & Stoy, R . H. 1966 , Roy~Obs. Bull. 1 21 • 6 . Gascoigne, S.C.B. 1962, M.N .. RAS,
23.!±_,
201 ..from them , the calibra tion procedure noted abov e shoul d have eliminated any effects due to this difference . Sin ce, as noted above , the same results were obtained for the SMC
stars on several other nights , the magnitudes and colours listed in Table 2. 5 for these stars were adopted
anc.
usedthroughout this thesis .
The star
47
Tue - 1 J is also star a of Wesselink ' s sequence (Wildey, 1 961) • Wildey lists the magnitude andcolour of this star as V = 11 ~78, B-V = 1 • 0 .