UGANDA – EUROPEAN UNION
JOINT ANNUAL REPORT
UGANDA
2004
Government of Uganda European
Ministry of Finance Commission
List of Acronyms ...5
1. Executive summary...8
2. Update on the political, economic and social situation...9
2.1.Update of the political situation...9
2006 elections and political transition...9
The situation in Northern Uganda...9
Uganda and its neighbours...10
2.2. Update of the economic situation...10
[image:2.595.58.537.71.651.2]Overall Economic Performance...10
Table 1: Uganda, Selected Economic and Financial Indicators, 2002/03-2005/06...10
Fiscal policy...12
Execution of the 2003/04 Budget...12
Formulation of the 2004/5 Budget...12
Long Term Budget Priorities for PEAP implementation...13
Trade...13
2.3.Update of the social situation...15
Education...16
FY 2003/04 Budget Releases...16
Progress in Achieving Access and Equity...16
Quality, Relevance and Efficiency...17
Health...17
Sector Performance...17
HIV/AIDS...18
3. Development agenda of the partner country...18
4. Overview of past and ongoing co-operation ...22
Overview of 2004 committed and disbursed amounts (in €)...22
4.1. Focal sectors...23
4.1.1. Infrastructure and transport...23
a) Results...23
b) Progress in activities...24
c) Degree of integration of cross-cutting themes ...24
4.1.2.b Water and Sanitation...24
Progress in activities:...25
Degree of integration of cross-cutting themes ...25
4.1.2Support to PMA...26
a) Results...26
b) Effectiveness of implementation ...27
c) Cross cutting issues...27
4.1.3. Macro-economic support and economic reform...27
a) Results...27
b) Progress in activities...28
Economic Reform (Private sector development and regional integration)...28
Institutional and Administrative Reform – Capacity Building Support for Programme Management (8th EDF) ...29
Technical Cooperation Facility (9th EDF)...29
c) Degree of integration of cross-cutting themes ...29
. 4.2.Projects and programmes outside focal sectors...30
4.2.1 On-going 9th EDF projects in Governance and Human Rights:...30
4.2.2. Projects in the Health Sector (8th EDF)...30
Human Resources for Health (17 M€)...31
4.3. Utilisation of resources for non-State actors...31
4.4. Utilisation of B envelope...31
4.5.Other instruments...32
4.5.1. Stabex...32
4.5.2. Regional co-operation...32
Pan African Programme for the Control of Epizootic (PACE) (8th EDF) ...32
Farming in Tsetse Controlled Areas (FITCA) (8th EDF)...33
Regional Programme to Support Agricultural Research in East Africa (8th EDF) ...33
The Implementation of the Fisheries Management Plan (IFMP) for Lake Victoria (8th EDF) ...33
4.5.3. Community budget lines...34
4.5.4. European Investment Bank...34
Table: EIB activities in 2004...35
4.5.5. ECHO...35
5. Programming perspectives for the following years ...36
The 9th EDF Northern Uganda Rehabilitation Programme (20M€) ...36
6. Dialogue in country with the NAO and NSAs, and donor co-ordination ...37
6.1. Dialogue in country with the NAO and non-State actors...37
6.2. Donor coordination...37
7. Conclusions...38
Political situation...38
The economy...38
Meeting the MDG...39
Focal sectors and programmes...40
Perspectives for the future...41
Measures to improve performance...42
LIST OF ANNEXES...43
Annex I: Intervention framework including an overview of policy measures and indicators (updates)...44
Transport ...44
Rural development ...45
Macroeconomic support and economic reform ...47
Capacity building for good governance ...48
Capacity building for Non-State Actors...50
Annex II Indicative timetable for commitments...51
Commitment schedule...53
Disbursement schedule ...54
Annex III Updated chronogram of activities...55
Summary...57
STABEX 1999...58
Annex IV Donor matrix...59
Donor project support by sector 2003/04 outturns ($US million)...59
Donor project support by sector 2004/05 projections ($US million)...61
Annex IV bis Donor coordination fora...62
Annex V Summary financial situation...67
Summary table 8th EDF...67
Summary table 7th EDF...67
Annex V bis Ongoing NIP, Budget Line and Stabex funded activities...68
Annex VI Project sheets (separate files)...76
Annex VII Country Conflict Assessment...77
Annex VIII Migration profile ...79
Annex IX Country Environmental Profile – Uganda...81
Institutional Reforms...85
Multilateral and Regional Environmental Agreements...86
Annex X Key indicators and data...88
Economic Performance...88
Selected Economic and Financial Indicators, 2002/03-2005/06...88
Budget policy...88
Long-term expenditure framework, 2002-2014...89
LTEF Sector Shares, 2003/04 and 2013/14...89
Medium Term Budget Framework – Sectoral allocations (UGSh billions)...91
Budget and Releases by Sector, FY 2001-02/2003-04 (UGSh billions)...92
Socio-economic performance...93
List of Acronyms
ADB AFRICAN DEVELOPMENT BANK
ADF ALLIED DEMOCRATIC FORCES
AFDB AFRICAN DEVELOPMENT BANK
AIN AMNESTY INTERNATIONAL
ASARECA
THE ASSOCIATION FOR STRENGTHENING AGRICULTUREAL RESEARCH IN EASTERN AND CENTRAL AFRICA
BOU BANK OF UGANDA
BTVET BUSINESS & TECHNICAL VOCATIONAL EDUCATION AND TRAINING CGS THE GRANT CONTRACT FOR THE COMPETITIVE GRANT SYSTEM CIDA CANADIAN INTERNATIONAL DEVELOPMENT AGENCY
COMESA COMMON MARKET FOR EASTERN & SOUTHERN UGANDA
CRC CONSTITUTIONAL REVIEW COMMISSION
CSO CIVIL SOCIETY ORGANISATION
CSP COUNTRY STRATEGY PROGRAMME
CSSC CIVIL SOCIETY STEERING COMMITTEE
DANIDA DANISH INTERNATIONAL DEVELOPMENT AGENCY
DDGG DONOR DEMOCRACY AND GOVERNANCE GROUP
DFID DEPARTMENT FOR INTERNATIONAL DEVELOPMENT
DG NARC DONOR GROUP FOR NORTHERN UGANDA, AMNESTYAND RECOVERY FROM CONFLICT
DTG DONOR TECHNICAL GRUP
EAC EAST AFRICAN COMMUNITY
ECHO DIRECTORATE GENERAL FOR HUMANITARIAN AID
EDF EUROPEAN DEVELOPMENT FUND
EFA/MDG EDUCATION FOR ALL/MILLENIUM DEVELOPMENT GOALS
EIB EUROPEAN INVESTMENT BANK
EIDHR EUROPEAN INITIATIVE FOR DEMOCRACY AND HUMAN RIGHTS EMIS EDUCATION MANAGEMENT INFORMATION SYSTEM
ENR ENVIRONMENT AND NATURAL RESOURCES DONOR GROUP
EPA ECONOMIC PARTNERSHIP AGREEMENT
ESAPR EDUCATION SECTOR ANNUAL PERFORMANCE REPORT ESCC EDUCATION SECTOR CONSULTATIVE COMMITTEE
ESR EDUCATION SECTOR REVIEW
EU EUROPEAN UNION
FDC FORUM FOR DEMOCRATIC CHANGE
FITCA FARMING IN TSETSE CONTROLLED AREAS
GAP GROSS AGRICULTURAL PRODUCT
GOU GOVERNMENT OF UGANDA
GTZ GERMAN TECHNICAL COOPERATION
HDP HEALTH DEVELOPMENT PARTNERS GROUP
HPAC HEALTH POLICY ADVISORY COMMITTEE HSSP HEALTH SECTOR STRATEGIC PLAN
IDA INTERNATIONAL DEVELOPMENT ASSOCIATION IDPs INTERNAL DISPLACED PERSONS
IFAD INTERNATIONAL FUND FOR AGRICULTURAL DEVELOPMENT IFMP THE IMPLEMENTATION OF THE FISHERIES MANAGEMENT PLAN
IGG INSPECTORATE GENERAL OF GOVERNMENT
IITC INTER-INSTITUTIONAL TRADE COMMITTEE
IMF INTERNATIONAL MONETARY FUND
ISAMI INCOME SMOOTHING THROUGH AGRICULTURAL MARKETING INTERVENTIONS ITC IMPLEMENTATION TECHNICAL COMMITTEE
KFW GERMAN DEVELOPMENT BANK
LGFC LOCAL GOVERNMENT COMMISSION
LRA LORD RESISTANCE ARMY
LRRD LINKING RELIEF, REHABILITATION AND DEVELOPMENT
LTEF LONG TERM EXPENDITURE FRAMEWORK
LVFO LAKE VICTORIA FISHERIES ORGANISATION
MAAIF MINISTRY OF AGRICULTURE, ANIMAL INDUSTRY AND FISHERIES
MDG MILLENIUM DEVELOPMENT GOALS
MEI MINISTRY OF ETHICS AND INTEGRITY
MFF MICRO FINANCE FORUM
MIS MANAGEMENT INFORMATION SYSTEM
MOJ MINISTRY OF JUSTICE
MoLG MINISTRY OF LOCAL GOVERNMENT
MOWHC MINISTRY OF WORKS, HOUSING AND COMMUNICATION
MPs MEMBERS OF PARLIAMENT
MTCS MEDIUM TERM COMPETITIVENESS STRATEGY MTEF MEDIUM TERM EXPENDITUIRE FRAMEWORK MWLE MINISTRY OF WATER, LANDS AND ENVIRONMENT NAADS NATIONAL AGRICULTURAL ADVISORY SERVICES NARO NATIONAL AGRICULTURE RESEARCH ORGANISATION NARS NATIONAL AGRICULTURAL RESEARCH SYSTEM
NDF NATIONAL DEMOCRATIC FORUM
NDTPF NATIONAL DEVELOPMENT AND TRADE POLICY FORUM NEMA NATIONAL ENVIRONMENTAL MANAGEMENT AUTHORITY NEPAD NEW ECONOMIC PARTNERSHIP FOR AFRICA'S DEVELOPMENT
NFA NATIONAL FORESTRY AUTHORITY
NGO NON GOVERNMENTAL ORGANISATIONS
NIP NATIONAL INDICATIVE PROGRAMME
NRM NATIONAL RESISTANCE MOVEMENT
NRM-O NATIONAL RESISTANCE MOVEMENT ORGANISATION
NSA NON STATE ACTORS
NSDS NATIONAL SERVICE DELIVERY SURVEY O&M OPERATIONS AND MAINTENANCE OAG OFFICE OF THE AUDITOR GENERAL OPM OFFICE OF THE PRIME MINISTER
PABS POVERTY ALLEVIATION BUDGET SUPPORT PROGRAMME PACE PAN AFRICAN PROGRAMME FOR CONTROL OF EPIZOOTIC
PAF POVERTY ACTION PLAN
PAFO PARLIAMENTARY ADVOCACY FORUM PDE PROCURING AND DISPOSING ENTITIES PEAP POVERTY ERADICATION ACTION PLAN
PEARL PROGRAMME FOR ENHANCING ADOSCELENT REPRODUCTIVE LIFE
PER PUBLIC EXPENDITURE REVIEW
PMA PLAN FOR MODERNISATION OF AGRICULTURE
PMU PROGRAMME MANAGEMENT UNIT
PPDA PUBLIC PROCUREMENT AND DISPOSAL OF PUBLIC ASSETS AUTHORITY
PRA PEOPLE'S REDEMPTION ARMY
PRMP THE PROGRAMME REVIEW AND MONITORING PANEL PSFU PRIVATE SECTOR FOUNDATION UGANDA
PTC PRIMARY TEACHER COLLEGES
RAFU ROAD AUTHORITY FORMATION UNIT
ROM RESULTS ORIENTED MANAGEMENT
SIDA SWEDISH INTERNATIONAL DEVELOPMENT AGENCY
SUFFICE SUPPORT TO FEASIBLE FINANCIAL INSTITUTIONS AND CAPACITY BUILDING EFFORT
SWAP SECTOR-WIDE APPROACH
TASO THE AIDS SUPPORT ORGANISATION
TCF TECHNICAL COOPERATION FACILITY
TPD TAX POLICY DEPARTMENT
UBOS UGANDA BUREAU OF STATISTICS
UCDA UGANDA COFFEE DEVELOPMENT AUTHORITY UDHS UGANDA DEMOGRAPHIC AND HEALTH SURVEY
UG-STDP UGANDA SUSTAINABLE TOURISM DEVELOPMENT PROGRAMME UHRC UGANDA HUMAN RIGHTS COMMISSION
UMA UGANDA MANUFACTURERS ASSOCIATION
UNDP UNITED NATIONS DEVELOPMENT PROGRAMME UNICEF UNITED NATIONSS CHILDREN'S EDUCATION FUND
UPPAP UGANDA PARTICIPATORY POVERTY ASSESSMENT PROGRAMME UPTOP UGANDA PROGRAMME FOR TRADE OPPORTUNITIES AND POLIC
URA UGANDA REVENUE AUTHORITY
UWA UGANDA WILDLIFE AUTHORITY
WFP WORLD FOOD PROGRAMME
WH0 WORLD HEALTH ORGANISATION
WRS WAREHOUSE RECEIPT SYSTEMS
1. Executive summary
The political scene has been dominated by two themes during 2004: the preparations for the 2006 elections and particularly the debate over the lifting of presidential term limits, and the peace negotiations in Northern Uganda. Hopes of peace were high as the Government delegation and the LRA negotiation team agreed on the principle of a total ceasefire in December 2004. But the negotiations did not lead to a peace deal.
The economy grew at a rate of 6% in 2004, thanks to a recovery in the agricultural sector and a good performance of the service industry. This achievement is however partly offset by the continued high fertility rate. The macro-economic environment remained stable and exports grew by 20%. While fiscal performance was acceptable, supplementary spending was necessary to the rate of 0.9% of GDP to meet the shortfalls, mainly in the security and public administration votes. The budget formulation for 2004/5 met resistance from the development partners who argued that allocations were not sufficiently in line with PEAP priorities. Subsequent corrections were made to the budget.
Negotiations on the formation of a Customs Union between Kenya, Tanzania and Uganda were concluded in 2004. The creation of the EAC Customs Union is seen as an important step towards further economic and political integration. Negotiations for the creation of an EPA for the Eastern and Southern African sub-region were kicked off in February. Progress has however been slow. In the education sector, steady progress has been made towards meeting the Access, Equity, Quality, Efficiency and Education For All / Millennium Development Goals. The health sector has also registered another year of improved performance although the key critical areas like Human Resources, Reproductive Health, Sanitation, Community mobilization, drug management remain under funded. The very low rate of deliveries attended by a health professional is one of the critical areas where little progress is being made. HIV/AIDS prevalence stagnated at 6.2%
The process for the revision of the Poverty Eradication Action Plan (PEAP) was completed in November 2004, while the action and monitoring matrix for the PEAP remains a work in progress. The PEAP guides the development and budgetary agenda of the country, and is structured around five pillars: I. Economic Management, II. Production, competitiveness and incomes, III. Security, conflict resolution and disaster management, IV. Good governance and V. Human development. Government and donors are to further align activities with the PEAP. This, and the elimination of inefficiencies in the budget remains a challenge.
2. Update on the political, economic and social situation 2.1. Update of the political situation
2006 elections and political transition
The proposals for amendments to the Constitution are now being discussed in parliament. The modalities of the Constitutional review and the proposal to lift the presidential term limits stirred much debate in and outside Parliament.
Following Government’s roadmap of political transition, a number of political parties have registered. These include the NRMO, the FDC and the UPC, among others. This political roadmap to the 2006 elections was presented to the Parliament in June. Later in 2004, the long awaited Cabinet White Paper, containing the Government’s position on the recommendations of the Constitutional Review Commission (CRC), was also presented to Parliament. The Parliamentary and Legal Affairs Committee disagreed with the Cabinet paper on several issues, e.g. a proposal about giving the President the power to dissolve Parliament in case of a stalemate between the Legislature and the Executive, as well as the proposed Omnibus Bill that seeks to amend 119 articles of the Constitution through one single legislative act. The Committee concluded that it is feasible to amend the Constitution and to allow the President to run for another term without totally erasing the term limit. The MPs recommended an extension of the President’s eligibility for another five years as a way of stemming turmoil in the country. The Cabinet immediately reacted by declaring that a simple extension from two to three terms would be insufficient, a term lifting was necessary.
At the end of the year, Government revealed plans about open voting for the constitutional amendments in Parliament, particularly on the third term issue, something which the opposition interpreted as a way of intimidating opponents of the third term.
The situation in Northern Uganda
From the beginning of the year on, the supply of weapons to the Lord’s Resistance Army (LRA) from Sudan had virtually stopped. The Sudanese army even started attacking LRA camps in Southern Sudan. On the institutional side, the International Criminal Court decided to launch an official investigation against Kony and his major commanders for the atrocities they have committed and the Ugandan Parliament adopted a report, which asked the Government to reconsider its refusal of the Parliamentary resolution declaring Northern Uganda a disaster area. LRA attacks on civilians and refugee camps intensified in the first part of the year; in February alone 200 persons were killed in an attack in Lira. After summer, the situation gradually improved in most areas. Meanwhile, the army called for “a final hunt” to capture LRA leader, Joseph Kony, in co-operation with Sudanese military. They even allegedly succeeded in finding and attacking Kony’s camp but without capturing Kony himself. Mid-2004, two high ranking LRA commanders contacted a Ugandan newspaper and some MPs directly, indicating their willingness to start peace talks. The extension and application of the amnesty law to LRA-rebels persuaded several LRA senior commanders to surrender with their men, weapons, “wives” and children.
mediator in the attempted peace talks with the Government. Hopes of peace were high as the Government delegation and the LRA negotiating team agreed on the principle of a total ceasefire at the end of December 2004. Hostilities resumed on January 1st 2005, shortly after a memorandum of understanding was presented to the LRA for comments.
Uganda and its neighbours
Sudan: Peace progress in Southern Sudan has led to higher hopes for peace in Northern Uganda since the Lord’s Resistance Army (LRA) is no longer being supported by Sudan.
DR Congo: Relations between the two countries have improved slightly during 2004 but there is still alleged Ugandan military interference in DR Congo, which creates a quite fragile relationship. Efforts have been made to inform Ugandan armed groups hiding inside DR Congo that they are free to return to Uganda without facing trial due to the amnesty law. There have been negotiations about exchange of ambassadors between Uganda and DR Congo.
According to Government, several militia groups are operating in the border area with DR Congo and Rwanda. Most frequently mentioned is the People’s Redemption Army (PRA), which is allegedly planning to attack Uganda. However, so far no real proof of the group’s existence has been provided.
Somalia: Uganda wants to send peace-making troops to support the Government in its attempt to establish itself in Somalia.
Burundi: President Museveni is playing a leading and very positive role in the peace process in Burundi.
2.2. Update of the economic situation
Overall Economic Performance
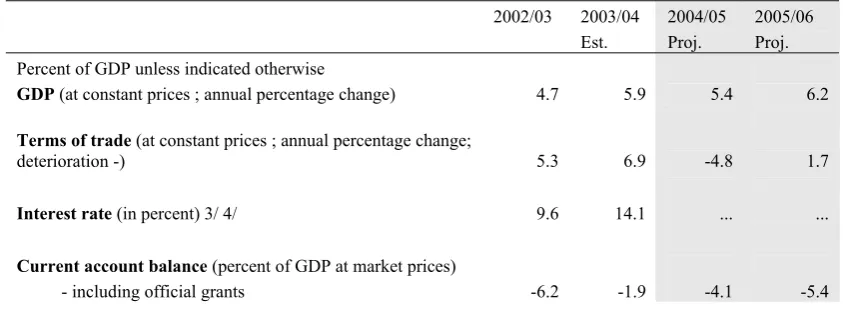
[image:10.595.86.508.610.769.2]After a relative slowdown in economic growth in the last years due to external shocks affecting terms of trade and slower agricultural growth, activity has been gathering pace again in 2003/04, with GDP growth rising to about 5.7%, thanks to a recovery in agricultural performance and a strong expansion of the telecommunication and construction sectors. The medium term outlook remains favourable, with projections of real GDP growth ranging between 5.5% and 6% per annum over the next two years financial years 2005/06 2006/07 (table 1).
Table 1: Uganda, Selected Economic and Financial Indicators, 2002/03-2005/06
2002/03 2003/04 2004/05 2005/06
Est. Proj. Proj.
Percent of GDP unless indicated otherwise
GDP (at constant prices ; annual percentage change) 4.7 5.9 5.4 6.2
Terms of trade (at constant prices ; annual percentage change;
deterioration -) 5.3 6.9 -4.8 1.7
Interest rate (in percent) 3/ 4/ 9.6 14.1 ... ...
Current account balance (percent of GDP at market prices)
- excluding official grants -13.4 -11.8 -12.2 -11.2
Government budget
Revenue 5/ 12.1 12.6 12.8 12.9
Grants 7 9.6 8 5.8
Total expenditure and net lending 23.4 23.9 22.8 21.4
Government balance (excluding grants) -11.3 -11.3 -10 -8.5
Government balance (including grants) -4.3 -1.7 -2 -2.7
Net donor inflows 10.8 11.5 9.6 8.7
Net present value of external debt (million dollars) 1,862 1,973 2,717 1,825
Net present value of external debt-to-export (in percent)5/ 262.5 242.5 224.5 216.6
Total external debt service (million dollars) 78 84 94 101
Foreign exchange reserves (in months of imports of goods
and non-factor services) 6.2 6.5 6.2 6.2
Sources: Ugandan authorities; and IMF staff estimates and projections, 2005
3/ The 2003/04 figure is provisional.
4/ Weighted annual average rate on 91-day treasury bills.
5/Ratios for 2002/03 and thereafter are based on CIRRs and exchange rates at end-June 2003.
This good performance was accomplished while keeping a stable macroeconomic environment, as evidenced by a low rate of inflation of 4.1% and healthy levels of foreign reserves which grew to more than 61/2 months of imports (table 1). The latter reflects stronger than expected donor and private inflows and a rebound in exports, which grew by 20% in 2003/04 to $928 million on account of improving terms of trade and on-going export diversification. (e.g., coffee now accounts for only 17% of exports, down from 25% in 2000/01).
It is recognised, however, that the country’s very significant rate of population growth (third fastest in the world) will require higher rates of GDP growth to be achieved for further poverty reduction to take place in the coming years. The table below shows clearly the impact of population growth on the GDP per capita performance.
Uganda and Sub-Sahara Africa
Average 1992/93-2001/02 Average 2002/03-2003/04
Uganda S.S. Africa Uganda S.S. Africa
Real GDP growth per capita
(market prices) 3.5 -0.1 1.8 1.1
Source: IMF
Uganda: foreign exchange and interest rates trends 2003-2004 1,550.00 1,600.00 1,650.00 1,700.00 1,750.00 1,800.00 1,850.00 1,900.00 1,950.00 2,000.00 2,050.00 Jul-0 3 Augus t Sept embe r Octob er Nove mbe r Decem ber Jan-0 4 Febr
uaryMarch April May June July Augu st Sept embe r Octo ber Nov embe r Dece mberJan-0
5 Febr uary 0.00% 5.00% 10.00% 15.00% 20.00% 25.00%
USh per US$ (left) 91 day Treasury Bill (right)
Fiscal policy
Execution of the 2003/04 Budget
Higher than expected aid receipts in 2003/04, accounting for 55% of actual expenditure against a budgeted share of 48% brought the overall fiscal balance (i.e., including grants) down to 1.9%. It is worth noting, however, that total donor inflows continue to fall short of undiscounted donor projections. The share of aid provided as budget support has fallen back from 57% to 50% in the past year, while the proportion provided as grants rose strongly to 74% compared to 57% in 2002/03.
Government expenditure for 2003/04 was equivalent to 23.4% of GDP, an increase of 0.5% compared to the outturn for 2002/03. It was driven by large increases in Security, Roads & works, Accountability, and Health votes (table 4). Social sectors share of total spending remained stable, with Education down from 25% to 21% and Health up three points at 13% of total spending.
While the fiscal deficit was consistent with budget targets, the composition of expenditure showed some deviations from budget intentions, as witnessed by supplementary spending of about 0.9 percent of GDP to meet security needs, cover shortfalls in salaries, and support State House. This resulted in reallocations from non-statutory items outside of the Poverty Action Fund (PAF), and the generation of new domestic arrears, estimated to amount to over 3% GDP in June 2004.
Formulation of the 2004/5 Budget
Discussions surrounding the adoption of the 2004/05 Budget proved more difficult than originally envisaged. Donors expressed concern over a proposed increase in allocations to security and public administration votes in defence spending, which came at the expense of a number of PEAP priorities, and initially refused to endorse the proposed budget. Following extensive consultation with all stakeholders, the authorities agreed to reduce the proposed increase in defence spending for 2004/05, and to identify additional cost savings in public administration.
notably in the area of Public Administration, will prevent the achievement of this objective, only allowing for the budget deficit to remain stable at 11.3% of GDP.
Further consolidation of the fiscal stance is nevertheless programmed in future, in line with the medium deficit target of 6.5% (by 2010) included in the long-term expenditure framework presented by MoFPED as part of the PEAP revision process (table 2). This is to be achieved by increasing the revenue-to-GDP ratio, particularly through improvements in the administrations revenue collection, while reducing the pace of public spending growth. In this regard, MoFPED has signalled its intention to integrate project aid into MTEF expenditure ceilings starting in fiscal year 2005/06 wit ha view to strengthening expenditure discipline, and to improve the selection and rationale of the budget priorities and allocations by sectors. In addition, and in order to improve liquidity management by Bank of Uganda, new project disbursements will be deposited directly to the government account in Bank of Uganda, in addition to a phased transfer of project accounts from commercial banks. These actions should limit the use of treasury bills for mopping-up liquidity and reduce upward pressure on the exchange rate.
Long Term Budget Priorities for PEAP implementation
Looking ahead, the revised PEAP clearly articulates GoU’s approach to budget prioritisation. The anticipated shifts in patterns of public spending (including all donor resources) in the next decade, derived from the Long Term Expenditure Framework (LTEF), confirm a relative shift towards the productive sectors (notably roads & works, up 105% in real terms), and agriculture (up 90%). Health also grows rapidly (up 100% in real terms), but education less so (up 75%) given its already high budget share and more obvious need to improve the management of existing resources. Security (up 55%) and public administration (up 20%) are two of the slowest growing sectors (Table 3).
Another salient feature in the Government approach to budget management relates to the increased influence of performance benchmarks related output, outcomes and value for money indicators in the formulation of budget priorities. The on-going implementation of the Output-Based Budgeting and Results Oriented Management initiatives will contribute to operationalisation of these concepts.
Trade
The major developments in Uganda’s trade policy in 2004 were mainly in regard to future relations with the EU and regional integration. Uganda participated actively in efforts to put the Doha Development Agenda back on track, through the G90, LDC and Africa Groups.
On trade, available data indicates that the deficit in trade in goods with all partners has been widening since 2000. The exception was with Europe, where Uganda had a surplus of approximately 11M€ in 2002. The overall trade deficit could be narrowed if Uganda exports more value-added products. The EU continues to be Uganda’s leading export market, with Netherlands (mainly flowers, fish), UK (coffee, tobacco, and tea), Belgium (fish) and Spain (coffee, fish) taking the larger share. COMESA is the second largest export market, notably Kenya, Rwanda and the DRC. Uganda’s biggest source of imports is COMESA (Kenya, Swaziland), Asia and the EU (mainly medicaments and machinery).
revenue losses and capacity constraints. The study recommended that Uganda’s emphasis with regard to EPA’s should be development, improved market access and addressing supply side constraints. On the market side, the study suggested that modifying the rules of origin and promoting joint venture partnerships with the EU. The study has no conclusive evidence of the impact of EPA’s on the economic welfare and points out the potential risks of reducing market share in agriculture, de-industrialisation and reduction in Government revenue. The study concludes that the long term benefits of negotiating an EPA outweigh the costs, but Uganda must address the supply side constraints and enhance export sector competitiveness.
Engagement with Non State Actors in matters of trade is sporadic and not well co-ordinated. The Inter-Institutional Trade Committee (IITC), a forum that brings together key stakeholders in trade, is in place. The structure, composition and mandate of the IITC was reviewed and approved in late 2003. Efforts are still underway to formalise the body as a Government entity with the responsibility of consultation, research and recommended positions on all trade policy issues. To facilitate preparatory work for the EPA, a National Development and Trade Policy Forum (NDTPF) has been established under the Ministry of Tourism, Trade and Industry. Its membership is drawn from the IITC. Representatives from the NDTPF participated in the 3 meetings of the Regional Negotiation Forum. However, the level of understanding of EPAs is still limited outside the MTTI. Because of this, the usefulness of the IITC as a consultative forum to backstop negotiators has been limited. A few private sector and civil society organisations have carried out sensitisation activities on the EPA’s, but these were largely stand-alone, and no clear strategy has emerged.
On the regional front, efforts in 2004 concentrated on finalising the Protocol for the East African Community Customs Union, which was signed in March. Although agreement had been reached in many areas during the 4 year negotiation period, the Common External Tariff was by far the most contentious issue. The new EAC band (0,10,20%) is an increase in applicable rates for intermediate and finished goods, which stood at 7% and 15%, respectively. In addition, some essential manufacturing inputs, though not raw materials, have been imported at the minimum rate. Manufacturers’ interest was to maintain this structure for a 5 year period under the EAC Customs Union. Uganda’s request is centred on a list of 138 tariff lines consisting of manufacturing inputs, many of which can also be used as finished products. These items were treated as raw materials (0%) in the Ugandan structure, but have moved to 10% or 25% in the EAC code. Paper products have the highest proportion of tariff lines (21%), followed by textiles (17%) and inputs to food processing (15%). Kenya and Tanzania objected to maintaining the 0% rate on these items, arguing that there exists sufficient supply capacity in the region, hence charging a 0% rate could be detrimental to the industry. Uganda’s contention was that the capacity in the region, where it exists, does not meet demand, and that the region’s suppliers were less favourable with regard to quality, delivery time and price.
2.3.Update of the social situation
Overall progress towards achieving the MDGs has been positive, particularly in the education sector, while the situation with regard to child mortality and maternal health care remains a reason for concern. Other MDGs that are likely to be met include the income poverty target and the hunger target, as well as the target for safe drinking water. The reduction of the HIV/AIDS prevalence has stagnated and preliminary new figures indicate no improvement in this trend. Meanwhile, both the education and health sector reviews had a positive outcome.
Key social indicators (including MDG indicators)
Millennium Development Goals
1990 1994 1997 2000 2003
Goal 1: Eradicate extreme poverty and hunger
Percentage share of income or consumption held by poorest 20% .. .. .. 5.9 .. Population below $1 a day (%) 87.7 .. 86.1 84.9 .. Population below minimum level of dietary energy consumption (%) .. .. 26.0 .. 19.0 Poverty gap ratio at $1 a day (incidence x depth of poverty) 52.7 .. 44.8 45.6 .. Poverty headcount, national (% of population) .. 55.0 44.0 .. .. Prevalence of underweight in children (under five years of age) 23.0 25.5 .. 23.0 ..
Goal 2: Achieve universal primary education
Net primary enrolment ratio (% of relevant age group) 52.7 .. .. .. .. Primary completion rate, total (% of relevant age group) .. .. .. 58.0 63.0 Proportion of pupils starting grade 1 who reach grade 5 .. .. .. 63.6 .. Youth literacy rate (% ages 15-24) 70.1 73.8 76.3 78.7 80.2 Goal 3: Promote gender equality and empower women
Proportion of seats held by women in national parliament (%) 12.0 .. 18.0 18.0 25.0 Ratio of girls to boys in primary and secondary education (%) 77.2 .. 89.0 94.4 96.3 Ratio of young literate females to males (% ages 15-24) 75.8 79.5 82.0 84.4 85.7 Share of women employed in the non-agricultural sector (%) 43.2 .. .. .. .. Goal 4: Reduce child mortality
Immunization, measles (% of children ages 12-23 months) 52.0 59.0 54.0 61.0 82.0 Infant mortality rate (per 1,000 live births) 93.0 92.0 .. 85.0 81.0 Under 5 mortality rate (per 1,000) 160.0 156.0 .. 145.0 140.0 Goal 5: Improve maternal health
Births attended by skilled health staff (% of total) 38.3 37.8 .. 39.0 .. Maternal mortality ratio (modelled estimate, per 100,000 live births) .. .. .. 880.0 .. Goal 6: Combat HIV/AIDS, malaria, and other diseases
Contraceptive prevalence rate (% of women ages 15-49) .. 14.8 .. 22.8 .. Incidence of tuberculosis (per 100,000 people) 159.2 302.9 318.4 339.2 411.2 Number of children orphaned by HIV/AIDS .. .. .. 910000.0 940000.0 Prevalence of HIV, total (% of population aged 15-49) .. .. .. 5.1 4.1 Tuberculosis cases detected under DOTS (%) .. .. 58.0 49.8 44.0
Goal 7: Ensure environmental sustainability
Access to an improved water source (% of population) 44.0 .. .. .. 56.0 Access to improved sanitation (% of population) 43.0 .. .. .. 41.0 Access to secure tenure (% of population) .. .. .. .. .. CO2 emissions (metric tons per capita) 0.0 0.0 0.1 0.1 .. Forest area (% of total land area) 25.9 .. .. 21.3 .. GDP per unit of energy use (2000 PPP $ per kg oil equivalent) .. .. .. .. .. Nationally protected areas (% of total land area) .. .. .. .. 24.6
Goal 8: Develop a global partnership for development
Other
Fertility rate, total (births per woman) 7.0 .. 6.6 .. 6.0 GNI per capita, Atlas method (current US$) 320.0 180.0 300.0 270.0 250.0 GNI, Atlas method (current US$) (billions) 5.6 3.6 6.5 6.3 6.2 Gross capital formation (% of GDP) 12.7 14.7 16.8 19.8 20.7 Life expectancy at birth, total (years) 46.8 .. 42.5 42.1 43.2 Literacy rate, adult total (% of people ages 15 and above) 56.1 60.7 63.9 67.0 68.9 Population, total (millions) 17.4 19.8 21.4 23.3 25.3 Trade (% of GDP) 26.6 27.8 34.2 34.4 38.7 Source: World Development Indicators database, April 2005
Note that some of these figures are not consistent with figures from the Annual Health Sector Performance Report, FY 2003/2004 and from the Health Sector Strategic Plan II Final Draft, March 2005. The figures from these reports are available in annex IX of the report.
Education
The first ever Education Sector Annual Performance Report (ESAPR) was submitted to the eleventh Education Sector Review (ESR) that took place in November 2004 as a key document. The ESAPR focuses particularly on quality aspects and covers the entire fiscal year.
FY 2003/04 Budget
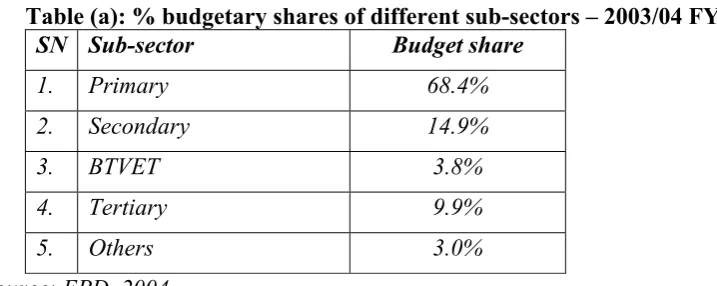
The total approved education recurrent budget constituted 31.3% of the total planned government discretionary recurrent budget. This stood at 0.3 percentage points higher than the recommended benchmark of 31% required as an undertaking. The share of the primary education budget to the total education budget was 68.4% in FY 2003/04, which translates into 3.4 percentage points higher than the conditional minimum of 65% required as an undertaking.
Table (a): % budgetary shares of different sub-sectors – 2003/04 FY
SN Sub-sector Budget share
1. Primary 68.4%
2. Secondary 14.9%
3. BTVET 3.8%
4. Tertiary 9.9%
5. Others 3.0%
Source: EPD, 2004
On the whole, the Education Sector Wage Bill translated into an increment of 10.5% in nominal terms.
FY 2003/04 Budget Releases
According to the provisional budget releases, (net of direct donor project funding) the Education Sector had a release performance of 97.61%. The wage bill had a 103.5% release performance while non-wage bill averaged 98.75%. The release performance for the total development budget (net of direct donor project funding) was 78.86% of the approved resource envelop.
[image:16.595.80.439.407.550.2]Various interventions were undertaken to augment access and promote equity within the sector:
• Actions at pre-primary and primary sub-sector included the affirmative measures geared towards stimulating the participation of the female pupils in formal education programs e.g. though the upgrading of school health and sanitation standards, the teaching of sexual maturation and reproduction health concerns etc.
• At post primary level these included the licensing of more private schools together with the increase in the number of government-aided secondary schools which served to broaden physical capacity at this level.
• At tertiary level, the 1.5 extra points for female entrants’ programmes such as the Makerere Female Students’ Carnegie Scholarships Program, continue to have an equalising effect on access.
• In the area of Teacher Education, the enrolment of female students in Core PTC's was enhanced through the construction of hostel facilities at e.g. Arua, Bishop Willis Iganga, Bishop Stuart, Kibingo and Nyondo Core PTCs.
Quality, Relevance and Efficiency
Most of the quality-efficiency revamping interventions that were undertaken for the primary sub-sector were directed towards ensuring greater provision of appropriate instructional materials, and furniture; increased construction of classrooms and latrines etc. The review of the Primary School Curriculum is on-going and a progress report is available. The post primary level also benefited from similar infrastructural and other qualitative improvements e.g. more secondary school teachers were also recruited and appointed. In BTVET institutions, infrastructural developments e.g. pit latrines, classrooms and workshops in various Technical Institutions were finalised and the size of the teaching workforce increased. The tertiary sub-sector too had some infrastructural improvements e.g. the rehabilitation and expansion of the libraries at Gulu and Mbarara Universities as well as the construction of new science and computer laboratories at Gulu and Kyambogo Universities.
The qualitative changes that were realised in the area of teacher education included the revision of the minimum entry requirements to PTCs to emphasize passes in science subjects; the construction of science laboratories to improve the teaching of Science etc.
It is therefore, evident from the foregoing narrative that the sector is making steady progress towards meeting the Access, Equity, Quality, Efficiency and EFA/MDGs.
Health
Sector Performance
The health sector has registered yet another year of improved performance although the key areas of concern like Human Resources, Reproductive Health, Sanitation, Community mobilization, drug management remain under funded. Many critical indicators continue to show positive trends, with targets of many of the 18 HSSP indicators being achieved. Deliveries in health facilities remain unacceptably low. .
The overall assessment of the performance of the sector is based on achievements against HSSP and PEAP indicators and agreed targets for the FY 2003/04. The analysis indicates that:
• The approved posts filled by trained health workers stands at 68% using HSSP norms excluding Nursing Assistants, and using HSSP minimum staffing norms is at 86%;
• The proportion of expecting mothers who deliver in government and PNFP health units has risen by 20% from 20.35 to 24%;
• The achieved DPT3/HepBHib coverage of 83% is close to the target of 85% expected at the end of HSSP.
The resource envelope available to the health sector (including donor funded projects) during the reporting period was UGSh 385.54 billion, which is equivalent to US$ 8.4 per capita. This still remains far below the Health Financing Strategy estimate of US$ 28 per capita per year (excluding Anti-Retroviral Therapy and pentavalent vaccine). The actual releases to the sector amounted to UGSh 361.25 billion (7.83 US$ per capita), constituting 94% budget performance. The overall resources available to the sector increased by 9.6% over the FY 2003/04. However, in real terms, there was only a marginal 3% increase taking into account the inflation and population growth factors.
The preparation of the second Health Sector Strategic Plan is nearing completion. The focus of the plan remains on how to make maximum contribution to the national PEAP and the MDGs.
HIV/AIDS
Notwithstanding the considerable efforts from Governments and donors through global initiatives to fight against HIV/AIDS, there remains an important funding gap to fight HIV/AIDS. A continued commitment is needed to meet these financial shortfalls. Uganda has been lauded for the concrete strategies that have been identified and investments that have been made in terms of human resources, capacity and information in response to the problem. The HIV/AIDS prevalence remained at 6.2%1, 0.8 point short of the target of 5.4%.
In order to combat HIV/AIDS, a combination of many HIV prevention approaches (like delayed initiation of sex, reduction in the number of sexual partners and correct and consistent condom use, behavioural change, safe blood assurance, etc.) have played an important role in reducing HIV transmission. A debate has however emerged over the emphasis on the first two pillars of the ABC policy (abstinence and be faithful) and the lesser attention to the provision of condoms as part of the strategy to fight HIV/AIDS.
On the one hand it is recognized that the A and B elements of ABC are extremely important and need revitalization, on the other if the focus is too limited to abstinence and faithfulness there is a risk that an isolated AB approach is not in line with the overall approach to fight HIV/AIDS.
3. Development agenda of the partner country
The revised PEAP was finalised and is structured around 5 pillars. The implementation of the PEAP is underpinned by continued attention to the macro-economic stability and the institutional reform agenda – progress against the latter has however been mixed. Progress towards reducing the weight of the public sector has been particularly slow. The Public Procurement and Disposal Authority was created in 2004, an important step towards the implementation of the Public Finance Management plan. Major components of the PEAP are implemented through SWAPS (in health,
1 Preliminary figures indicate that this figure may now have increased to 7% (2005), although this may be largely
education, water and sanitation). The war in Northern Uganda has hampered the equitable distribution of the achievements.
The overriding objective of Government policy is the reduction of poverty in Uganda. Uganda’s first national comprehensive strategy for fighting poverty, the Poverty Eradication Action Plan (PEAP) launched in 1997 and revised in 2000 and 2004, has continued to guide Government policy since then. The PEAP has been very influential in guiding the undertaking of sector-wide approaches to policy reform and investment programming, and improving the focus of Government’s three-year rolling Medium Term Expenditure Framework (MTEF) in the fight against poverty.
The PEAP has been revised for a second time in the light of progress obtained since 1997 in a highly participatory and consultative. The 2004 revised PEAP is structured around five overarching pillars namely: Economic management; Production, competitiveness and incomes; Security, conflict resolution and disaster management; Good governance; and Human development.
Since 1987, Government has implemented macro-economic and structural reforms aimed at restoring and maintaining macro-economic stability and improving Uganda’s economic, social and institutional infrastructure. The results have been encouraging and Government regards continued macro-economic stability as critical for the promotion of economic growth. Therefore, it will continue with existing policies aimed at achieving the following macro-economic targets: Real GDP growth rate of 7 percent per annum; Annual average underlying inflation of 5 percent or less; Foreign reserves of five months’ imports of goods and services or more; Strong private sector credit growth; Sustainable levels of external debt; and Competitive real exchange rate.
Macro-economic policy is being accompanied by a deepening of current institutional reforms in the public sector and in other key areas such as public utilities, transport infrastructure, the commercial justice system and the banking and financial system, which are aimed at removing key constraints to private sector growth. These reforms are set out in the Government’s Medium Term Competitiveness Strategy for the Private Sector - currently under implementation.
To improve service delivery by the public sector and encourage donors to adopt program funding as opposed to project funding, a number of cross-cutting issues have been targeted by Government. These are: Reforming public service management, including pay and pensions; Reforming the public procurement system; Strengthening financial management in the public service; Increasing transparency and civil society participation; and Implementing the Government Strategy and Plan of Action to Fight Corruption and Build Ethics and Integrity in Public Offices. Progress to date has however been mixed.
One area of concern to GOU and its Development partners has been the rapid growth in employment in the public service and wage-bill. In this regard, GoU commissioned two (2) studies on the Public Administration and a study on Cost Efficiency and Effectiveness of Human Resource Deployment in the Social Sectors. Based on the recommendations of the Public Administration studies GOU has agreed to maintain the Public Administration Sector expenditure ceiling at Ushs.246 billion (excluding Unconditional Grants to Local Governments and public service pensions).
Education, Agriculture, Water and Community Development. Lessons learnt will be applied to other Sectors. These measures include: review and rationalization of structures, development of policy guidelines to ensure targeted recruitment and deployment of staff, developing a comprehensive capacity building policy; and implementation of the Community development strategy and the social development strategic plan. These efforts are being supported with control measures related to payroll management, monitoring the staff numbers and payroll cleaning. Policy proposals have been submitted to Cabinet for consideration.
Improvement of pay for Public Service managers and professionals has been a key issue on the government agenda. In this regard, one of the key initiatives under the Public Service Reform programme (1997- 2002) was implementation of pay reform. In April 2002, Cabinet adopted the Pay Reform Strategy and to facilitate its implementation, Government has been providing Ushs.15.0 billion annually. In addition, the single spine salary structure was implemented in July 2003 in order to remove distortions inherent in the multi spine salary structure. But progress in the implementation of the pay reform strategy has been too slow to have the desired impact.
The revised PEAP recognizes that progress in pay reform is one of the key elements crucial to consolidating the capacity built, and sustaining and improving the performance of the public service in the delivery of services. However, Government also recognizes that pay reform must be complemented by other improvements in human resource management to achieve improved performance levels. Therefore the Public Service Reform Programme (2005 – 2009) is being updated and will focus on: institutionalising Results Oriented Management (ROM) as an integrated performance management system; more rapid progress in pay reform; Pensions reform; and anchoring coordination, and monitoring and evaluation mechanisms in the Public Service.
The coming in to force of the Public Procurement and Disposal of Public Assets Act 2003 in 21 February 2003 and the associated Regulations on 5 September 2003 paved way for the establishment of the Public Procurement and Disposal of Public Assets Authority (PPDA). The PPDA is responsible for monitoring and promoting compliance with the law through programmes of training, audit, inspections and the investigation of complaints. A Corporate Plan has been prepared setting out the objectives and main strategic goals that the Authority will endeavour to achieve over the next three years.
In order to assist Procuring and Disposing Entities (PDEs) to meet their requirements under the law, the Authority issued seven Guidelines in July 2003 on various subjects pertaining to the effective operation of the reformed public procurement system, including Codes of Ethical Conduct. A further six Guidelines have been prepared on the following subjects: Procurement and Disposal Guideline for Schools, Format for Standard Notices, Monthly Reports on Procurement and Disposal, Procedure for Use of the Authority’s Website by Procuring and Disposing Entities, Appointment of Members of Contacts Committees, and Third Party Procurement or Disposal Providers.
The Authority conducted a compliance assessment exercise on central government and statutory bodies’ PDEs between May and August 2004. Out of the 99 Entities assessed, 68% were found to be compliant to the extent of having in place both Contract Committees and Procurement and Disposal Units and a further 23% were partially compliant. Audits of 20% of procurements made by the Ministry of Education and Sports and the Ministry of Water, Lands and Environment have been completed. A further four audits, of the Ministry of Agriculture, Animal Industry and Fisheries, the Ministry of Health, Mulago Hospital and the National Medical Stores have been carried out and the reports are being finalised. An audit strategy is being developed. In addition, 11 Entities have been inspected on particular aspects of compliance and all reported cases of malpractice were investigated. The Authority is required under the Poverty Reduction Support Credit programme to publish reports of contracts awarded by PDEs exceeding US$200,000 or the equivalent in Ugandan shillings. Reports covering the periods April to December 2003 and January to June 2004 have been published.
A Training and Capacity Building Strategy was developed in 2004 and is being implemented. Seven training modules covering the main aspects of the reformed procurement system have been developed and training sessions have been conducted for Accounting Officers, members of Contracts Committees, staff of Procurement and Disposal Units and providers. To increase training capacity a programme has been initiated for training external training providers.
The main challenge for 2005 is to harmonize local governments’ procurement with the national standard. The Ministry of Local Government has prepared draft amendments to the Local Government Act that will provide the legal framework for the PPDA to extend its compliance monitoring, audit, inspection, complaints investigation and training programmes to local government PDEs. Regulations for implementing the national procurement system at the local government level have also been prepared in draft form.
Government has a major role to play in improving the quality of life of the poor through the provision of essential social services. Following the recommendations of the PEAP in 1997, Government has substantially increased the proportion of the total budget devoted to key poverty reducing services to 36 percent in 2002/03. The Eleventh education sector review held in November 2004, assessed performance against critical education sector indicators for the FY2003/2004, as agreed at the education sector review of November 2003 and confirmed satisfactory implementation of the undertakings. The agreed strategic direction for the health sector is currently set out in the Health Sector Strategic Plan (HSSP) for 2000/01 to 2004/05. The Joint Review Mission November 2004 noted with satisfaction that the progress observed in the first two years of the HSSP, had been maintained during the fourth year of the HSSP (Financial Year 2003/04) and performance has been satisfactory.
A strategy for ‘Water and Sanitation for Emergency Response’ was developed and implemented for selected IDP camps in the north during the first half 2004/05. The strategy focuses mainly on use of piped water supplies (powered deep boreholes, central reservoir tank, and a piped distribution network serving a number of tap stands). In urban water and sanitation, the Joint Sector Review by the Government and its Development Partners of September 2003 agreed on a number of Policy actions aimed at continuing and accelerating the implementation of the Urban Water Reform Process. As a first step, the Implementation Technical Committee (ITC) for the Reform was inaugurated on 29th January 2004. The MWLE is in the process of engaging a consultant to provide
a practical framework to enhance the provision of water and sewerage services in the urban centres. The Government has started with the preparation of a recovery programme for Northern Uganda and flexible budgetary principles have been proposed to facilitate the implementation of the budget priorities. The integration of activities for Northern Uganda in the sector budget ceilings remains only partially implemented and the consolidation of this exercise will inevitably affect other priority areas in the sectors.
Finally, Uganda continues to show above average population growth. With a figure of 3.4% Uganda has the third fastest growing population in the world. The continued provision of free education, health and other services to the population will be continued by accelerated economic growth and a matching performance in domestic revenue collection.
4. Overview of past and ongoing co-operation
Two major roads contracts were concluded in 2004. But the continued delay in meeting the preconditions to be able to conclude the financing decision for the Kampala-Mbarara road, has been a reason for concern and could, if not addressed, affect the EC’s commitment in the roads sector. The 4th Poverty Alleviation Budget Support Programme (PABS) was successfully concluded but not before major constraints with regard to the assessment for the disbursement of the final tranche were overcome. Particular attention has been given to the careful selection of indicators for the new PABS programme to avoid similar problems. Progress in the other sectors is broadly on track.
Overview of 2004 committed and disbursed amounts (in €)2
New projects3 New contracts Payments
EDF 40 834 177 141 347 689 91 191 190
STABEX 5 613 781 21 959 462
Budget Line funding (NGO)
10 970 4044 Information not available
ECHO 18 620 000
Global Fund 25 700 0005
EIB 35 000 000 Information not
available
2 Please note that these amounts cannot be cumulated as they are sometimes overlapping (e.g. some ECHO funding is
paid from the EDF, Stabex is EDF – but administered differently, …) Details at the project level can be found in the annexes. These amounts do not include some programmes administered from HQ.
3 For EDF: new global commitments; for STABEX: new Channelling Agreements
4 Please note that this figure represents the amount of EC funding for all ongoing projects during 2004 (not exclusively
newly approved projects)
Detailed information on progress in the project activities can be found in the attached project fact sheets.
4.1. Focal sectors
4.1.1. Infrastructure and transport
a) Results
The transport sector continued to grow at a strong pace. Traffic on the main roads notably in the vicinity of the main urban centres is exceeding the design capacity and delays in traffic are on the increase. Volumes transported by rail have exceeded the one million ton mark and the position of the rail transport in import - export traffic has slightly improved. Further improvement is expected from the joint concession of both Kenya and Uganda Railways to be tendered in 2005. Air freight grew as a result of increasing exports of fish, vegetables and horticultural produce, although the number of air freight operators decreased slightly.
Road transport remains the predominant mode of transport and generates considerable tax revenue through taxes on fuel and VAT on the services. Nevertheless and notwithstanding the continued donor inputs in the Road Sector Development Programme, there is no marked improvement of the condition of the road network as a whole. The continued shortfall of road maintenance funding has caused a considerable maintenance backlog, notably in respect of periodic maintenance of paved roads and re-graveling of the remainder of the network. As a result, the required annual budget has risen 20% from Financial Year 2002/03 to 2003/04 and a disproportionate part of the budget for maintenance of the main roads has to be spent on pothole repairs in the most trafficked main roads. Government organised a first Joint Transport Sector Review (JTSR), which took place on 12 and 13 May 2004 and was well attended by all stakeholders, including Members of Parliament and district politicians. The most important issue at the JTSR was road maintenance and its derelict financing in particular. During the JTSR the Ministry of Finance ordered immediate and full release of the 2003/04 budget for road maintenance and introduced substantially increased ceilings for maintenance in the MTEF. This will allow donor assistance in two important road management areas:
- Reduction of the backlog in periodic maintenance and - Introduction of new road maintenance models.
In terms of institutional reforms, there has been a prudent re-arrangement of responsibilities within the Ministry of Works, anticipating among others the recommended shift from forced account maintenance and road works to contract work. A stronger accent is being put on policy formulation, regulatory functions, road safety and law enforcement. However, there were major delays in putting in place the legislation required for the creation of the Uganda National Roads Authority and other semi-autonomous bodies foreseen as part of the current re-organisation. The slow pace of the institutional reforms in the transport Sector is becoming increasingly an obstacle to external financing of the sector.
b) Progress in activities
The tender procedures set into motion during 2003 have resulted in the conclusion of contracts for the Jinja - Bugiri Road (€ 39.5 million 8th EDF) and the Kampala Northern By-Pass (€ 41.5 million – 8th EDF). The performance period for these contracts started in February and May 2004 respectively. Tendering for works and supervision contracts for the rehabilitation of priority sections in the Kampala – Mbarara Road (9th EDF) remains on hold. The establishment of the Uganda National Roads Authority is one of the conditions of this financing and as mentioned above, this dossier has hardly moved during 2004. Progress of works for the Kagamba - Rukungiri Road (Stabex) in South West Uganda picked up during the second half of 2004 after major difficulties were overcome in respect pavement materials and land acquisition. However, it is unlikely that the delays incurred can be overcome.
The € 11.4 million District Roads Improvement Project Phase I (8th EDF) launched end of 2003 EDF saw a somewhat slow start due to the disappointingly slow procurement of a Technical Support Unit. The current programme covers 7 districts and has as an objective to improve 1,250 km and maintain 3,000 km of district roads. Further assistance to the improvement of the district roads network is proposed as part of a sector budget support intervention.
A study on the cost structure of construction and maintenance contract was completed and a tender was launched for a service contract to procure technical assistance to the Uganda National Roads Authority and its precursor RAFU. Furthermore a small study was tendered under the framework agreement for the identification, prioritisation and detailing of periodic maintenance interventions.
c) Degree of integration of cross-cutting themes
All supervision contracts for road projects now provide environmental specialists to ensure compliance with the national environmental legislation. New tender dossiers will have enhanced requirements in respect of the environment. HIV/AIDS awareness campaigns are put in place coordinated by the Makerere University Medical School for all works contracts under implementation.
4.1.2.b Water and Sanitation
The Water and Sanitation Sector is a priority area in Uganda’s Poverty Eradication Action Plan (PEAP). Improved water supply and better sanitation in both rural and urban areas are expected to contribute to a reduction of poverty in the country. Main target of government’s policies is to comply with MDGs for the sector.
Over 2004 both the Water Supply and Sanitation sub-sectors have shown good achievements, but a lot more has to be achieved to meet the MDGs. The GoU continues working on the Sector reform and updating the Sector Wide Approach to the existing planning and the SIP-15, the main long term guidance for rural water and sanitation sector 2000-2015.
More attention is needed in areas such as:
• The cohesion between the policies developed in the Ministry and their implementation through both Directorate for Water Development and the Districts is somehow weak and indefinite.
• The function of the Finance sub group and the O&M sub group is poor. It is observed that the planning of O&M is too ambitious.
• Concerning the PAF resources and expenditure projections the budget share for the district conditional grants is stagnant for FY 05/06. This does not follow the 2 main objectives of decentralisation and increasing investments in rural water supply and sanitation. In addition, it seems that still the donor support exceeds the national budget projection by almost 15%.
During September 2004, the annual Joint Sector Review took place and results show both relevant improvements and persisting weaknesses. The most important change for the better was found in the Sanitation sub-sector, one of the main negative areas of the 2003 JSR.
A Water Sector Development Partners Group is meeting monthly. Its meetings are prepared in two sub-groups, one on water supply and one on sanitation. Government representatives participate in the work of these sub-groups.
The 1st call for proposals in the framework of the ACP - EU Water Facility drew big interest by
both State and non-State actors and a substantial number of proposals from Uganda are expected. Government is coordinating the applications, which concern support to institutional strengthening of government and semi-autonomous entities and project support to beneficiaries ranging from government institutions to private enterprises and NGO. Award of funding to these proposals would result in a continuation of EU support to the water and sanitation sector, presently more or less phasing out due to the choice of earmarking Transport rather than Water and Sanitation as a focal sector.
An assessment is being undertaken in the framework of the preparation of the next CSP in order to determine whether the Water and Sanitation sector could qualify as a focal area in the next CSP.
Progress in activities:
The 2.68 million € Project of Gaba Water Works Refurbishment, Phase II (8th EDF) was provisionally accepted in June 2004, 3 months later than allowed under the contract. The completed works comply with the design expectations and notably the output of the clarification plant exceeds the projected volume.
The 18.75 million € Project of Mid Western Towns Water Supply (8th EDF) progressed well in the Water supply component. The Masindi Water supply works contract was provisionally accepted in September 2004 and the similar works contracts for Hoima and Mubende started. The final design on sanitation is expected the first quarter of 2005.
The small sanitation project in the Mengo - Kisenyi (Stabex) sections of Kampala progressed at a disappointingly slow pace.
Degree of integration of cross-cutting themes
4.1.2. Support to PMA
a) Results
The Plan for Modernisation of Agriculture (PMA) is a holistic, strategic framework for stimulating economic growth through multi-sectoral interventions in the rural areas, to enable people to improve their livelihoods through increasing agricultural incomes. The PMA was launched in 2000, and its implementation is at the heart of efforts to eradicate poverty.
Under the overall umbrella of the PMA, the PMA focal sector continued in 2004 to provide assistance to Agricultural Policy and Planning, the National Agricultural Advisory Services (NAADS), the National Agricultural Research System (NARS), PMA coordination. In conjunction with such programmes as expanding the outreach of micro-finance and improving agricultural marketing and processing services, the intervention is critical to the transformation of subsistence to commercial agricultural production. A PMA donor sub-group coordinates the various contributions of donors and the Government of Uganda to the PMA.
Critical results achieved with EU support during this reporting period are:
• Effective policy support to the Ministry of Agriculture, Animal Industries and Fisheries
• A functional PMA secretariat providing coordinating services, awareness and conceptual inputs to the PMA process
• A further roll-out of NAADS to 27 districts and 289 sub-counties
• A NARS bill, a core functional analysis of NARS, and a variety of guidelines for competitive research grants and the operations of the newly established Public Agricultural Research Institutes produced to support the reform process
• Four effective research programmes under NARO, as confirmed by an independent mid-term review
• A business plan and support programme for the Uganda Commodity Exchange and Warehouse Receipt System developed
• A support programme for niche coffee production by small scale farmers developed and started
• A Financing Proposal for Sector Budget Support to the PMA developed and passed by the EDF committee of November 2004.
Major other donors in the sector are the World Bank, African Development Bank, the Netherlands, Ireland, Denmark, FAO and IFAD. DFID, which was chairing the PMA donor sub group in 2004, provided support through general budget support.
b) Effectiveness of implementation
The EU contributions to the PMA both in terms of Technical Assistance and direct financial support (8th EDF) have largely been implemented according to schedule. The PMA SBSP (9th EDF) was passed as planned in the NIP. All other contributions, financed under Stabex were disbursed according to their respective work programmes and programme estimates. A mid-term evaluation of the Support to NARO Programme is highly positive, and a one-year extension to facilitate the transition into the new NARS is being considered. Evaluations of the overall PMA and the NAADS programme are scheduled for 2005.
c) Cross cutting issues
Cross cutting issues are built into the PMA implementation framework. In the NAADS programme, the EU financed a gender and poverty specialist. Critical questions, however, remains to what extent the productivity gains can be captured by vulnerable groups and how to ensure that their views are represented in the farmers’ fora and other bodies that decide on research and extension service priorities? Both the NAADS and NARS programmes are well aware of these issues, and they are being addressed - for instance by establishing composition criteria for decision-making bodies, and in their monitoring programmes, for instance by collecting gender-disaggregated data. Both NAADS and NARS have natural resources management components built in to their designs, while the NAADS programme is seeking to operationalise its recently-published Poverty and Gender Strategy.
4.1.3. Macro-economic support and economic reform
a) Results
While overall macro-economic performance has remained solid, with an increase in GDP growth compared to the previous fiscal year, there are indications that the poverty headcount increased from 34% to 38% over the 2000-2003 period.
Despite some difficulties in budgetary management in the past two years and disappointing performances on the revenue side, the macro-economic situation and the growth in economic activity have remained markedly encouraging in the Sub-Saharan African context. GDP growth is sustained by a healthy growth of the private sector and strong performance of the export sector. The growing gaps in the fiscal and trade balances, as well as the high - and still rising - public debt will nevertheless need to be monitored closely in the future, especially given the country’s vulnerability to exogenous/external shocks.
More broadly, recent evidence points to a positive influence of budget support in Uganda in, inter alia, the management of the budget process, the effectiveness of state institutions - notably with respect to social service delivery and the degree of public accountability, despite on-going concerns over corruption and public embezzlement.
Furthermore, there have been continued improvements in the performance of the education and health sectors as well as in the management of public finance.