Int. J. Electrochem. Sci., 10 (2015) 10565 - 10575
International Journal of
ELECTROCHEMICAL
SCIENCE
www.electrochemsci.org
Synthesis and Electrochemical Performance of
Fe
2(MoO
4)
3/RGO Nanocomposite Cathode Material for
Sodium-ion Batteries
VanTu Nguyen, YueLi Liu, Shah Abdul Hakim, Shuang Yang, Amr Rady Radwan, Wen Chen*
State Key Laboratory of Advanced Technology for Materials Synthesis and Processing, School of Material Science and Engineering, Wuhan University of Technology, Wuhan 430070, P. R. China
*
E-mail: chenw@whut.edu.cn
Received: 26July 2015 / Accepted: 22 October 2015 / Published: 4November 2015
Fe2(MoO4)3/reduced graphene oxide (RGO) nanocomposite was prepared by precipitation methods
and used as high rate cathode for sodium-ion battery. The Fe2(MoO4)3/RGO sample has the type
monoclinic structure, and the conductivity is increased with the presence of graphene. This sample displays the best electrochemical performance with large capacity, structure stability, high coulombic efficiency and stable cyclic. As the charge/discharge current density at 1.5 C, the initial specific capacity of Fe2(MoO4)3/RGO nanocomposite is 80.02 mAh g-1, and remains 75.92 mAh g-1 after 50
cycles.
Keywords: NASICON. Iron molybdate. Fe2(MoO4)3/RGO. Sodium ion battery. Cathode material
1. INTRODUCTION
Sodium-ion batteries (SIBs) are the most promising alternatives to lithium-ion batteries due to the low cost and abundance of sodium element in the earth. The chemical similarity of sodium ion toward lithium ion enables some electrode materials used in Li-ion batteries (LIBs) to be applied for SIBs. Special for the application in the large-scale energy storage, smart grid and solar/wind energy, and the problem of low-cost would be a big challenge [1-2].
In recent years, many cathode materials for sodium-ion battery have been reported such as NaxMO2 [3-7], Na3Fe2(PO4)3 [8], Na3V2(PO4)3 [9-11], Na2MPO4F [12-14], NaFePO4 [15, 16], V2O5
[17], NASICON compounds [18-22] and organic compounds [23, 24]. NASICON-Fe2(MoO4)3 has
Fe2(MoO4)3, which derives from the nature of two phase reactions and its low conductivity. In order to
overcome these limitations, a better method to design electrodes with change morphologies and nanostructures used in SIBs is proposed. The electrode materials with a variety of nanostructure or nanoarchitecture are appealing to increase the specific energy density and rate capacity due to their large surface area increasing the contact between electrode and electrolyte, short path lengths for both Na+ ion diffusion and electron transport, improved ionic and electronic conductivity and enhanced mechanical strength and structural integrity represent [28-30].
Graphene is a large monolayer sheet of sp2 bonded carbon, which has unique optical, electrical, mechanical, and electrochemical properties. The most important chemically derived graphene is graphene oxide (defined as single layer of graphite oxide). Reduced graphene oxide (RGO) has high aspect ratio and good electronic transport properties, which is expected to facilitate the kinetics of electrochemical reactions [31-33].In some applications, graphene has been used to form composite or hybrids as a highly conductive network in the fields of batteries [34-36]. Recently, electrode materials of sodium ion batteries based on graphene have been reported [13, 37].
In this paper, we applied wet chemistry to synthesis Fe2(MoO4)3/RGO nanocomposite. The
field emission scanning electrode microscope (FESEM) test shows that the Fe2(MoO4)3/RGO
nanocomposite formes an interpenetrating network structure. The X-ray diffraction (XRD) and X-ray photoelectron spectroscopy (XPS) analysis confirms that the Fe2(MoO4)3 shows monoclinic crystal
structure and mixture element states in the nanocomposite. The electrochemical properties of the Fe2(MoO4)3/RGO nanocomposite were studies by electrochemical impedance spectroscopy (EIS) and
galvanostatic charge-discharge measurement as a cathode material. The results indicate that Fe2(MoO4)3/RGO nanocomposite has high specific capacity and good cycling stability act as a cathode
material for SIBs. To the best of our knowledge, no reported is available on Fe2(MoO4)3/RGO
nanocomposite and their electrochemical performance as cathode material for sodium-ion batteries.
2. EXPERIMENTAL
2.1. Preparation of Fe2(MoO4)3/RGO nanocomposite
Graphene oxide (diameter of 50–100 nm, thickness of 0.8 nm, 80 % single layer ratio, 99 % purity, BET surface area of 500–600 m2 g-1) was purchased from Nanjing XF NANO Co. Ltd.
Fe2(MoO4)3/RGO nanocomposite was prepared by a precipitation method. The RGO content is
5, 8, 10 and 12 wt.% in the original synthesis process. The GO was dispersed in water under ultrasonic conditions for 10 hours, until to obtain a homogeneous yellow solution. Then (NH4)6Mo7O24·4H2O
was dissolved in solution with the GO and acidified by nitric acid, stoichiometric amount of Fe(NO3)3·9H2O solution was slowly added under continuous stirring with boiling 60 minutes. Then
2.2. Characterization
The crystalline structure of the sample was characterized by a powder X-ray diffraction spectrometer (XRD, PertrPro PANalytical, Nertherlands) equipped with Cu K radiation (1.5418 Å). The morphology of the sample was observed by the field emission scanning electron microscope (FESEM, JSM-6700F, JEOL, Tokyo, Japan). X-ray photoelectron spectroscopy (XPS) measurements were acquired using a VG Multilab 2000, with Al K the as the radiation source. All XPS spectra were corrected by the C1s line at 284.8 eV. The Brunauer-Emmett-Teller (BET) specific surface area of the powders was analyzed in a nitrogen adsorption-desorption apparatus(BET,TriStar II 3020,Micrometrics, American). Raman spectroscope equipped with a 633 nm laser (Raman; model Renishaw Invia, Britain) was employed to get the structural information.
2.3. Electrochemical measurements
The eletrochemical properties were investigated in CR2025 coin type cells with a metal sodium foil as the anode electrode. The electrolyte is 1 M NaClO4 in propylene carbonate (PC). The working
electrode was prepared by spreading the slurry of the active materials Fe2(MoO4)3/RGO
nanocomposite (80 wt.%), acetylene black (15 wt.%), and binder polytetrafluoroethylene (PTFE) (5 wt.%) on Ni gauze. The electrode was dried at 100 oC in vacuum for 10 hours prior to use. Polypropylene micro-porous film (Cellgard 2300) is used as a separator. The cells were assembled in an argon-filled glove box at room temperature. For galvanostatic charge-discharge test was carried out on a Land BT2000 battery test system (Wuhan, China) at ambient temperature. The specific capacities in this article were calculated based on the overall mass of the composite. The cyclic voltammetry (CV) and electrochemical impedance spectroscopy (EIS) were measured by Autolab Potentiostat (Potentiostat 30, Metrohm Autolab, Netherlands).
3. RESULTS AND DISCUSSION
3.1. Morphology and structure
X-ray diffraction (XRD) was used to confirm the phase of Fe2(MoO4)3 in the as-prepared
composites. XRD patterns of the samples are shown on Figure 1(a), it can be indicated that most of the peaks can be well indexed to the reflections of monoclinic structure of Fe2(MoO4)3 (JCPDS No.
01-072-0935) and the peak at 26.65o indicates the existence of the graphite from the reduced graphene oxide [13, 33]. But the diffraction peaks from the RGO do not clearly observe in the pattern due to their weak crystallinity and the overlap of the weak diffraction of the graphite at 2θ of 26.65 degree with that of Fe2(MoO4)3. XRD patterns of Fe2(MoO4)3/RGO composites were indexed with a
monoclinic lattice using the program Jade 6.5. The unit cell lattice parameters of all the experimental Fe2(MoO4)3/RGO phases are summarized in Table 1. It can be seen that, after modifying RGO, the
structure of monoclinic Fe2(MoO4)3 is not changed with the presence of RGO, and the refined unit cell
[image:4.596.85.515.125.318.2]lattice parameters of Fe2(MoO4)3/RGO nanocomposte is constant.
Figure 1. (a) XRD patterns of Fe2 (MoO4)3 powder and Fe2(MoO4)3/RGO nanocomposite (1)-JCPDS
01-72-0935; (2)-Fe2(MoO4)3 powder; (3)-RGO; (4)-Fe2(MoO4)3/RGO nanocomposite; (b)
[image:4.596.63.536.438.556.2]Raman spectrum of Fe2(MoO4)3/RGO nanocomposite.
Table 1. Refined unit cell lattice parameters for Fe2(MoO4)3/RGO nanocomposite cells with 0, 5, 8, 10
and 12 wt.% RGO contents.
RGO contents ( wt.%) a(Å) b (Å) c (Å) (o) V(Å3)
0.0 15.72664 9.19676 18.25146 125.5395 2148.04
5 15.72667 9.19678 18.25145 125.5396 2148.10
8 15.72665 9.19677 18.25148 125.5396 2148.05
10 15.72666 9.19679 18.25152 125.5398 2148.12
12 15.72668 9.19678 18.25148 125.5399 2148.11
The structure of the Fe2(MoO4)3/RGO nanocomposite is further characterized by Raman
spectroscopy. As shown in Fig. 1b, the peaks at 984, 815 refer to M=O stretch (Ag, υs), M=O stretch
(Ag, υas), respectively. The peaks at 1587.8 and 1345 cm−1 correspond to G band (E2g symmetry,
in-plane bond-stretching motion of pairs of sp2 C atoms) and D band (defect-related) of graphene sheet [38, 39]. The characteristic peaks of Fe2(MoO4)3 particles and RGO appear at the same time,
suggesting the formation of the Fe2(MoO4)3 /RGO nanocomposite.
Figure 2 presents the FESEM images of Fe2(MoO4)3/RGO nanocomposite, which the particles
are micrometer-sized porous spheres. It can be seen that Fe2(MoO4)3 particles and RGO buid a uniform
and homogeneous macro-morphology (Figure 2(a)). The Brunauer-Emmett-Teller (BET) specific surface area of Fe2(MoO4)3/RGO and Fe2(MoO4)3 powder have been estimated to be 21.59 m2 g-1 and
1.63 m2 g-1, respectively. The Fe2(MoO4)3/RGO nanostructure can provide a huge active surface areas
500 1000 1500 2000
Raman Shift (cm-1)
Intensi
ty (
a.u)
1587.8 1345
984
815
(b)
10 20 30 40 50
(a)
Intensity(
a.u)
RGO
Fe2(MoO4)3/RGO nanocomposite
JCPDS 01-72-0935
Fe2(MoO4)3- powder
2()
and structure stability, which means a large electrochemical reaction points and reaction stability, as well as high specific capacity and stabe cycle for the electrode of SIBs. Na+ ions may be easily diffuse into and out of the Fe2(MoO4)3/RGO due to their periodic and porous structure at the nanometer scale.
Na+ ions can easily diffuse into and out of the Fe2(MoO4)3/RGO due to their periodic and
porous structures at the nanometer scale. The inter-connecting RGO provides fast transport pathways for electron, which provides effective transport between the individual Fe2(MoO4)3 particles. Thus, the
nanocomposite materials are expected to significantly enhance the batteries performance by improving Na+ ion and electron transport. Also, the surface roughness of Fe2(MoO4)3 nanoparticles provides more
interface area between Fe2(MoO4)3 and electrolyte.
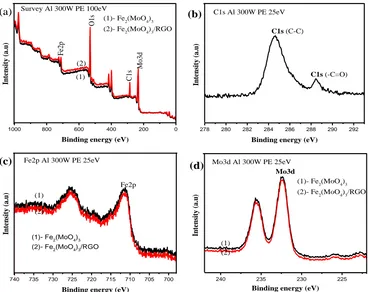
The formation of Fe2(MoO4)3/RGO nanocomposite is further investigated using X- ray
[image:5.596.99.501.402.707.2]photoelectron spectroscopy (XPS). It is well known that the electrochemical properties of the sample is related with their sizes and phases as well as their chemical binding states. The XPS survey spectra in Figure 3(a) show that Fe, Mo, C and O elements coexist. The core level binding energies of C1s spectrum shown in Figure 3(b) can be apparent peaks at 284.7eV and 288.6eV, respectively, which are the characteristic peaks of sp2 hybridized graphite-like carbon atoms of RGO and in atoms abound to oxygen atoms. Further, the spectra of Fe2p and Mo3d in Figure 3(c) and 3(d) show the characteristic peaks of Fe3+ state and Mo6+ state located at 711,79 eV and 232.8 eV, respectively. Both samples with and without RGO have the unchanged characteristic peaks of Fe2p and Mo3d (711.79 eV and 232.8 eV), which implies that the presence of RGO does not alter the state of Fe3+ and Mo6+ in Fe2(MoO4)3.
Figure 2. (a) and (b) SEM images of Fe2(MoO4)3/RGO nanocomposite; (c) and (d) FESEM images of
Figure 3. X-ray photoelectron spectra of Fe2(MoO4)3 powder and Fe2(MoO4)3/RGO nanocomposite.
(a) Survey spectra; (b) C1s spectrum; (c) Fe2p spectra, (d) Mo3d spectra.
3.2 Electrochemical performances and rection mechanism
The cyclic voltammetry curves of Fe2(MoO4)3/RGO nanocomposite electrode between 1.5 V
and 3.5 V at a scanning rate of 0.1 mVs-1 are shown in Figure 4(a). Two current peaks of cathode at 2.53 and 2.62 V are observed during the first reduced and transferred to 2.63 V and 2.54 V in the next. In all oxidation, there are two peaks of anode corresponding at 2.57 and 2.72 V. The intensity of the peaks are well maintained in all subsequent cycles. The results are in good agreement with the galvanostatic cycling profiles and indicates two-step mechanism for reversible electrochemical reaction of Fe2(MoO4)3 with sodium. And it can be expressed as follows [18].
Fe2(MoO4)3 + xNa+ + xe-→NaxFe2(MoO4)3 (the first discharge process, x=1, 2) (1)
NaxFe2(MoO4)3 Fe2(MoO4)3 + xNa+ + xe- (discharge/charge process) (2)
On the Fig.4a, the reduction/oxidation betweens Fe2(MoO4)3 and NaxFe2(MoO4)3 are shown as
follow:
At peak (2.57V), anodic process: Na2Fe2(MoO4)3 - 1e- = NaFe2(MoO4)3 + Na+ (3)
At peak (2.72 V), anodic process: NaFe2(MoO4)3 -1e- = Fe2(MoO4)3 +Na+ (4)
At peak (2.62V), cathodic process: Fe2(MoO4)3 + 1e- + Na+ = NaFe2(MoO4)3 (5)
At peak (2.53 V), cathodic process: NaFe2(MoO4)3 + 1e- +Na+ = Na2Fe2(MoO4)3 (6)
1000 800 600 400 200 0
Binding energy (eV)
(a) Intensi ty ( a.u) Mo3d C1s O1s Fe2p (1) (2)
(1)- Fe2(MoO4)3
(2)- Fe
2(MoO4)3/RGO Survey Al 300W PE 100eV
740 735 730 725 720 715 710 705 700 Binding energy (eV)
(1)
(2)
Fe2p Fe2p Al 300W PE 25eV
(c)
Intensi
ty (
a.u)
(1)- Fe2(MoO4)3
(2)- Fe2(MoO4)3/RGO
240 235 230 225
Binding energy (eV)
(1) (2)
(1)- Fe 2(MoO4)3 (2)- Fe
2(MoO4)3/RGO
Mo3d
Mo3d Al 300W PE 25eV
(d)
Intensi
ty (
a.u)
278 280 282 284 286 288 290 292 C1s Al 300W PE 25eV
C1s (-C=O)
Binding energy (eV)
Intensi
ty (
a.u)
(b)
[image:6.596.112.480.83.375.2]
These results clearly reveal that the insertion/extraction of Na+ ions only occur inside Fe2(MoO4)3 rather than on the RGO. RGO function is only used as a conducting material, which does
[image:7.596.103.484.153.467.2]not participate in the redox process.
Figure 4. (a) The third cyclic voltammetry curves of Fe2(MoO4)3 nanocomposite electrode at a voltage
scanning rate of 0.1 mV s-1; (b) Ganvanostatic curves of Fe2(MoO4)3/RGO nanocomposite/ Na
cell at a current rates of 0.1, 0.5, 1, and 1.5 C; (c) The specific capacities of Fe2(MoO4)3/RGO
nanocomposite and Fe2(MoO4)3 powder at 0.1, 0.5, 1 and 1.5 C (Electrolyte is 1M NaClO4 in
propylene cacbonate (PC)); (d) EIS plots of Fe2(MoO4)3 powder and Fe2(MoO4)3/RGO
nanocomposite after 3 cycles at 9 mA g-1 in the frenquency range between 100 kHz and 0.1 Hz at open circuit voltage (OCV) with 5 mV amplitude voltage (inset shows the equivalent circuits corresponding to the Nyquist plots). All gravimetric capacity of the Fe2(MoO4)3/RGO
nanocomposite is calculated based on the total weight of the comosite that contains approximately 10 wt.% RGO.
Figure 4(b) shows the first discharge/charge profiles of Fe2(MoO4)3/RGO nanocomposite/Na
cells at a rate of 0.1, 0.5, 1 and 1.5 C. The open circuit voltage (OCV) of Fe2(MoO4)3/RGO
nanocomposite/ Na cells is 2.72 V. The discharge capacities of Fe2(MoO4)3/RGO nanocomposite at 0.1
and 0.5 C are about 90.6 mAh g-1 and 89.2 mAh g-1, respectively, corresponding to about 20 Na+ per formula unit (p.f.u), which means completely transformed the Fe3+ to Fe2+. It is reason that increases specific capacity of the Fe2(MoO4)3/RGO.
1.5 2.0 2.5 3.0 3.5
-0.25 -0.20 -0.15 -0.10 -0.05 0.00 0.05 0.10 0.15 0.20 0.25 Curre nt (mA)
Potential (V vs Na+
/Na) 1st cycle 2nd cycle 3rd cycle (a) A B C D
10 20 30 40 50
30 40 50 60 70 80 90 Specific capa citiy (mAhg -1 ) Cycle number (c) (1) (2) (3) (4) (5)
(1)- Discharge/Charge Fe2(MoO4)3/RGO at 0.1C (2)- Discharge/Charge Fe2(MoO4)3/RGO at 0.5C (3)- Discharge/Charge Fe2(MoO4)3/RGO at 1C (4)- Discharge/Charge Fe2(MoO4)3/RGO at 1.5C (5)- Discharge/Charge Fe2(MoO4)3 powder at 0.1C
10 20 30 40 50 60 70 80 90 1.8 2.0 2.2 2.4 2.6 2.8 3.0 3.2 3.4
1.5C, 1C, 0.5C, 0.1C-Discharge 1.5C, 1C, 0.5C, 0.1C- Charge
Volta
ge (V)
Specific capacity (mAhg-1 )
(b)
0 100 200 300 400 500 600 700 0 100 200 300 400 500 600 700 800 -Z'' ( )
Z'()
Fe2(MoO4)3/RGO nanocomposite
The electrochemical performances of Fe2(MoO4)3 andthe Fe2(MoO4)3/RGO nanocomposite in
sodium half cell are compares in Figure 4(c). The gravimetric cap cities of Fe2(MoO4)3/RGO
nanocomposite is calculated based on total weight of the composite that contains about 10 wt.% RGO. The 0.1 C discharge-charge voltage profiles shows at potential plateau at about 2.72 V, which indicates a two phase reaction corresponding to the redox couple of Fe3+/2+ and are agreement with the previous experimental results [18]. The initial coulombic efficiency of Fe2(MoO4)3/RGO is around 99.6 % and
Fe2(MoO4)3 powder is about 88.79 %, a relatively low value may be attributed to the kinetic barriers
by structural changes during sodium ion extraction/insertion. Trends in the structure Fe2(MoO4)3
-NASICON has not been fully explained yet, but optimization of the sodium ion cells with electrolyte suitable system can alleviate this issue [9, 27, 39]. Although both samples have similar crystal and the Fe2 (Moo4) 3 phase, but the high rate performance for two samples is quite different. Fe2(MoO4)3/RGOnanocomposite provides discharge capacities of 90.60, 89.77, 87.62, and 80.02 mAh
g-1 at 0.1, 0.5, 1 and 1.5 C, respectively, whereas Fe2(MoO4)3 powder delivers the discharge capacities
of 80.10 mAh g-1 at 0.1 C (Figure 4(c)). It is apparent that the voltage polarization of the composite between the discharge and charge curves are appreciably lower than that of Fe2(MoO4)3 powder even
at a low capacity rate. The Fe2(MoO4)3/RGOnanocomposite exhibits superior capacity maintained a
rate of high capacity compared with Fe2(MoO4)3 powder as shown in Figure 4 (c). It should be noted
that the initial capacity of Fe2(MoO4)3/RGO nanocomposite is slowly decrease, although it is
discharged at high rate. It can be speculated that the graphene sheets are capable embedded support in an electronic conducting path for composite; therefore, the RGO may be effective in enhancing the electronic conductivity of Fe2(MoO4)3. Apparently, the Fe2(MoO4)3/RGO nanocomposite shows a
larger capacities and better stable cycle than the Fe2(MoO4) powder electrode. Specially, at high rates
(1.5 C), it is still able to deliver stable capacity of 80.02 mAh g-1 that is mantai 93.8 % of theoretical capacity.
The improved specific capacity and discharge at high currents of the Fe2(MoO4)3/RGO sample
may be related to its nanostructure, which may facilitate the diffusion process. With the increasing of their surface areas, increased contact between electrode and electrolyte, which makes the short path length for both sodium ion diffusion and electronic transport as well as the enhanced ionic and electronic conductivity [18, 28]. The increasing of the current rate, especially at high current, the discharge voltages reduce and the charge voltages increase due to the effect of increasing electrochemical polarization.The Fe2(MoO4)3/RGO nanocomposites are short path sodium insertion
and holding adsorption of electrolyte wich can reduce electrode polarization when high rate sodium ions insert/extraction. This is further studied by electrochemical impedance spectroscopy method.
Figure 4(d) show the Nyquist plots of Fe2(MoO4)3 and Fe2(MoO4)3/RGO nanocomposites
cathode after 3 cycle at 9 mA g-1 in the frenquencies range between 100 kHz and 0.1 Hz at open circuit voltage (OCV) with 5 mV amplitude voltage. The semicircles at high to medium frenquencies is mainly related to a complex reactions process at the cathodic interface/electrolyte. The sloping line in the lower frenquencies region are attributed to the Warburg impedance, that are associated with sodium-ions diffusion in the Fe2(MoO4)3 electrode. It can be observed that diameters of high
frienquency combined semicircle of Fe2(MoO4)3/RGO nanocomposite is smaller than Fe2(MoO4)3
resistances of electrolyte, electrodes and separator; Rf and CPE1 are related to the diffusion resistances
of Na+ ions through the solid electrolyte interface (SEI) layers and corresponding constant phase elements (CPE); Rct and CPE2 correspond to charge transfer resistances and the correspond CPE; Zw is
Warburg impedance [22].The exchange current density is calculated using the following equation: io= RT/nFRct (7)
The fitting results of Re, Rf, Rct and io as shown in Table 2 indicate that the Rf and Rct values of
Fe2(MoO4)3/RGO nanocomposite cathode are smaller than that of Fe2(MoO4)3 powder. It can be
confirmed that the decrease of charge transfer resistances are beneficial to the kinetic behaviors during charge/discharge process. Since the Fe2(MoO4)3/RGO nanocomposite shows the lowest resistances and
the largest exchange current densities, it is suggested that RGO addition to the Fe2(MoO4)3 particle
surface significantly improved performances of the sodium-ion batteries.
Table 2. Impedances parameters calculated from equivalent circruit.
Sample Re () Rf () Rct () i
o
(mA cm-2)
Fe2(MoO4)3 powder 10.55 120.86 265.60 4.831x10⁻⁵
Fe2(MoO4)3/RGO nanocomposite 6.45 48.26 90.96 1.411x10⁻⁴
4. CONCLUSIONS
Fe2(MoO4)3/RGO nanocomposite was prepared by wet chemistry route, which is the
nanostructure formed by Fe2(MoO4)3 particles and RGO nanosheets. The porous structures including
large specific surfaces and short sodium ion diffusion paths of Fe2(MoO4)3/RGO nanocomposite and
high conductivity RGO could lead to the good electrochemical properties, especially exhibit perfect cyclability and stalbe structure at high rate when they are used as cathode materials for SIBs. Addition of RGO onto the surface of Fe2(MoO4)3 particles significantly improve conductivity and specific
surface area, which causes the improvement in the performance of the sodium-ion battery. As the charge/discharge at 1.5 C, the initial specific capacity of Fe2(MoO4)3/RGO nanocomposite is 80.02
mAh g-1 and remains 75.92 mAh g-1 after 50 cycles.
ACKNOWLEDGEMENTS
This work is supported by the International S&T Cooperation program of China (ISTCP) (No. 2013DFR50710), Equipment pre-research project (No. 625010402), Science and Technology Support Program of Hubei Province (No. 2014BAA096), and the National Nature Science Foundation of Hubei Province (No. 2014CFB165).
References
1. B. L. Ellis and N. F. Linda, Solid State and Materials Science, 16 (2012) 168
4. G. Pistoia, Lithium batteries, Elselver, Tokyo (1994) 239-279
5. K. R. Alok, T. A. Ly, G. Jihyeon, M. Vinod and J. Kim, Ceram. Int., 40 (1) (2014) 2411 6. M. M. Doeff, Y. M. Peng, Y. P. Ma and L. D. Jonghe, J. Electrochem. Soc.,141 (1994) L145 7. J. Molenda, C. Delmas and P. Hagenmuller, Solid State Ionics, 9-10 (1983) 43
8. K. Trad and D. Carlier, J. Phys. Chem. C, 114 (2010) 10034
9. Z. L. Jian, L. Zhao, H. L. Pan, S. Y. Hu, H. Li, W. Chen and Q. L. Chen, Electrochem. Commun.,
14 (2012) 86
10. J. Kang, S. Baek, M. Vinod, G. Jihyeon, J. Song, Park H, E. Cha, R. A. Kumar and J. Kim, J. Mater. Chem. A, 22 (2012) 20857.
11. W. X. Song, X. B. Ji, Y. P. Yao, H. J. Zhu, Q. Y. Chen, Q. Q. Sun and C. E. Banks, Phys. Chem. Chem. Phys.,16 (2014) 3055
12. Y. Zheng, P. Zhang, S. Q. Wu, Y. H. Wen, Z. Z. Zhu and Y. Yang, J. Electrochem. Soc., 160 (2013) A927
13. M. W. Xu, L. Wang, X. Zhao, J. Song, H. Xie, H. Y. Lu and J. B. Goodenough, Phys. Chem.Chem. Phys., 15 (2013) 13032
14. K. Chihara, A. Kitajou, I. D. Gocheva, S. Okada and J. Yamaki, J. Power Sources, 227 (2013) 80 15. S. M. Oh, S. T. Min, J. Hassoun, B. Scrosati and Y. K. Sun, Electrochem. Commun., 22 (2012) 149 16. A. Sun , F. R. Beck, D. Haynese, J. A. Poston, S. R. Narayanan, P. N. Kumta and A. Manivannan,
Materials Science and Engineering B, 177 (2012) 1729 17. D. W. Su and G. X. Wang, ACS Nano, 7 (12) (2013) 11218
18. Q. Sun, Q. Q. Ren and Z. W. Fu, Electrochem. Commun., 23 (2012) 145
19. W. X. Song, X. B. Ji, Z. P. Wu, Y. C. Yang, Z. Zhou, F. Q. Li, Q. Y. Chen and C. E. Banks, J. Power Sources, 256 (2014) 258
20. M. J. Aragón, C. Vidal-Abarca, P. Lavela and J. L.Tirado, J. Power Sources, 252 (2014) 208 21. J. Liu, K. Tang, K. P. Song, A. A. Peter, Y. Yu, and J. C. Maier, Nanoscale, 6 (2014) 5081 22. V. T. Nguyen, Y. L. Liu, X. Yang and W. Chen, ECS Electrochem. Lett., 4(3) (2015) A29 23. C. Luo, Y. J. Zhu, Y. H. Xu, Y. H. Liu, T. Gao, J. Wang and C. S. Wang, J. Power Sources, 250
(2014) 372
24. S. C. Han, E. G. Bae, Lim and M. H. Pyo, J. Power Sources, 254 (2014) 73
25. K. S. Nanjundaswamy, A. K. Padhi, J. B. Goodenough, S. Okada, H. Ohtsukab, H. Araib and J. Yamakib, Solid State Ionics, 92 (1996) l
26. J. Shirakawa M. Nakaya, M. Wakihar and Y. Uchimoto, J. Phys. Chem. B, 11 (2007) 1424 27. P. G. Bruce and G. Miln, J. Solid State Chem., 89 (1989) 162
28. L. L. Liu and Y. H. Xu, Nano Lett., 12 (2012) 5664
29. M. Zhi, C. Xiang, J. Li, M. Li and N. Wu, Nanoscale, 5 (2013) 72
30. W. Shen, C. Wang, H. M. Liu and W. S. Yang, Chemistry - A European Journal, 19 (43) (2013) 14712
31. W. J. Hao and H. H. Zhan, J. Yu, Mater. Lett., 83 (2012) 121
32. Y. Jiang, W. W. Xu, D. D. Chen, Z. Jiao, H. J. Zhang, Q. L. Ma, X. H. Cai, B. Zhao and Y. L. Chu, Electrochim. Acta, 85 (2012) 377
33. Z. S. Wu, G. M. Zhou, L. C. Yin, W. C. Ren, F. Li and H. M. Cheng, Nano Energy, 1 (2012) 107 34. Z. L. Hou, W. L. Song, P. Wang, M. J. Meziani, C. Y Kong, A. Anderson, H. Maimaiti, G. E.
LeCroy, H. J. Qian and Y. P. Sun, ACS Appl. Mater. Interfaces,6 (17) (2014) 15026
35. S. L. Candelaria, Y. Y. Shao, W. Zhou, X. L. Li, J. Xiao, J. G. Zhang, Y. Wang, J. Liu, J. H. Li and G. Z. Cao, Nano Energy, 1 (2012) 195
36. A. Chavez-Valdez, M. S. P. Shaffer and A. R. Boccaccini,J. Phys. Chem. B,117 (6) (2013) 1502. 37. M. Pumera, Energy Environ. Sci., 4 (2011) 668
38. Y. H. Jung, C. H. Lim and D. K. Kim, J. Mater. Chem. A, 1 (2013) 11350.