Int. J. Electrochem. Sci., 8 (2013) 10506 - 10514
International Journal of
ELECTROCHEMICAL
SCIENCE
www.electrochemsci.orgSynthesis and Characterization of CdO Nanoparticles Starting
from Organometalic Dmphen-CdI
2complex
A.S. Aldwayyan1, F.M. Al-Jekhedab2, M. Al-Noaimi3, B. Hammouti4,*, T. B. Hadda5, M. Suleiman6, I. Warad6*
1
Department of Physics and Astronomy, College of Science, King Saud University, PO Box 2455, Riyadh 11451, Saudi Arabia.
2
The National Center for Nanotechnology Research (NCNR), King Abdulaziz City for Science and Technology, PO Box 6086, Riyadh 11442, Saudi Arabia,
3
Department of Chemistry, Hashemite University, P.O. Box 150459, Zarqa-13115-Jordan,
4
LCAE-URAC18, Faculty of Sciences, University Mohammed Premier, Oujda-60000, Morocco,
5
Laboratoire LCM, Faculty of Sciences, University Mohammed Premier, Oujda-60000, Morocco
6
Department of Chemistry, AN-Najah National University, Nablus, Palestinian Territories
*
E-mail: [email protected]
Received: 29 May 2013 / Accepted: 24 June 2013 / Published: 1 August 2013
Cadmium oxide (CdO) nanoparticles were prepared starting from organometallic cis-[dmphen-CdI2]
complex (dmphen = 2,9-Dimethyl-1,10-phenanthroline) through one step calcination process at 800
o
C, the thermal behavior of the complex during calcination was recorded by TGA/DTA. The obtained product are analyzed by FT-IR, UV-visible, X-ray diffractometer (XRD), EDS, SEM and TEM, the average size of CdO nanoparticles found to be 50 nm.
Keywords: CdO Nanoparticles, XRD, UV-visible, EDS, SEM, TEM, TGA/DTA, FT-IR.
1. INTRODUCTION
Nanoparticles have attracted great interest recently due to their unique physical and chemical properties, which are different from those of either the bulk materials or single atoms [1].
effects and other mesoscopic effects. Because of these interesting possibilities, there has been some effort to prepare nanoparticles of CdO. Liu et al. [7] synthesized CdO nanoneedles by chemical vapour deposition. CdO nanowires have been synthesized by decomposing CdCO3 in a KNO3 salt flux [8].
Zou et al. [9] have prepared CdO nanoparticles by the micro-emulsion method employing AOT reverse micelles. There is also a report of stearate coated CdO nanoparticles of 5–10 nm size range, obtained by the micro-emulsion method starting from an aqueous solution of a cadmium salt and stearic acid in xylene [10].Wu et al. [11] prepared a nanometer-sized CdO organosol from an aqueous solution of Cd(NO3)2, in the presence of a surfactant and toluene as solvent.
Some workers try to modify the synthesis procedure for CdO with the aim to improve chemical and physical properties of this material. Such examples of this are: Gulino et al. [12] that investigated the formation of CdO thin films by thermal decomposition of cadmium hexafluoroacetylacetonate dehydrate [Cd(C5F6HO2)2.H2O]. The Cd(C5F6HO2)2.CH3OCH2OCH3 complex was precursor in the
preparation of thin CdO films [13]. The thermal decomposition of cadmium itaconate monohydrate (C5H4O4Cd.H2O) in N2, H2 or air was also investigated [14]. Uplane et al. [15] reported the preparation
of CdO thin films onto the hot glass substrate at 400 °C by spray pyrolysis of the aqueous cadmium acetate solution.
2. EXPERIMENTAL PART
2.1. Apparatus
All the chemical reagents was from Riedel-Dehaenag (Germany), and used as received. The obtained nanoparticles were examined by a Brucker D/MAX 2500 X-ray diffractometer with Cu K radiation (λ = 1.54 Å), and the operation voltage and current were maintained at 40 kV and 250 mA, respectively. The transmission electron microscopy was (TEM, 1001 JEOL Japan). The scanning electron microscopy (SEM, JSM-6360 ASEM, JEOL Japan). And the IR spectra for samples were recorded by using (Perkin Elmer Spectrum 1000 FT-IR Spectrometer). Samples were measured and recorded using a TU-1901 double-beam UV–visible spectrophotometer was dispersed in toluene solution
2.2. Chemicals and Solutions
Cadmium iodide, 2,9-dimethyl-1,10-phenanthroline ligand, dichloromethane (99.0%), Ethanol (99.5%), were purchased from Fluka.
2.3. Preparation of the dmphen-CdI2 complex
A mixture of 2,9-dimethyl-1,10-phenanthroline (50.0 mg, 0.24 mmol) in dichloromethane (5 ml) and CdI2 (65.4 mg, 0.24 mmol) in methanol (10 mL) was placed in a round bottom flask and
pressure. Addition of 40 mL of n-hexane caused the precipitation of white powder, which was filtered and then dried under vacuum to 108 mg (yield 94% based on Cd).
2.3. Preparation of CdO nanoparticles
0.5g dmphen-CdI2 was calcinated directly at 800 oC for 120 min, the calcinations process was
stopped upon no organic function group vibrations was detected by IR, white powder CdO was formed at the end of the process.
3. RESULTS AND DISCUSSION
3.1. Synthesis of dmphen-CdI2 complex and CdO
The cis-[dmphen-CdI2] as mononuclear complex was prepared by use of a modification of our
literature method [16, 17]. The complex was isolated in good yield from a simple, 3 h, RT reaction of one equivalent of dmphen ligand with CdI2 under gentle, stirred, open atmosphere conditions, using
mixture of dichloromethane and ethanol as solvent (Scheme 1). The white powder complex product is soluble in chlorinated solvents, for example chloroform and dichloromethane, and insoluble in alcohols, water, ethers, and n-hexane.
N
N
CH3 CH3
CdI2
CH2Cl2/EtOH
N N CH3 CH3 Cd I I Calcination CdO (Nanoparticle)
Scheme 1. Synthesis of the desired dmphen-CdI2 complex and CdO nanoparticle .
CdO nanoparticle was prepared for the first way through direct calcinations of cis-[dmphen-CdI2] complex at 400 oC for 120 min.
3.2. Thermal Properties of cis-[dmphen-CdI2] complex and CdO nanoparticle ( TGA/DTA)
To follow up the thermal decomposition of the cis-[dmphen-CdI2] complex to form the CdO
[image:4.596.171.434.205.350.2]
molecules. Such complexes undergo three-step decomposition with weight loss experimentally 73%, the coordinated iodide and 1,10-phenanthroline ligands have been de-structured from the complex. Three exothermic DTA peaks at 420, 590 and 670 oC were recorded. The DTA patterns is the signature of the good crystallization of such complexes, the exothermic peaks reaction indicated that the complexes thermally decomposed for formation of Cadimium-oxide phase through oxidation decomposition process. The final residue was analyzed as CdO which revealed thermal stability from 700 to 1000 oC.
Figure 1. TGA and DTA curves of dmphen-CdI2 complex.
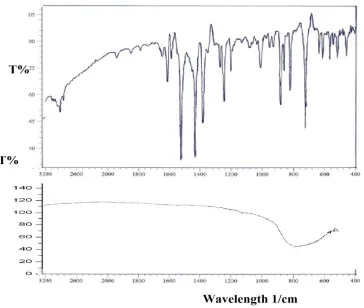
3.3. FT-IR investigation
Figure 2. IR spectra of dmphen-CdI2 complex up and CdO nanoparticles (dmphen-CdI2 after
[image:4.596.119.483.425.733.2]
Figure 2 shows the IR spectra for these samples: the starting complex dmphen-CdI2 and the
product CdO nanoparticle. IR spectra of the dmphen-CdI2 complex contained four characteristic
absorption peaks at 3090, 2890, 820, and 290 cm-1, which can be assigned to, Ph–CH, Me–CH, Cd–N and Cd–Cl stretching vibrations, respectively. All other functional group vibrations appeared at their expected positions. After calcinations of dmphen-CdI2 at 400C0 for 120 min only, Fig. 2 shows all the
vibration of the organic function groups were disappeared and only one broad sign at 750- 500 cm-1 belongs to CdO bond, it could be useful in understanding the bonding between the Cd-O atoms, the formed CdO phase is characterized by an intense and very broad IR band with poorly resolved shoulder at 550 and 480cm-1 which characteristic of CdO.[18].
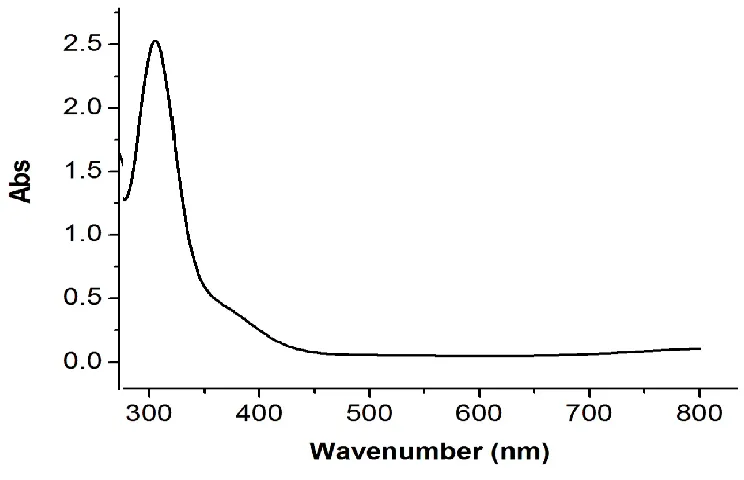
3.4.UV–visible absorption spectra for CdO nanoparticles
[image:5.596.118.490.381.621.2]The UV–visible absorption spectra of CdO nanoparticles are shown in Figure 3 although the wavelength of our spectrometer is limited by the light source, the absorption band of the CdO nanoparticles have been shows a blue shift due to the quantum confinement of the exactions present in the sample compare with bulk CdO particles. This optical phenomenon indicates that these nanoparticles show the quantum size effect [19, 20].
Figure 3. UV-Absorption spectra for CdO nanoparticles
3.5. XRD pattern for CdO nanoparticles
D = (094 λ)/(β cosθ)
[image:6.596.149.456.253.445.2]Where λ is the wavelength (λ = 1.542 Å) (CuKα), β is the full width at half maximum (FWHM) of the line, and θ is the diffraction angle. The grain size estimated using the relative intensity peak (220) for CdO nanoparticles was found to be 48 nm and increase in sharpness of XRD peaks indicates that particles are in crystalline nature. The (111), (200), (220), (311) and (222) reflections are clearly seen and closely match the reference patterns for CdO (Joint Committee for Powder Diffraction Studies (JCPDS) File No. 05-0640) The sharp XRD peaks indicate that the particles were of polycrystalline structure, and that the nanostructure grew with a random orientation [21].
Figure 4. XRD pattern for CdO nanoparticles
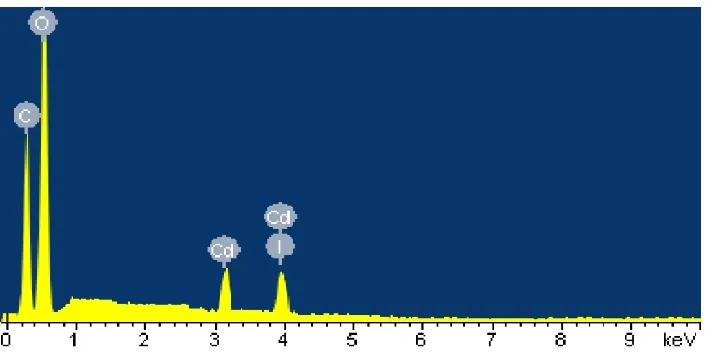
3.6. EDS measurement
[image:6.596.123.477.525.705.2]
To identify and differentiate the chemical composition of the desired nanomaterial. It was subjected to EDS measurement as in Figure 5, which found to have signs belong their composition; they contain signs of carbon at 0.2 eV, oxygen at 0.6 eV, and cadmium sign at 3.2 and 3.9 eV.
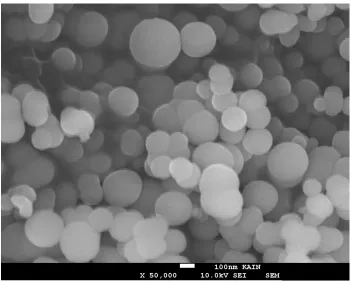
3.7. Scanning Electron Microscopy (SEM) measurement
[image:7.596.123.474.269.551.2]The SEM image of the CdO nanoparticles corresponding to the XRD pattern in Fig.4 is shown in Fig. 6, it is clear that the prepared CdO nanoparticles have regular spherical shape and uniform size, with an average size of 50 nm and one can see some coalesced nanoparticles with a size of about 100 nm.
Figure 6. SEM image of CdO nanoparticles of an average diameter of 40-100 nm.
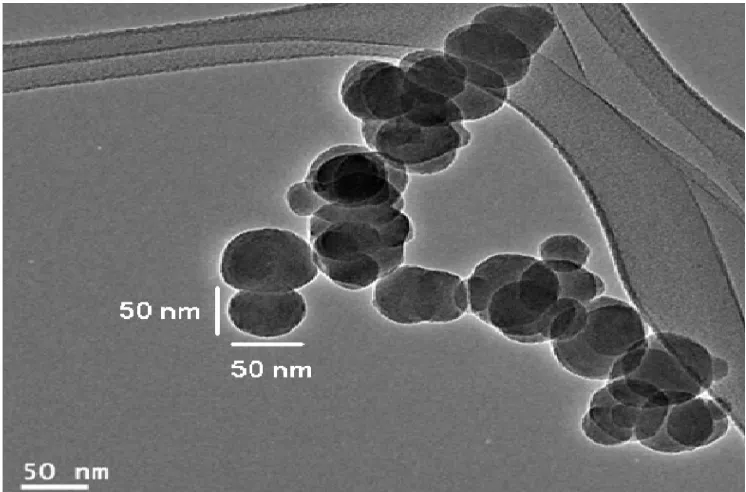
3.8. Transmission Electron Microscopy measurement (TEM)
Figure 7. TEM image of CdO nanoparticles of an average diameter of 50 nm.
4. CONCLUSION
This report has shown the synthesis of CdO nanoparticles using organometallic dmphen-CdI2
complex through one step calcinations process at 800 oC. From XRD, SEM and TEM data obtained of the nanoparticle size were ~ 50 nm. Advantage of this method is convenient for synthesis of CdO nanoparticles in normal laboratory conditions and low cost.
ACKNOWLEDGEMENTS
The project was supported by King Saud University, Deanship of Scientific Research, College of Science Research Center.
References
1. V.S. Muralidharan, and A. Subramania, Nanoscience and technology, Crc Press, New Delhi, (2009) 542.
2. C. Sravani, K.T.R. Reddy, O.M. Hussain, and P.J. Reddy, J. Solar. Energy. Soc. India 1 (1996) 6. 3. L.M. Su, N. Grote, and F. Schmitt, Electron. Lett. 20 (1984) 716.
4. R. Kondo, H. Okimura, and Y. Sakai, Jpn. J. Appl. Phys. 10 (1971) 1547. 5. F.A. Benko, and F.P. Koffyberg, Solid State Commun. 57 (1986) 901. 6. A. Shiori Jpn. Patent No. 7 (1997) 909.
7. Y. Liu, C. Yin, W. Wang, Y. Zhan, and G. Wang, J. Mater. Sci. Lett. 21 (2001) 137 8. X. Liu, C. Li, S. Han, J. Han, and C. Zhou, Appl. Phys. Lett. 82 (2003) 1950. 9. B.S. Zou, V.V. Volkov, and Z.L. Wang, Chem. Mater. 11 (1999) 3037. 10.W. Dong, and C. Zhu, Opt. Mater. 22 (2003) 227.
[image:8.596.114.487.69.315.2]
12.A. Gulino, F. Castelli, P. Dapporto, P. Rossi, and I. Fragala, Chem. Mater. 14 (2002) 704. 13.A. Gulino, P. Dapporto, P. Rossi, and I. Fragala, Chem. Mater.14 (2002) 1441.
14.M.A. Mohamed, S.A. Halawy, J. Anal. Appl. Pyrolysis 65 (2002) 287.
15.M.D. Uplane, P. N. Kshirsagar, B.J. Lokhande, and C.H. Bhosale, Mater. Chem. 64 (2000) 75. 16.I. Warad, A. Boshaala, S.I. Al-Resayes, S.S. Al-Deyab, M. Rzaigui, Acta Cryst. E67 (2011) 1846. 17.I. Warad, A. Boshaala, S.I. Al-Resayes, S.S. Al-Deyab, and M. Rzaigui, Acta Cryst. E67 (2011)
1650.
18.K.M. Abd El-Salaam, and E.A. Hassan, Surf. Technol, 16 (1982) 121.
19.X.R. Ye, C. Daraio, C. Wang, and J.B. Talbot, J. Nanoscience and Nanotechnology, 6 (2006) 852 20.Z. Guo-hua, L. Ming-fang, and L. Ming-Li CEJC, 5 (2007) 1114.
21.H.P. Klug, and L.E. Alexander, X-ray Diffraction Procedures for Polycrystalline and Amorphous Materials, Wiley, New York (1954).
22.M. Pandurangachar, B.E. Kumara Swamy, U. Chandra, O. Gilbert and B.S. Sherigara, Int.J. Electrochem. Sci, 4 (2009) 672.
23.Rekha, B.E. Kumara Swamy, R. Deepa V. Krishna, O. Gilbert, U. Chandra, and B.S. Sherigara, Int. J. Electrochem. Sci., 4 (2009) 832.