guarantees
.
White Rose Research Online URL for this paper:
http://eprints.whiterose.ac.uk/81558/
Version: Accepted Version
Proceedings Paper:
Kavanagh, RE and Djemame, KD (2011) A grid broker pricing mechanism for temporal and
budget guarantees. In: Thomas, N, (ed.) Computer Performance Engineering 8th
European Performance Engineering Workshop, EPEW 2011, Proceedings. 8th European
Performance Engineering Workshop 2011, 12-13 October 2011, Borrowdale, UK. Lecture
Notes in Computer Science, 6977 . Springer , 295 - 309. ISBN 978-3-642-24748-4
https://doi.org/10.1007/978-3-642-24749-1_22
eprints@whiterose.ac.uk https://eprints.whiterose.ac.uk/
Reuse
Unless indicated otherwise, fulltext items are protected by copyright with all rights reserved. The copyright exception in section 29 of the Copyright, Designs and Patents Act 1988 allows the making of a single copy solely for the purpose of non-commercial research or private study within the limits of fair dealing. The publisher or other rights-holder may allow further reproduction and re-use of this version - refer to the White Rose Research Online record for this item. Where records identify the publisher as the copyright holder, users can verify any specific terms of use on the publisher’s website.
Takedown
If you consider content in White Rose Research Online to be in breach of UK law, please notify us by
and Budget Guarantees
Richard Kavanagh and Karim Djemame
School of Computing, University of Leeds, Leeds, LS2 9JT, UK
{screk,karim.djemame}@leeds.ac.uk http://www.comp.leeds.ac.uk
Abstract. We introduce a pricing mechanism for Grid computing, with the aim of showing how a broker can accept the most appropriate jobs to be computed on time and on budget. We analyse the mechanism’s performance via discrete event simulation, and illustrate its viability, the benefits of a new admission policy and to how slack relates to machine heterogeneity.
Keywords: Grid, Economic Model, Time-Cost Constrained Brokering, Job Admission Control
1
Introduction
Grids [8, 7] enable the execution of large and complex programs in a distributed fashion. It is however, common that resources are provisioned in a best effort approach only, with no guarantees placed upon service quality. It has also been known for some time that guaranteed provision of reliable, transparent and qual-ity of service (QoS) oriented resources is an important step for successful com-mercial use of Grid systems [2, 24, 15, 20].
The idea of introducing QoS to aid the uptake of Grids is not new and there is a significant trend towards the provision of QoS. This is because of a widely held belief that QoS is the major issue that keeps Grids from substantial uptake outside academia [15, 16, 22, 9, 21].
In real world commercial and time-critical scientific settings guarantee that computation is going to be completed on time are required. Best-effort service limits the economic importance of Grids because users will be reluctant to pay or contribute resources if the service they receive is not going to return computed results at the time they are required [16].
[10]. It therefore makes sense to prioritise particular compute jobs based upon when the results are required. In order that prioritisation is provided correctly an economic approach is used to ensure users truthfully indicate their priorities [4, 17].
To provide QoS the nature of the work that is being performed upon Grids has to be understood. A substantial part of Grid workloads are formed from Bag of Task/Parameter sweep based applications [13, 10]. These are formed by sets of tasks that execute independently of one another without communication and are typically considered to be ”embarrassingly parallel” [19]. Parameter sweeps are formed by the same application been executed, while having either different parameters or datasets to process.
In [15] it is made clear that uncharacterised, unguaranteed resources have no value and that if poor QoS is provided that can be precisely characterized then the value of the service may be defined. We therefore introduce an economic model for brokering that ensures jobs/a bag of tasks only hold value to the broker if they are completed in a timely fashion. Discrete event simulation is performed to ensure we can characterise how the pricing model behaves, thus ensuring that time and budget guarantees made by the broker can be achieved.
This paper’s main contributions are:
– A viable pricing mechanism that binds time and economic requirements of a job together.
– Recommendations upon how to use slack, in relation to the reference proces-sors speed to mitigate machine heterogeneity within the proposed economic model.
– a new job admission control mechanism, that deals with due date and dead-line based job requirements.
The remaining structure of the paper is as follows: The next section discusses the pricing mechanism that has been formulated. The third section covers exper-imental setup. The fourth discusses the simulation results. The fifth discusses the related work and finally the last section discusses future work and conclusions.
2
The Pricing Mechanism
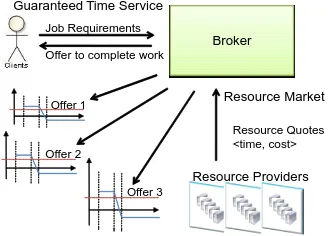
In this section we introduce the pricing mechanism that is intended to be used in a broker aiming for temporal and budgetary guarantees. We first describe the sequence of events that occur in this brokering service (see Figure 1).
Broker
Resource Providers Resource Quotes <time, cost> Job Requirements
Offer 1
Offer 2
Offer 3 Offer to complete work Guaranteed Time Service
[image:4.595.229.393.124.242.2]Resource Market
Fig. 1: The pricing mechanism
2. The broker then contacts the various resource providers that are available to the user. It requests a cost and time estimate for completing the work. 3. The resource providers perform initial scheduling of the tasks within a job
so they can derive an estimate for completion time and price. This is based upon their local resource markets.
4. The resource providers then present offers to complete the work to the broker. 5. The broker from the offers that have been returned, ranks them and filters
out poor offers i.e. sort by earliest and filter out unprofitable offers. 6. The broker then asks the user if it acceptable to proceed with the job at a
given price.
7. If the offer made to the user is acceptable the broker then submits the bag of tasks that make up the job to the winning provider.
It is eventually expected that negotiations will occur between the end user and the broker, given the current market conditions and properties of the job to be submitted.
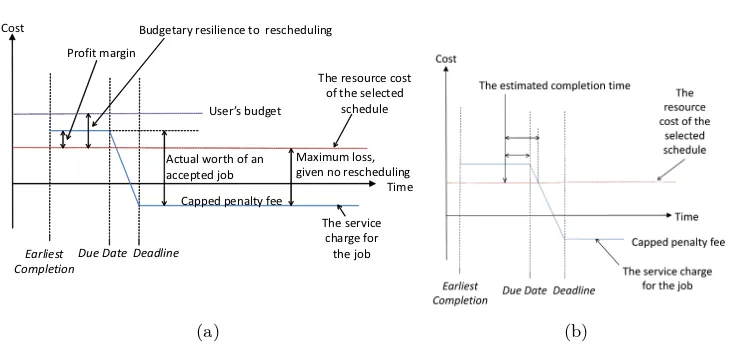
The resource providers generate offers to complete jobs from resource mar-kets. These offers are evaluated by the broker which generates a service market, this market structure was previously seen in SORMA [21]. In this paper we focus upon the broker’s service market and the evaluation of offers made by the resource providers. After the broker has received the offers, it is required to evaluate them, which is illustrated in Figure 2.
From the resource providers a cost for running the job upon their resources is provided. This is illustrated as a single line that is used as a reference point in the service market. The broker needs to establish a markup which ensures the broker has incentive for participating in the market (individual rationality) while also lending itself towards budget balance.
dŝŵĞ
ĞĂĚůŝŶĞ
ŽƐƚ
ƵĞĂƚĞ ĂƌůŝĞƐƚ ŽŵƉůĞƚŝŽŶ
ĂƉƉĞĚƉĞŶĂůƚLJĨĞĞ
dŚĞƌĞƐŽƵƌĐĞĐŽƐƚ ŽĨƚŚĞƐĞůĞĐƚĞĚ
ƐĐŚĞĚƵůĞ WƌŽĨŝƚŵĂƌŐŝŶ
ĐƚƵĂůǁŽƌƚŚŽĨĂŶ ĂĐĐĞƉƚĞĚũŽď
DĂdžŝŵƵŵůŽƐƐ͕ ŐŝǀĞŶŶŽƌĞƐĐŚĞĚƵůŝŶŐ ƵĚŐĞƚĂƌLJƌĞƐŝůŝĞŶĐĞƚŽƌĞƐĐŚĞĚƵůŝŶŐ
hƐĞƌ͛ƐďƵĚŐĞƚ
dŚĞƐĞƌǀŝĐĞ ĐŚĂƌŐĞĨŽƌ ƚŚĞũŽď
[image:5.595.137.502.119.291.2](a) (b)
Fig. 2: The fiscal and temporal nature of an offer
The broker has a service charge that it will get paid by a user, which is denoted by the z-shaped line. This intersects the resource cost which ensures the broker will aim to complete the work on time.
In the initial stage before the due date the broker will make a profit. This will be equal to the markup Öresource cost. The next point of interest is that of the deadline, at this point a cap upon the penalty fee is set. This lends itself to budget balance as it limits the maximum possible loss. The rate at which the service charge is reduced is defined to be a linear decent from the due date and the maximum/original value to the deadline and the cap upon the penalty fee.
The penalty fee will be set to zero as this generates further useful properties. If it is set to zero, the point where the broker breaks even is independent of the resource cost and is a fixed percent of the due date to deadline period. The breakeven point is located at: markup
100+markup Ö100 percentage through the due date to deadline period i.e. if the markup was 50% then 50
100+50 Ö100 = 33%. If this is
not the case then the profit at this same position, where any given resource cost will have the same profit is further defined as 100+markupmarkup Öcap-on-penalty-fee.
The markup in this pricing mechanism will also be used to differentiate be-tween jobs in terms of priority. The higher the priority/markup the faster the budget is consumed upon a given resource, but the more likely the broker is to accept the job due to higher profits. Higher markups also lead to a greater time before the breakeven point when the due date and deadline are not equal i.e. when not using a hard deadline.
accepting the work is the economic risk the broker accepts when scheduling work and asserting guarantees to the end user about its completion.
In Figure 2b there are two important temporal factors marked. The first is the difference between the estimated completion time and the breakeven point. This takes into account the markup assigned to a job. This is because the higher the markup the larger this gap becomes, which leads to the broker having a greater preference for accepting higher markup jobs. Hence this value relates to both temporal and budgetary risk factors i.e. if this gap is small there is little spare time before a loss is made. The second factor is the slack, which is the difference between the due date and the estimate of completion time. This is a purely temporal interpretation of the spare time available to complete the job.
Pricing mechanisms also need admission policies to ensure they are not swamped. We propose the following admission policy:
FOR EACH (Offer) {
Sort the offers based upon the ranking mechanism chosen IF Completion Time <= Due Date AND
Service Price <= Budget { Accept Offer;
BREAK; } ELSE {
Take the last n accepted offers and find the average rate at which profit accumulates and establish the going rate. IF Current offer profit rate >=
(going rate − acceptable deviation below going rate) { Accept Offer;
BREAK; }
}
3
Experimental Setup
The simulation was performed in a bespoke simulator that was written in Java and tested using static code analysis1 and JUnit testing. The simulator works in the following fashion. At the start of the simulation a bucket of jobs is con-structed. These are then released at a set rate determined by the simulator’s core. The broker submits jobs to the local schedulers/providers, which in turn calculate the machine to task allocations that they will make in their offer. The broker then receives offers from the providers. These offers are then ranked and filtered. If a winning offer exists it is accepted and the work is scheduled. Once the initial bucket is empty the simulation is then allowed to finish the remaining scheduled work after which the simulation ends.
The simulator used is highly configurable, the parameters that remain fixed throughout the experiment are hence going to be discussed in the remainder of this section. The duration of the experimentation was not capped but 1,000 jobs were to be processed.
A simple local scheduler was used for the experimentation, it was setup to assign work based upon the machines workload, it took the least loaded first and assigned tasks in order of workload (largest task first).
8 providers were used, each with 144 machines. A range of both machine speed and cost values was chosen. The machine cost was set such that the faster the machine the more it costs, though there will be no set distribution shape for this and values will be set by hand.
The task workload will be placed into three categories: small, medium and large. The categories will denote the average task length. They will be set at the equivalent of 2hrs, 4hrs and 8hrs worth of work on the average machine of a provider. The average speed of the machines is 16,333 units of work per second. Thus the amount of work for a medium sized task is 240,000,000 operations. Similarly this has been done for the small (120,000,000) and large (480,000,000) categories. The workload for a task will have a normal distribution with a mean of 2.73 and a standard deviation of 6.1 following the average task runtime indicated in [13]. The durations were chosen because [11] gives the average time to run a task in a group submission/job as 14,181s and [12, 10] indicates that most runtimes are shown to between a fraction of a minute and 1,000 min (1,000min = 16.6hrs). The runtime variability between tasks belonging to the same BoT [13] is indicated to follow a Weibull distribution with a shape of 2.05 and a scale parameter of 12.25 hence this variability will also be accounted for.
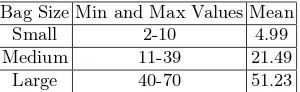
The task per job will be separated into three categories: small, medium and large. A Weibull distribution will be chosen with a shape parameter set to 1.76 as per [13], the scale parameter will be adjusted in a fashion that creates the appropriate range desired. Iosup et al. [13] give an average BoT size in their traces as been between 5 and 50, while the maximum BoT size can be on the order of thousands. The authors in [10] indicate that the average number of tasks in a bag in various different Grid traces investigated ranges between 2 and
Bag Size Min and Max Values Mean Small 2-10 4.99 Medium 11-39 21.49 Large 40-70 51.23
Table 1: The minimum and maximum tasks per job
70 and that most averages for the traces examined fall between 5 and 20. The ranges for the amount of tasks in a bag are therefore indicated in table 1.
The inter-arrival time (i.e. the time between arrivals of jobs) will follow the Weibull distribution and will have a shape parameter of 4.25 as per [13]. The inter-arrival time for job submissions is indicated to be between 1 and 1,000s in [10, 12], with most been below 100s.
A selection of inter-arrival times have therefore chosen to reflect this prior work. Though a wide spread of inter-arrival times has been tested a more select range which provides high levels of competition for resources will be discussed in this paper. Inter-arrival rates will be below 334.14s with an inter-arrival time of 210.14s where it is not otherwise indicated.
Each simulation will be run 10 times and where shown a confidence interval of 95.4% will be indicated.
4
Evaluation
In this section we discuss the results of our experimentation. We initially focus upon the effects of a range of parameters upon jobs accepted and its relationship to slack. We then focus upon results highlighting the behaviour of the admission policy introduced in section 2. In examining the profit made over the life of the simulation we can then assess the long term viability of the broker while ensuring as many users as possible have their requirements satisfied.
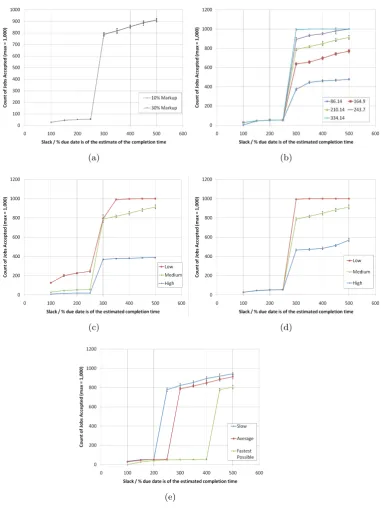
In Figure 3 the due date and deadline are set to be the same time. The inter-arrival time is set at 210.14s where is not subject to change as part of the experiment. This arrival rate has been determined to give a high level of competition between tasks. The markup is fixed at 10% and a medium workload per task and medium count of tasks per job were chosen. The broker’s selection policy sorts the offers by earliest first then accepts the topmost offer.
In Figure 3a two markups are shown, it can be seen that there is little dis-tinguishing difference between them. The profit made which is not shown here differs in that the higher markup when compared with the lower markup makes more profit. The lack of difference between markups is placed down to the per-missive admission policy, used by this first experiment.
that some delay can be tolerated and that this delay will be directly related to other jobs in the system and hence the competition between them.
The arrival rate influences the amount of jobs accepted, but as shown in Fig-ure 3b this only occurs after the transition point. It is noted that the 86.14 inter-arrival time trace is levelling out and is tending towards a maximum permissible amount of acceptable jobs, while 210.14 and 243.7 observe a much more linear relationship after this transition period. Finally the 334.14 trace has reached the maximum amount of jobs submitted after this transition. The effects shown here are because jobs have a fixed time window in which they must be completed, so high arrival rates ensure these windows overlap more and once the slack is increased more freedom of job placement permitted and fewer jobs have to be rejected.
We now show that the position of the transition point is not related to the task count (Figure 3c) or task size (Figure 3d).
In Figure 3c it is observed that before 2.5x slack the amount of tasks in a job distinguishes the traces, which is not seen in the other figures. The differences in gradients seen after the 3.0x point is also of interest as jobs with a lower amount of tasks per job are accepted much more readily, though this also relates to their simply been less work. Argument can still be made that if the slack is small then it helps if the job contains fewer tasks, especially before the transition point. This distinction occurs as there is a finite amount of machines over the average speed of the provider. The average speed was chosen as the mechanism for estimating completion time. Hence when more tasks are present more competition exists between the tasks, as there is a finite set of machines that are fast enough to complete the work in time, especially with low levels of slack.
Figure 3d like Figure 3c changes the amount of workload per job; it must therefore be asked why Figure 3d before the transition does not distinguish between the low, medium and high traces. The reason for this is placed down to the fact the duration a job relates to the amount of work needing completing. In Figure 3d this therefore makes no difference as the size of the slack is related to the estimate of completion time and hence task size.
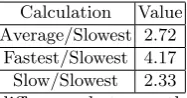
Calculation Value Average/Slowest 2.72
[image:10.595.262.356.116.165.2]Fastest/Slowest 4.17 Slow/Slowest 2.33
Table 2: The relative speed difference between the reference machine and the slowest machine
The fastest/average/slowest machines per provider where 25,000/16,333 and 6,000 ops/sec respectively. In table 2 the reference machine’s speed is compared to the slowest machine and in doing so indicates the location on the x axis of the transition point.
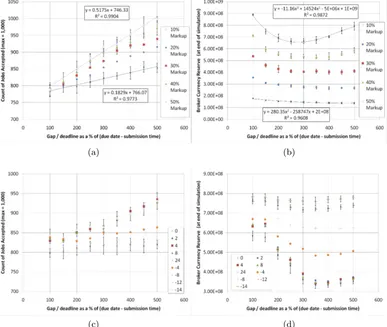
In the experimentation shown by Figure 4 the inter-arrival time is set at 210.14s. The aim of this experimentation it to show the effects of increasing the gap between the due date and deadline. The offers from providers are ordered by earliest completion first. In Figure 4a and 4b the results are shown for several markups. The filter/admission policy being used takes the first offer where a profit is made, which is similar to related work such as [23], given that faster processors in our experimentation cost more. In Figure 4c and 4d the proposed admission policy is used instead. The results shown are for 50% markup which highlights the benefits of our admission policy the most. The last 50 accepted jobs are used to establish the going rate.
In Figure 4a the tendency is to follow a straight line equation, 10% and 50% have been marked on 4a to highlight this. Confidence intervals on 10, 40 and 50% markup runs have been added though for 20% and 30%’s error bars have been omitted but are broadly similar.
It can be seen in Figure 4a when the deadline is set to be 5x (500%) that of the due date, that all jobs with 50% markup are accepted. This illustrates how higher markup encourages job acceptance and exacerbates the effect of the increased gap between due date and deadline. This occurs because the breakeven point is later in the 50% markup than it is with the 10% markup and in general the 50% markup run is more likely to make a profit on a given job.
The detrimental effects of accepting any profitable offers is shown in Figure 4b. The profit drops as the gap between due date and deadline increases. This is due to more jobs being accepted (Figure 4a) which makes it more likely that the next job to arrive will overshoot the due date. The increase in gap size effectively gives more time for job to complete, which generates an increase in competition for the finite resources available as more jobs can plausibly complete before the deadline. It can also be noted that when the gap between due date and deadline is small the rate at which the service price drops quickly, hence providing the steepness of the curve.
In the Figure 4c we can see fewer jobs were accepted when the threshold below the going rate was less than zero i.e. when all jobs after the due date must have a higher going rate than the average for the last 50 jobs.
The broker’s profit can be seen to increase in Figure 4d as the difference in rates is set so that jobs after the completion time have to have a higher rate of return. There remains some loss relative to not allowing any gap, but this has largely been mitigated. The due date to deadline period may also be used solely as a recovery mechanism/a way to deal with completion time uncertainty, at the expense of never accepting work that is expected to complete between the due date and deadline.
5
Related Work
A good introduction to pricing may be found in [30, 21]. The SORMA project introduced two pricing schemes namely k-pricing [26, 3] and the GREEDEX [28] clearing mechanism, though the most similar pricing mechanisms can be found in [6, 23, 14, 5, 1] where a service charge that diminishes once a job has passed a specified time is also used.
In [6, 23, 14, 5] the focus is upon the minimum time for completion/slowdown and not upon the user preference for a completion time. It seems more suitable when considering user satisfaction to aim for a due date and hence when the user wants/needs the results rather than the minimum possible runtime for a given job. The concept of slowdown is also made unclear by various machine speeds across the Grid, as it removes the clear reference point by which slowdown may be judged. This therefore reflects the real world better as it simply stops the need for reference to a dedicated compute resource and focuses on when the results are needed.
In [6, 23, 14, 5, 1] a completion time and rate of loss of a jobs economic value is used. Our approach uses a due date and deadline which is seen as more user friendly than asking for a rate by which a job loses its economic worth.
In [6] currency is provided to users at periodic intervals into accounts with a finite limit. This acts as a control mechanism to ensure arbitrarily large bids cannot be made. [17] describes why hording money introduces predictability and resource starvation issues, which is reasonable justification for using a control mechanism that has upper limits on the account size.
Like our approach Aggregate Utility [23] FirstProfit and FirstOpportunity [23] takes a bound approach to penalty fees. In First Reward and Risk Reward [14] it is chosen to be only potentially bound and in LibraSLA [5] there is no bound at all. This unlimited penalty has issues as pricing mechanisms should have properties such as budget balance and individual rationality which unbound penalties preclude [25, 26].
is still considered, rather than seeing the decay rate as a product of a due date and deadline.
In LibraSLA [5] a deadline based approach is taken, in which deadlines are classified as either hard or soft. Soft deadlines cause the price of jobs to diminish at a given rate. Our approach differs in that it lacks the distinction between deadline types as hard deadlines merely have the due date and deadline been equal.
In [1] an aggregate utility function is used so the user may specify their sensitivity to not having all the tasks in a job been completed. This is seen by the authors to be beneficial in preventing the service provider from cherry picking only the most profitable jobs.
In [14] the concept of net present value is used so future work is discounted with the intent of ensuring that long jobs are penalised. They are seen as being potentially more risky as profit can only be achieved after they complete. The long duration also ensures that they may potentially block a more profitable job in the meantime. This therefore allows the scheduler to be configured to accept only smaller jobs as the returns are likely to be made earlier and the job is less likely to block further more profitable jobs. This feature is worthy of note and may be considered in our own model in the future. It is however not clear how to continually adjust the discount rate to ensure jobs that will not have an detrimental effect upon the next job are accepted, especially in low competition based circumstances.
The admission control was shown during both our own and others experi-mentation to be key [14, 23] to a good brokering system. In early work such as First Price [6] no mention is made. In First Reward and Risk Reward [14] the time before the perceived utility drops below zero is used. This utility derives from using a discount rate that depreciates the perceived value of a job the based on the time it takes to complete. The assumption is that short jobs are less likely to block future more profitable jobs. Our mechanism avoids this and only penalises jobs that do not reach full profit and are likely to delay the next job. In [23] profit is used as admission criteria for FirstProfit, FirstOpportunity, LJF (longest job first) and SJF (shortest job first). For FirstOpportunityRate The ProfitRate (profit divided by schedule duration) is used. In [1] profit rate is again used though it is complicated by the aggregate utility function which allows unprofitable tasks should it ensure the contract mechanism in place for the amount of tasks to complete provides an appreciable gain. Finally LibraSLA [5] uses a ”return value” which is derived from the job’s value/runtime/deadline. This return value is then summed across all nodes and tasks. The new candidate schedule is then compared with the previous schedule.
6
Conclusion and Future Work
the end user, given their cost constraints/priority for their job. We have made recommendations upon how slack can be used in relationship to machine het-erogeneity and a reference machine which is used for estimating job completion times. We have also shown a admission policy that removes the significant losses made by accepting too many jobs. This focused upon the due date to deadline period and ensured the pricing mechanism’s viability by making sure the broker in accepting additional work still maintains its reason for participating in the Grid i.e incentive compatibility.
In the future we plan to consider dynamic pricing at the resource provider level. This ensures resource providers are not going to either undervalue or over-value resources, which in turn can lead to unrealised profit or utility [17, 21]. The models in [23, 14, 5, 1] all make little attempt to cope with data transfer requirements, which has been shown by [27, 18] to be a substantial problem for the scalability of algorithms. We intend to add pricing based on data transfer to our model and to account for transfer times and costs. We also intend to investigate the effects of underestimates of task lengths and the effect of events and slowdowns that require rescheduling.
References
1. AuYoung, A., Grit, L., Wiener, J., Wilkes, J.: Service contracts and aggregate utility functions. In: 15th IEEE International Symposium on High Performance Distributed Computing (HPDC-15). IEEE, New York (2005)
2. Battre, D., Hovestadt, M., Kao, O., Keller, A., Voss, K.: Planning-based scheduling for sla-awareness and grid integration. In: Bartk, R. (ed.) PlanSIG 2007 The 26th workshop of the UK Planning and Scheduling Special Interest Group. vol. 1, p. 8. Prague, Czech Republic (2007)
3. Becker, M., Borrisov, N., Deora, V., Rana, O.F., Neumann, D.: Using k-pricing for penalty calculation in grid market. In: Hawaii International Conference on System Sciences, Proceedings of the 41st Annual. pp. 97–97 (2008)
4. Buyya, R., Abramson, D., Venugopal, S.: The grid economy. Proceedings of the IEEE 93(3), 698–714 (2005)
5. Chee Shin, Y., Buyya, R.: Service level agreement based allocation of cluster re-sources: Handling penalty to enhance utility. In: Cluster Computing, 2005. IEEE International. pp. 1–10 (2005)
6. Chun, B.N., Culler, D.E.: User-centric performance analysis of market-based clus-ter batch schedulers. In: Clusclus-ter Computing and the Grid, 2002. 2nd IEEE/ACM International Symposium on. pp. 30–30 (2002)
7. Foster, I., Kesselman, C., Tuecke, S.: The anatomy of the grid: Enabling scalable virtual organizations. In: Tennessee, U.C.B.L. (ed.) Workshop on Clusters and Computational Grids for Scientific Computing. vol. 15, pp. 200–222. Sage Publi-cations Inc, Chateau Faverges, France (2000)
8. Foster, I.: What is the grid? a three point checklist. Grid Today 1(6), 22–25 (2002) 9. Hovestadt, M.: Fault tolerance mechanisms for sla-aware resource management. In: Parallel and Distributed Systems, 2005. Proceedings. 11th International Con-ference on. vol. 2, pp. 458–462 (2005)
11. Iosup, A., Jan, M., Sonmez, O., Epema, D.: The characteristics and performance of groups of jobs in grids. In: Euro-Par 2007, Parallel Processing, pp. 382–393 (2007) 12. Iosup, A., Li, H., Jan, M., Anoep, S., Dumitrescu, C., Wolters, L., Epema, D.H.J.: The grid workloads archive. Future Generation Computer Systems 24(7), 672–686 (2008)
13. Iosup, A., Sonmez, O., Anoep, S., Epema, D.: The performance of bags-of-tasks in large-scale distributed systems. In: Proceedings of the 17th international sympo-sium on High performance distributed computing. ACM, Boston, MA, USA (2008) 14. Irwin, D.E., Grit, L.E., Chase, J.S.: Balancing risk and reward in a market-based task service. In: High performance Distributed Computing, 2004. Proceedings. 13th IEEE International Symposium on. pp. 160–169 (2004)
15. Kenyon, C., Cheliotis, G.: Architecture requirements for commercializing grid re-sources. In: High Performance Distributed Computing, 2002. HPDC-11 2002. Pro-ceedings. 11th IEEE International Symposium on. pp. 215–224 (2002)
16. Kokkinos, P., Varvarigos, E.A.: A framework for providing hard delay guarantees and user fairness in grid computing. Future Generation Computer Systems 25(6), 674–686 (2009)
17. Lai, K.: Markets are dead, long live markets. SIGecom Exch. 5(4), 1–10 (2005) 18. Lee, Y.C., Zomaya, A.Y.: Data sharing pattern aware scheduling on grids. In:
Parallel Processing, 2006. ICPP 2006. International Conference on. pp. 365–372 (2006)
19. Lee, Y.C., Zomaya, A.Y.: Practical scheduling of bag-of-tasks applications on grids with dynamic resilience. Computers, IEEE Transactions on 56(6), 815–825 (2007) 20. Liu, C., Baskiyar, S.: A general distributed scalable grid scheduler for independent
tasks. Journal of Parallel and Distributed Computing 69(3), 307–314 (2009) 21. Neumann, D., Stober, J., Weinhardt, C., Nimis, J.: A framework for commercial
grids - economic and technical challenges. Journal of Grid Computing 6(3), 325–347 (2008)
22. Nou, R., Kounev, S., Julia, F., Torres, J.: Autonomic qos control in enterprise grid environments using online simulation. Journal of Systems and Software 82(3), 486–502 (2009), j. Syst. Softw.
23. Popovici, F.I., Wilkes, J.: Profitable services in an uncertain world. In: Super-computing, 2005. Proceedings of the ACM/IEEE SC 2005 Conference. pp. 36–36 (2005)
24. Priol, T., Snelling, D.: Next generation grids: European grid research 2005 - 2010 (2003)
25. Schnizler, B., Neumann, D., Veit, D., Weinhardt, C.: A multiattribute combina-torial exchange for trading grid resources. In: Proceedings of the 12th Research Symposium on Emerging Electronic Markets (RSEEM) (2005)
26. Schnizler, B., Neumann, D., Veit, D., Weinhardt, C.: Trading grid services - a multi-attribute combinatorial approach. European Journal of Operational Research 187(3), 943–961 (2008)
27. da Silva, F.A.B., Senger, H.: Improving scalability of bag-of-tasks applications running on master-slave platforms. Parallel Computing 35(2), 57–71 (2009) 28. Ster, J., Neumann, D.: Greedexa scalable clearing mechanism for utility computing.
Electronic Commerce Research 8(4), 235–253 (2008)
29. The University of Leeds: ISQoS Project Homepage (2010), http://www.comp. leeds.ac.uk/CollabSysAndPerf/html/ISQOS.php
(a) (b)
(c) (d)
[image:15.595.137.519.130.644.2](e)
(a) (b)
[image:16.595.139.526.221.548.2](c) (d)