This is a repository copy of
Atomistic molecular dynamics simulations of shock
compressed quartz
.
White Rose Research Online URL for this paper:
http://eprints.whiterose.ac.uk/64836/
Version: Submitted Version
Article:
Farrow, M R and Probert, M I J orcid.org/0000-0002-1130-9316 (2011) Atomistic molecular
dynamics simulations of shock compressed quartz. Journal of Chemical Physics. 044508.
ISSN 1089-7690
https://doi.org/10.1063/1.3615526
eprints@whiterose.ac.uk https://eprints.whiterose.ac.uk/
Reuse
Items deposited in White Rose Research Online are protected by copyright, with all rights reserved unless indicated otherwise. They may be downloaded and/or printed for private study, or other acts as permitted by national copyright laws. The publisher or other rights holders may allow further reproduction and re-use of the full text version. This is indicated by the licence information on the White Rose Research Online record for the item.
Takedown
If you consider content in White Rose Research Online to be in breach of UK law, please notify us by
Atomistic molecular dynamics simulations of shock compressed quartz
M. R. Farrowa)and M. I. J. Probert
Department of Physics, University of York, Heslington, York, YO10 5DD, United Kingdom
(Received 18 April 2011; accepted 1 July 2011; published online 27 July 2011)
Atomistic non-equilibrium molecular dynamics simulations of shock wave compression of quartz have been performed using the so-called BKS semi-empirical potential of van Beest, Kramer, and van Santen [Phys. Rev. B43, 5068 (1991)] to construct the Hugoniot of quartz. Our scheme mimics the real world experimental set up by using a flyer-plate impactor to initiate the shock wave and is the first shock wave simulation that uses a geometry optimised system of a polar slab in a three-dimensional system employing periodic boundary conditions. Our scheme also includes the relaxation of the sur-face dipole in the polar quartz slab which is an essential pre-requisite to a stable simulation. The orig-inal BKS potential is unsuited to shock wave calculations and so we propose a simple modification. With this modification, we find that our calculated Hugoniot is in good agreement with experimental shock wave data up to 25 GPa, but significantly diverges beyond this point. We conclude that our modified BKS potential is suitable for quartz under representative pressure conditions of the Earth core, but unsuitable for high-pressure shock wave simulations. We also find that the BKS potential incorrectly prefers theβ-quartz phase over theα-quartz phase at zero-temperature, and that there is aβ→αphase-transition at 6 GPa.© 2011 American Institute of Physics. [doi:10.1063/1.3615526]
I. INTRODUCTION
Silicates are abundant in the Earth’s interior where they experience high pressures of up to 136 GPa; therefore, their behaviour at high pressure is of great interest to researchers in many areas including physics, astrophysics, and geo-sciences. A well-known silicate, quartz, or silicon dioxide (SiO2) is found in theα-quartz phase at standard
tempera-ture and pressure with each silicon atom being 4-fold coor-dinated with the oxygen atoms and has a crystal structure made up of SiO4tetrahedra building blocks. Quartz has many
high-pressure, high-temperature polymorphs; β-quartz (a high-temperature polymorph), coesite (a high-pressure poly-morph), and stishovite (a high-temperature, high-pressure polymorph). Many of these polymorphs are thermodynami-cally close in energy to each other.
Unsurprisingly, quartz and its polymorphs have been subject to extensive theoretical and experimental studies2–4 though there is still some discussion as to the phase changes that quartz undergoes with pressure, such as the recent work by Atkins and Ahrens who used early shock wave data along with recent discoveries of post-stishovite phases of SiO2 to
reassign the phase transition regions along the Hugoniot of quartz.5 However, theoretical shock wave studies have been
limited.6,7Static pressure, diamond anvil cell experimental
x-ray diffraction data for quartz have been gathered by Hem-leyet al.3They found that their samples showed the onset of
amorphisation between 25 and 35 GPa (at 300 K). This amor-phisation has also been shown in molecular dynamics (MD) simulations.7
The simulation technique and choice of empirical poten-tial is essenpoten-tial, and for silicates, many researchers choose the
a)Author to whom correspondence should be addressed. Electronic mail:
matthew.farrow@ed.ac.uk.
well-known semi-empirical potential of van Beest, Kramer, and van Santen; the so-called BKS potential.1 This poten-tial is predominantly used for equilibrium simulations,4,8and includes point charges and a Buckingham-type pair poten-tial which becomes unphysical (infinitely attractive) at small interatomic separations. This is catastrophic for the high-pressures achieved during shock wave simulations, and so re-searchers have corrected for this unphysical response, such as Barmeset al.6who have used a second-order polynomial fit, whereas Guissani and Guillot9 have added a Lennard-Jones
type potential.
There are a number of alternative simulation methods available to obtain the Hugoniot; Brennan and Rice10 have
adapted the methodology of Erpenbeck11 in which a point
on the Hugoniot curve is calculated from single simulations (MD or Monte-Carlo) that each calculate an equation of state point. Mailletet al.have created the so-called uniaxial Hugo-niostat method12 which is an equilibrium molecular
dynam-ics method that uses perturbed equations of motion that obey the Rankine-Hugoniot relations. In this way, the equilibrium MD simulations result in the long-time relaxed structure after shock compression. A modified Hugoniostat has been used with some success by Raveloet al.13and Barmeset al.6
In this study we have developed atomistic non-equilibrium molecular dynamics (NEMD) techniques to sim-ulate the non-equilibrium state experienced during shock compression for materials that contain point charges, such as in the BKS potential. We use atomistic NEMD simula-tions to give direct information on the mechanisms at play at the atomic scale, and the underlying mechanisms of the phase transformations. We believe that this is the first com-plete shock wave simulation study that uses a geometry op-timised system of a polar slab along with an impactor to generate the shock wave in a three-dimensional (3D) system employing periodic boundary conditions (PBCs). Within the
044508-2 M. R. Farrow and M. Probert J. Chem. Phys.135, 044508 (2011)
three-dimensional PBC the computationally efficient Ewald summation scheme was used to correctly handle the long-range Coulomb interactions. We demonstrate our simulation technique by computing the Hugoniot of quartz up to pres-sures of 400 GPa. Such prespres-sures are extremely high, and do not correspond to equilibrium Earth mantle conditions at which quartz is naturally occurring, but they are in the range found for meteorite impacts.14
The paper is structured as follows: First, we discuss the details of the simulations; the initial optimisation of the atomic structure to form a semi-infinite slab model, followed by the subsequent relaxation of the dipole moment of the po-lar surface. We then apply the scheme to perform shock wave simulations on quartz, and discuss the results and implications for our choice of semi-empirical potential.
II. SIMULATION DETAILS
All the simulations were performed using molecular dy-namics in the micro-canonical ensemble (NVE) with PBC and used a velocity-Verlet integrator. The interatomic potential used was the so-called BKS potential of van Beest, Kramer, and van Santen:1
UBKS(r)=
i>j qαiqβj
rαiβj
−
i>j
Aαiβjexp(−bαiβjrαiβj)−
Cαiβj
rα6
iβj
, (1)
whereαandβare atomic species and the first term describes the long-ranged electrostatic interaction between atomsiand
j which is determined by the species-dependent effective charges qα andqβ. The second term is the short-ranged
in-teractions in a Buckingham-type form, whereAαβ,bαβ, and Cαβ are constants derived from the fitting to Hartree-Fock ab-initiocalculations on aluminophosphates and selected em-pirical measurements. These force-field parameters have been shown to be reasonably successful in describing the dy-namic and structural properties of quartz and some of its polymorphs.4,8 The parameters used by van Beestet al.are
reproduced in TableI. A cut-off radius of 6.0 Å was used for both the silicon–oxygen bonds and oxygen–oxygen bonds, re-spectively. The problem of long-range Coulomb forces with PBCs was handled by using an Ewald summation.
[image:3.612.315.559.74.123.2]The second term in the BKS potential has an unphysi-cal maximum at small bond lengths. The large compressions that can occur during shock wave simulations cause the BKS potential to fail (become infinitely attractive), so it is wise to correct for this unphysical response. We have replaced this part of the BKS potential at the point of inflection with the
TABLE I. Reproduction of the fit parameters of van Beestet al.for the BKS
potential. (See Ref.1.)
αiβj Aαiβj(eV) bαiβj(Å
−1) C
αiβj(eV Å
6) q
Si–O 18003.7572 4.87318 133.5381 qSi=2.40
O–O 1388.77300 2.76000 175.0000 qO= −1.2
TABLE II. Numerical values of the parameters used for correcting the BKS pair potential at small bond lengths.
αiβj Dαβ(eV Å2) Eαβ(eV Å6) Fαβ(eV)
Si–O 24.1700 23.8086 −3.5872
O–O 12.3435 18.9662 −6.9426
following polynomial form:
Uext(r)=
i>j Dαiβj
rα2
iβj
+Eαiβj
rα6
iβj
+Fαiβj, (2)
whereDαβ,Eαβ, andFαβare calculated analytically to match
the BKS pair potential and its first and second derivatives, at the point of inflection. Table IIgives numerical values of these parameters. This 2–6 form was chosen as it provided a Lennard-Jones-like repulsion at short distances whilst having a numerically convenient form and matches smoothly onto the original BKS Buckingham term. Figure1shows the form of the Buckingham term in the BKS potential and shows the smooth transition region from BKS to our extension. There-fore, our modified short-ranged interaction potential has the following form:
U(r)= ⎧ ⎪ ⎪ ⎨ ⎪ ⎪ ⎩
Uext(r), r≤rinf Ubks(r), r > rinf ≤rcut
0, r > rcut
, (3)
where rinf is the point of inflection. For the Si–O and O–
O parts of the BKS potential, rinf was 1.35 Å and 1.98 Å,
respectively.
The systems studied contained 1584 and 3600 atoms of
α-quartz (4×4×11 and 4×4×25 unit cells, respectively). The systems were equilibrated to 300 K using a Berendsen weak-coupling thermostat and were then further equilibrated for 2 ps using standard NVE dynamics before the shock wave was initiated. Initially, we generated a shock wave in the sys-tem by giving all of the atoms in the syssys-tem a “piston veloc-ity” of−uptowards a so-called momentum mirror.15This
cre-ated a shock wave that propagcre-ated in the positive z-direction at velocity us. The momentum mirror technique essentially
[image:3.612.53.298.700.749.2]-40 -20 0 20 40 60
0 0.5 1 1.5 2 2.5 3 3.5 4
Energy (eV)
r (angstroms)
[image:4.612.135.475.52.299.2]Si-O Si-O extension O-O O-O extension
FIG. 1. Plot of the interatomic potential used in this work. Dashed lines show the unphysical behaviour of the original BKS potential at small interatomic distances.
“sample” atoms (i.e., those atoms in the system that were not the flyer-plate), each atom in the flyer-plate was given a large mass of 100 times its usual mass. The piston velocities were in multiples of the sound velocity,c0, and the simulations ran
until the system reached the shocked state. A schematic of the system can be seen in Fig.2. As can be seen in the schematic, a vacuum gap between the end of the sample atoms and the start of the flyer-plate atoms is essential to ensure that no in-teractions via PBC affected the simulations. We set our gap to be larger than the cut-off radius of the BKS potential (6 Å); however, long-range Coulomb forces were still present which created a large dipole moment in this polar system.
This was accounted for by performing a geometry opti-misation on the system and correcting the Ewald summation to that of the aperiodic 3D limit. This correction, proposed by Yeh and Berkowitz,16 is more computationally efficient than
[image:4.612.57.294.587.704.2]using a 2D Ewald summation alone. The method, denoted here as EW3DC simply applied as an additive correction to
FIG. 2. Schematic of a shock wave system. Sample atoms are given an initial velocity,up, towards the stationary flyer-plate. Periodic boundary conditions
are used; therefore, a vacuum region removes unwanted interactions between the end surfaces.
the 3D Ewald summation energy and forces; the energy cor-rection, J(M,P) is dependent on the total dipole moment M and the shape (P). Our system had the geometry of a rectan-gular plate (P =R) and hence our energy correction term is given by
J(M, R)= 2π
VM
2
z, (4)
andMis given by
M=
N
i=1
qiri. (5)
A correction is also applied to the force calculation, obtained by differentiation of the energy term. Figure3shows the con-vergence to the aperiodic long-range limit of the 3D Ewald summation using EW3DC. It was clear that a small vacuum gap (but greater than the cut-off of the Buckingham term of the BKS potential) would be acceptable.
A. Geometry optimisation and static compression
Before starting any MD simulations, it is essential to have a relaxed and stable system. Making a quartz slab by cleav-ing bulk quartz creates a large and unphysical dipole moment, which strongly effects the energetics of the system. Hence, the systems were first relaxed using a quasi-Newtonian optimi-sation algorithm along with the EW3DC which removed the dipole moment that was initially present. Figure4shows how the optimisation removed the dipole moment of the system after 50 steps and from there continued to relax the system to its final state. The final relaxed structure had negligible dipole moment across the slab.
044508-4 M. R. Farrow and M. Probert J. Chem. Phys.135, 044508 (2011)
0 500 1000 1500 2000
Length of vacuum gap (angstroms)
-125 -120 -115 -110
Ener
gy (eV)
Ewald 3D
[image:5.612.54.298.49.218.2]Ewald 3D - with Correction
FIG. 3. The energy of Ewald 3D with correction (EW3DC) converges to the aperiodic long-range limit of the 3D Ewald summation technique.
The structure that was found was that of β-quartz, a high-temperature polymorph of quartz. To investigate why this polymorph was observed a series of static pressure calcula-tions were performed, isotropically compressing bulk quartz. Figure 6 shows the pressure-volume curve of the static compression simulations and Fig.7shows the c/a ratio of the relaxed structure as a function of pressure. It can be seen that at 6 GPa the system undergoes a phase change. Analysis of the structure of the system prior to this phase change showed that the low-pressure phase isβ-quartz and the high-pressure phase isα-quartz. van Beestet al.1also noted that their BKS potential gaveβ-quartz as the zero pressure low temperature phase. In this regard, it is worth noting that there are other potentials available. Using the so-called Tsuneyuki, Tsukada, Aoki, and Matsui (TTAM) potential17that has a similar form
to BKS (although a little more computationally expensive), researchers have found that the temperature of the α-β
0 25 50 75 100 125 150
Geometry optimisation iteration -100
0 100 200 300 400 500 600
Dipole moment (C
Å
[image:5.612.317.560.51.230.2])
FIG. 4. Dipole moment with geometry optimisation steps. The dipole mo-ment of the system is negligible after 50 steps.
0 5 10 15 20 25
g(r)
0 2 4 6
Distance (Å) 0
5 10 15
g(r)
0 2 4 6
Distance (Å) RDF of -quartz
FIG. 5. Radial distribution function of quartz after geometry optimisation. As can be seen from the RDF ofβ-quartz (inset) the system is in theβ-quartz phase prior to shock compression.
phase transition is reproduced accurately.18 The Tangey and
Scandolo (TS) potential19 has also been shown to give good agreement with the experimental c/a ratio and theα-β phase transition in quartz. All of the potentials have their good and bad points, and interested readers are referred to the study by Herzbach et al.18 for a comparison between the popular silicate potentials.
The two structures of quartz are shown in Fig.8. This un-physical transition means that at low temperatures a pressure of 6 GPa or greater is required to maintainα-quartz in this phase when using the BKS potential. We saw no evidence for the onset of amorphisation between 20 and 30 GPa which has been reported previously.7,20
III. RESULTS
Figure 9shows the piston (up) and shock (us) velocity
Hugoniot. As can be seen from the figure, the piston and cor-responding shock velocities are large but are easily achieved
0 5 10 15 20 25 30 35
Pressure (GP
a)
0.75 0.8 0.85 0.9 0.95 1
Specific Volume (V/V0)
[image:5.612.59.294.499.724.2] [image:5.612.318.557.542.714.2]1.1 1.11 1.12 1.13 1.14 1.15 1.16
c/a ratio
0 10 20 30 Pressure (GPa)
FIG. 7. c/a ratio during static compression. The discontinuity at 6 GPa
cor-responds to the phase transformation fromβ→αquartz.
in the laboratory. Such shock conditions also occur naturally, for instance, at the site of a meteorite impact—which is how the high pressure polymorph stishovite was first discovered. Meteorites have a mean impact velocity14 of between 17 and 20 km/s but can be as low as 10 km/s—hence, this is an in-teresting regime to explore by simulation. A linear depen-dance of piston (up) to shock (us) velocity can clearly be seen.
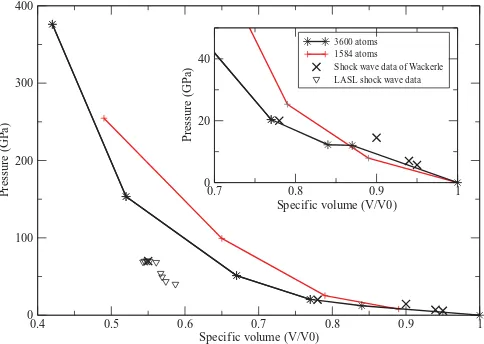
The calculations are repeated for both 1584 and 3600 atom systems and there is no evidence of finite size effects. The corresponding pressure-volume Hugoniot for the shock wave compression calculations are shown along with experimental data from Wackerle2 and Los Alamos Scientific Laboratory
(LASL) data of Marsh21in Fig.10. Our Hugoniot gives
[image:6.612.56.296.49.221.2]rea-sonable agreement to the experimental data at low pressures (small piston velocities) up to 25 GPa, but at higher pressures it deviates significantly. Whilst there is some evidence of a finite-size effect in this figure, it is unlikely that this is suf-ficient to explain the discrepancy at high pressures. Instead, this deviation is most likely due to the high-pressure polyno-mial fit to the BKS potential; as at these pressures this part of the pair-potential term is sampled frequently and thus we can conclude that the fit yields a response that is too stiff. As this polynomial fit does not have any physical justification, it could be possible to “tune” the fitting parameters to yield a much better agreement with the experimental Hugoniot. How-ever, this would be effectively making a high-pressure poten-tial due to the frequency of it being sampled during the simu-lations and the form may not be transferable to other silicates or polymorphs of quartz. Therefore, it is safer to conclude
FIG. 8. Quartz structures: left,α-quartz and right,β-quartz. The higher sym-metry ofβ-quartz can be seen.
0 5 10 15 20
V
elocity of shock w
av
e (km/s)
0 5 10 15 20
Piston velocity (km/s) 1584 atoms
[image:6.612.313.558.51.225.2]3600 atoms
FIG. 9. up-usHugoniot of quartz for 1584 and 3600 sample atom systems.
A linear dependence of shock wave velocity with piston velocity is clear, with no evidence for any finite-size effects.
that at such high-pressures, that are far from equilibrium, the BKS potential breaks down and should not be considered a useful potential for these conditions. It is possible that a re-parameterisation of the potential at these high-pressure con-ditions incorporating this sort of empirical shock-wave data may yield a better potential for shock wave simulations.22As
it stands, our results appear to be reliable up to 25 GPa, which is sufficient for modelling the terrestrial geothermal states of quartz, but progressively deteriorate at higher pressures. The rapid increase in temperature along the Hugoniot of quartz (1584 atoms) can be seen in Fig. 11. At such high temper-atures it is unsurprising that the resultant structure is amor-phous as the temperature is vastly greater than the melting point of any of the quartz polymorphs.
At maximum shock compression the system was in an amorphous state as can be seen from the RDF in Fig.12. This was generated from a shock wave that was initiated by a 3 km/s piston velocity (corresponding to half the speed of sound inα-quartz). This shocked structure does not correspond to stishovite, although it is possible that if it was allowed to
0 100 200 300 400
Pressure (GP
a)
0.4 0.5 0.6 0.7 0.8 0.9 1
Specific volume (V/V0) 3600 atoms 1584 atoms Shock wave data of Wackerle LASL shock wave data
0 20 40
Pressure (GP
a)
0.7 0.8 0.9 1
Specific volume (V/V0)
FIG. 10. P-V Hugoniot of α-quartz. Experimental data from Wackerle
[image:6.612.316.558.552.724.2] [image:6.612.50.306.641.725.2]044508-6 M. R. Farrow and M. Probert J. Chem. Phys.135, 044508 (2011)
0.6 0.7 0.8 0.9 1 Specific volume (V/V0)
0 5000 10000 15000 20000 25000 30000
Te
[image:7.612.321.559.47.220.2]mperature (K)
FIG. 11. Temperature variation along the Hugoniot of quartz (1584 atoms).
equilibrate over a long period of time with slow cooling, that stishovite might form. However, such long time scales are not achievable in this type of molecular dynamics. We can, how-ever, derive some knowledge about the adiabatic response of the system after the shocked state has been generated by cal-culating the decompression isentrope.
The calculated Hugoniot is well represented by the fol-lowing equation:
P =Aexp (Bv), (6)
where A=11 112 GPa,B= −8.1245, andv is the specific volume (V/V0). This form was used to calculate the release isentropes from various release points, v+, using the follow-ing relation between the Hugoniot and an isentrope:23
Pγ(v)=χc(v) p++ v
v+ κc(v′) χc(v′)
dv′
, (7)
FIG. 12. Radial distribution function ofα-quartz at maximum shock
com-pression using a 3 km/s piston velocity. The amorphous structure can be clearly seen.
where
κc(v)=
1 2
γr vr
PH(v)+ 1−1 2
γr vr
(vr−v)
dPH(v)
dv (8)
and
χc(v)=exp γr vr
(v+−v)
. (9)
Pγ(v) is the isentropic pressure,PH(v) is the Hugoniot pres-sure,p+
is the Hugoniot pressure at specific volume v+at release, centered on specific volumevr.γ(v) is the Gruneisen
parameter; taken to be 0.659 from Quareniet al.24Figure13
shows our calculated isentropes from the fit to the Hugoniot. There is little deviation from the Hugoniot at small compres-sions, up tov+ =0.80, corresponding to an initial Hugoniot
0.5 0.6 0.7 0.8 0.9 1
v/v0 0
50 100 150 200
P (GP
a)
v+ = 0.50 v+ = 0.55 v+ = 0.60 v+ = 0.65 v+ = 0.70 v+ = 0.80 v+ = 0.90 Hugoniot
0.7 0.8 0.9 1
[image:7.612.55.297.52.220.2]0 10 20 30
[image:7.612.90.495.430.722.2]pressure of 20 GPa. However, at larger compressions (and higher pressures) the deviation grows considerably.
IV. CONCLUSION
We have performed atomistic non-equilibrium molecular dynamics simulations of shock wave compression on quartz. We chose the widely used BKS interatomic potential. How-ever, in order to avoid complications with the unphysical be-haviour at high pressures in the pair-interaction part of the BKS potential, we created a simple (2,6) polynomial expres-sion with an analytically determined fit to the BKS potential at the point of inflection and its derivatives. Our systems were periodic in three-dimensions but had a vacuum gap between the end of the sample atoms and the start of the flyer-plate atoms as a means of preventing unwanted interactions due to periodic boundary conditions. We used the Ewald summation correction for 3D systems as proposed by Yeh and Berkowitz as a means of allowing a geometry optimisation to be suc-cessfully performed, in order to eliminate the dipole moment caused by cleaving a slab from bulk quartz. The optimised structure was found to be that of the high-temperature poly-morphβ-quartz and notα-quartz. We found a phase change fromβ →αquartz at 6 GPa by performing static compres-sion calculations. Our analysis of the radial distribution func-tions showed that the shock compression of quartz formed an amorphous phase.
The calculated Hugoniot of quartz gave a reasonable agreement to experimental data for modest shock velocities, up to a pressure of 25 GPa. For the terrestrial geotherm, this corresponds to a depth of∼700 km which is beyond the re-gion in which quartz is believed to be found. The agreement significantly deviated at higher pressures and larger shock ve-locities. This was reasoned as due to a breakdown of the BKS potential and due to the polynomial fit (for high-pressures) that gave a response that was too stiff. Using an alternative po-tential (such as TTAM or TS) may avoid this problem; how-ever, they should first be investigated for their suitability. A re-parameterisation of the BKS potential for high-pressures
would be expected to provide a suitable potential for shock wave simulations.
We conclude that the BKS potential, in the modified form we propose, is suitable for quartz under representative pres-sure conditions of the Earth core, but is unsuitable for high-pressure shock wave simulations.
ACKNOWLEDGMENTS
The authors would like to thank the Engineering and Physical Sciences Research Council (EPSRC) for financial support.
1G. J. Kramer, N. P. Farragher, B. W. H. van Beest, and R. A. van Santen,
Phys. Rev. B43, 5068 (1991).
2J. Wackerle,J. Appl. Phys.33, 922 (1962).
3R. J. Hemley, A. P. Jephcoat, H. K. Mao, L. C. Ming, and M. H. Manghnani,
Nature (London)334, 52 (1988).
4V. V. Murashov and I. M. Svishchev,Phys. Rev. B57, 5639 (1998).
5J. A. Akins and T. J. Ahrens,Geophys. Res. Lett.29, 1394 (2002).
6F. Barmes, L. Soulard, and M. Mareschal,Phys. Rev. B73, 224108 (2006).
7J. S. Tse and D. D. Klug,Phys. Rev. Lett.67, 3559 (1991).
8H. Kimizuka, H. Kaburaki, and Y. Kogure,Phys. Rev. B67, 024105 (2003). 9Y. Guissani and B. Guillot,J. Chem. Phys.104, 7633 (1996).
10J. K. Brennan and B. M. Rice,Mol. Phys.101, 3309 (2003).
11J. J. Erpenbeck,Phys. Rev. A46, 6406 (1992).
12J. B. Maillet, M. Mareschal, L. Soulard, R. Ravelo, P. S. Lomdahl,
T. C. Germann, and B. L. Holian, Phys. Rev. E63, 016121 (2001).
13R. Ravelo, B. L. Holian, T. C. Germann, and P. S. Lomdahl,Phys. Rev. B
70, 014103 (2004).
14H. J. Melosh and G. S. Collins,Nature (London)434, 157 (2005).
15B. L. Holian,Phys. Rev. A37, 2562 (1988).
16I. C. Yeh and M. L. Berkowitz,J. Chem. Phys.111, 3155 (1999).
17S. Tsuneyuki, M. Tsukada, H. Aoki, and Y. Matsui,Phys. Rev. Lett.61,
869 (1988).
18D. Herzbach, K. Binder, and M. H. Muser,J. Chem. Phys.123, 124711
(2005).
19P. Tangney and S. Scandolo,J. Chem. Phys.117, 8898 (2002). 20V. V. Murashov,Phys. Rev. B53, 107 (1996).
21LASL Shock Hugoniot data, edited by S. Marsh (University of California,
Berkeley, 1980).
22M. R. Farrow, “Computer simulation of shock waves in condensed matter,”
Ph.D. dissertation (The University of York, 2009).
23L. Davison,Fundamentals of Shock Wave Propagation in Solids
(Springer-Verlag, Berlin/Heidelberg, 2008).