https://doi.org/10.1016/j.visres.2009.11.011
[email protected] https://eprints.whiterose.ac.uk/
Reuse
Items deposited in White Rose Research Online are protected by copyright, with all rights reserved unless indicated otherwise. They may be downloaded and/or printed for private study, or other acts as permitted by national copyright laws. The publisher or other rights holders may allow further reproduction and re-use of the full text version. This is indicated by the licence information on the White Rose Research Online record for the item.
Takedown
If you consider content in White Rose Research Online to be in breach of UK law, please notify us by
Contextual effects in speed perception may
occur at an early stage of processing
Daniel H. Baker* and Erich W. Graf.
School of Psychology, University of Southampton, Highfield, Southampton, SO17 1BJ, UK
* Present address
: School of Life & Health Sciences, Aston University, Aston Triangle,
Birmingham, B4 7ET, UK,
: [email protected].
Abstract
How does nearby motion affect the perceived speed of a target region? When a central drifting Gabor patch is surrounded by translating noise, its speed can be misperceived over a fourfold range. Typically, when a surround moves in the same direction, perceived centre speed is reduced; for opposite direction surrounds it increases. Measuring this illusion for a variety of surround properties reveals that the motion context effects are a saturating function of surround speed (Experiment I) and contrast (Experiment II). Our analyses indicate that the effects are consistent with a subtractive process, rather than with speed being averaged over area. In Experiment III we exploit known properties of the motion system to ask where these surround effects impact. Using 2D plaid stimuli, we find that surround‐induced shifts in perceived speed of one plaid component produce substantial shifts in perceived plaid direction. This indicates that surrounds exert their influence early in processing, before pattern motion direction is computed. These findings relate to ongoing investigations of surround suppression for direction discrimination, and are consistent with single‐cell findings of direction‐tuned suppressive and facilitatory interactions in primary visual cortex (V1).
Keywords: speed perception, surround suppression, facilitation, plaid.
1 Introduction
Estimation of visual motion is a difficult task. The visual system must integrate information over area (e.g. Amano, Edwards, Badcock & Nishida, 2009; Webb, Ledgeway & McGraw, 2007) and time (e.g. Purves, Paydarfar & Andrews, 1996; Mather & Challinor, 2009) in order to determine the speed and heading of a moving object. In some situations, there are multiple potentially valid solutions for a single motion sequence, such as in the well‐known motion aperture problem (e.g. Adelson & Movshon, 1982), and in bistable motion displays (Hupé & Rubin, 2003; Ramachandran & Anstis, 1983).
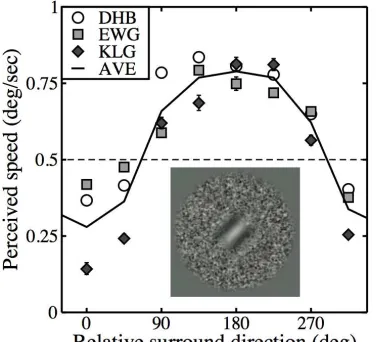
Recently, we (Baker & Graf, 2008) revisited a well‐known motion phenomenon, in which the perceived speed of a drifting target region is greatly affected by motion in the surround (Loomis & Nakayama, 1973; Walker & Powell, 1974; Tynan & Sekuler, 1975; Nawrot & Sekuler, 1990; Bressan, 1991; Norman, Norman, Todd & Lindsey, 1996; Li, Mollon & Bosten, 2009; Wertheim & Paffen, in press). Consistent with previous findings, we reported that surround motion in a similar direction to the central target reduces perceived speed, but motion in the opposite direction increases perceived speed (though see Norman et al., 1996). The data shown in Figure 1 are replotted from Baker & Graf (2008; Figure 3 therein) and illustrate the phenomena and stimuli used.
Figure 1: Perceived speed data and stimuli from Baker & Graf (2008). Perceived speed was measured using a speed matching task, for a range of surround directions, and is shown for three observers (symbols) and their average (line). Methodological details are given in Baker & Graf (2008). Note that our study used a central grating stimulus surrounded by a noise texture (see inset), whereas most previous studies had used dot motion. The physical speed of both centre and surround was always 0.5deg/sec (dashed line).
Because our previous study was ultimately concerned with binocular rivalry, we did not exhaustively investigate the surround motion phenomenon. In common with previous authors (e.g. Tynan & Sekuler, 1975; Paffen, te Pas, Kanai, van der Smagt & Verstraten, 2004), we attributed the effects to the suppressive and facilitatory phenomena reported by single‐cell studies (see next section). This remains a plausible mechanism, although there are multiple candidate neural loci for where the suppression impacts. Furthermore, the purpose of surround‐induced speed changes is not clear. In this paper we aim to characterise the algorithm implemented by surround suppression and facilitation, and place limitations on its possible stage of influence.
1.1 Explaining changes in perceived speed
Neural suppression has been proposed as the mechanism by which surrounds affect psychophysical detection thresholds (Petrov et al., 2005; Ishikawa, Shimegi & Sato, 2006; Saarela & Herzog, 2008), perceived contrast (Cannon & Fullenkamp, 1991; Snowden & Hammett, 1998; McDonald & Tadmor, 2006), direction discrimination (Tadin, Lappin, Gilroy & Blake, 2003), the motion aftereffect
Movshon, 2003; Webb, Tinsley, Barraclough, Parker & Derrington, 2003; Webb, Dhruv, Solomon, Tailby & Lennie, 2005; Smith, Bair & Movshon, 2006; Tailby, Solomon, Peirce & Metha, 2007; Shen, Xu & Li, 2007) and in extra‐striate areas such as the middle temporal (V5/MT and MST) regions (Allman, Miezin & McGuinness, 1985a, 1985b; Raiguel, van Hulle, Xiao, Marcar & Orban, 1995; Xiao, Raiguel, Marcar, Koenderink & Orban, 1995; Eifuku & Wurtz, 1998; Xiao, Raiguel, Marcar & Orban, 1998; Born, 2000; Pack, Hunter & Born, 2005). In both anatomical regions, direction‐tuned suppression has been reported, typically being greatest in the neuron’s preferred direction (e.g. Levitt & Lund, 1997; Eifuku & Wurtz, 1998; Jones et al., 2001).
[image:3.595.89.278.72.243.2]
For models in which perceived speed is calculated from the ratio of two differentially tuned populations (e.g. Harris, 1986), modifying the output of only one such population could influence the final speed readout in either direction.
The purpose of firing rate changes might be similar to those proposed for other gain control processes, such as keeping neurons within their optimal firing range (Albrecht & Geisler, 1991; Heeger, 1992), efficient population coding strategies (Schwartz & Simoncelli, 2001), and promoting a normalized (contrast‐invariant) response to a given velocity. However, there are other considerations specific to motion estimation, for which surround information may be of use.
For example, one explanation for perceived speed shifts is that the estimate of centre speed is determined relative to the speed of the background. Such a computation would have obvious ecological value, providing information about absolute object motion during self‐motion (which produces background optic flow), and aiding in object segregation (Nakayama & Loomis, 1974; Shen, Xu & Li, 2007). Support for this explanation comes from studies of induced motion, in which a static target appears to move when embedded in a moving background (e.g. Ido, Ohtani & Ejima, 1997; Nishida, Edwards & Sato, 1997), as well as the finding that stationary references influence perceived speed (Gogel & McNulty, 1983; Blakemore & Snowden, 2000; Nguyen‐Tri & Faubert, 2007).
The simplest version of this scheme is that perceived speed equals the difference between the velocities of target and background. Surrounds moving in the opposite direction would then increase perceived speed, and vice versa, qualitatively consistent with the data in Figure 1. More complex accounts might involve computational models in which speed is subject to some nonlinear transform (e.g. Georgeson & Scott‐Samuel, 1999; Dakin & Mareschal, 2000) prior to subtraction. Experiment I provides a direct test of these hypotheses over a range of surround velocities.
An additional stimulus variable which can affect perceived speed is stimulus contrast. When matching to a high‐contrast standard,
stimuli of low contrast appear to move slower (Thompson, 1982; Gegenfurtner & Hawken, 1996). Since surrounds can also reduce perceived contrast (e.g. Canon & Fullenkamp, 1991; Snowden & Hammett, 1998; Xing & Heeger, 2000), it is conceivable that the ‘effective’ contrast of the centre mediates the changes in perceived speed.
1.2 Stage of influence
One of the most extensively researched aspects of motion processing is the combination of 1D motion vectors into 2D pattern motion estimates. One view is that the former occurs in primary visual cortex (V1), and the latter in higher visual areas such as MT (Movshon, Adelson, Gizzi & Newsome, 1985; Simoncelli & Heeger, 1998; Majaj, Carandini & Movshon, 2007). Indeed, a recent rTMS study (Thompson, Aaen‐ Stockdale, Koski & Hess, 2009) demonstrated a double dissociation between these two areas for perception of component and pattern motion. However, this is a controversial issue, and there is also evidence that pattern motion may be computed by tracking feature motion (Bowns, 1996; Georgeson & Scott‐Samuel, 2000), perhaps prior to area MT (e.g. Tinsley et al., 2003; Pack et al., 2003). We proceed on the assumption that pattern motion computation is a two‐stage process, and defer consideration of the alternatives to the Discussion section.
Psychophysically, pattern motion integration has been investigated using plaid stimuli (Adelson & Movshon, 1982), with perceived pattern direction being determined by the properties (speed, direction, contrast, spatial frequency) of the plaid components over a wide range of stimulus parameters (Ferrera & Wilson, 1990; Yo & Wilson, 1992; Kim & Wilson, 1993; Bowns, 1996). Do our perceived speed effects occur before or after this pattern direction is computed? If they occur earlier in motion computation, then surrounds should affect the perceived direction of plaid motion, as though the components had altered physical speeds (see Welch, 1989). If surrounds impact at or after pattern motion is calculated, perceived plaid direction could remain unaffected by surround motion. We test these possibilities in Experiment III.
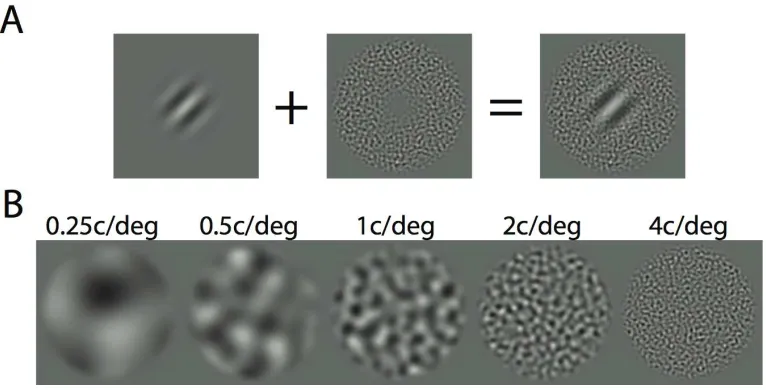
Figure 2: Example stimuli. Row A shows a Gabor patch, a windowed noise texture, and their sum. Row B shows example noise textures at each spatial frequency, as used in Experiment I.
1.3 Summary
We have described a number of potential explanations as to how and why surrounds influence perceived speed. In the current study, we sought to narrow down these possibilities by measuring changes in perceived speed across a variety of spatiotemporal conditions (Experiment I). A second experiment investigated the influence of surround contrasts. Finally, we utilised 2D target stimuli (plaids) to probe the stage at which surround motion impacts speed estimates.
2 General methods
2.1 Equipment & stimuli
All stimuli were displayed on an Ilyama VisionMaster 500 CRT monitor, controlled by an Apple Macintosh computer. The monitor was gamma corrected using standard techniques, and had a refresh rate of 85Hz. Stimuli were created in Matlab (The Mathworks Ltd.), and displayed using elements of the Psychophysics Toolbox software (Brainard, 1997; Pelli, 1997)
The basic stimulus was a 1c/deg Gabor patch with an envelope width (FWHH) of 1.5º, and Michelson contrast of 50% (see Fig 2A). Surround textures were luminance noise, filtered in the Fourier domain using isotropic octave‐bandwidth filters (where spatial frequencies are given, these indicate
the centre frequency of the filter). The surrounds were multiplied by the inverse of the spatial Gaussian envelope used to generate the Gabor patch, leaving a ‘notch’ in the centre of the noise (see Fig 2A). Surround textures had an RMS contrast of 10% (except in Experiment II where this was manipulated) and were spatially windowed by a raised cosine envelope 6º in diameter. Example surround stimuli are shown in Figure 2B. In Experiment III, the envelopes for centre and surround were twice as large, to increase the number of grating cycles available for plaid motion direction judgements.
2.2 Procedure
[image:5.595.107.490.87.282.2]
[image:6.595.90.504.82.234.2]
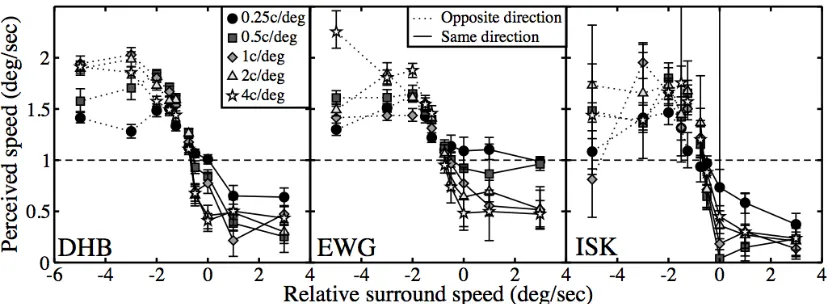
Figure 3: Perceived speed of a central target plotted as a function of relative surround speed. Symbols represent spatial frequencies, and line types indicate whether the surround moved in the same (solid) or opposite (dotted) direction to the target. The dashed horizontal line gives the true speed of the target. Data are shown for two observers, with error bars denoting 95% confidence limits of the PSE.
3 Experiment I: spatiotemporal
tuning
3.1 Methods
The PSE for speed was measured using a matching task. On each trial, two stimuli were displayed offset by 4º either side of a central fixation cross. This offset was chosen so that stimulus motion was less likely to produce involuntary eye‐movements, and because surround effects are often most apparent in the periphery (e.g. Xing & Heeger, 2000; Petrov, Carandini & McKee, 2005). One stimulus was the target; it always drifted at the same speed (1deg/sec) and was surrounded by a translating noise texture. The other stimulus was the match; it had no surround and its speed was determined by a 1‐up 1‐down staircase procedure (Meese, 1995). The target and match were always orthogonal to each other (±45º from vertical). The task was to indicate using the keyboard which grating patch appeared to move faster (left or right). Stimuli were presented for one second, and lateral positioning of target and match was randomly determined on each trial. We measured perceived target speed for a range of surround speeds (0.25, 0.5, 1, 2 & 4deg/sec) and spatial frequencies (0.25, 0.5, 1, 2 & 4c/deg), for two relative surround directions, giving a total of 50 conditions.
Each block of trials comprised two interleaved staircase pairs, which tracked thresholds for same‐direction surrounds (one pair) and opposite‐direction surrounds (one pair), at a given surround speed and
spatial frequency. Within each pair, one staircase began above and one below the physical speed of the target. The staircase step size was 0.05 log units, and each staircase terminated after 50 trials, so blocks lasted for 200 trials (about 5 minutes). Observers completed the experiment twice, with blocks carried out in a random order. Experiment I was completed by both authors (DHB, EWG) and a postgraduate student (ISK) who was psychophysically experienced but naïve to the purpose of the experiment.
3.2 Results
Perceived target speeds are plotted as a function of relative surround speed in Figure 3, and conform approximately to a sigmoidal shape. When the surround moves in the same direction as the centre at the same or greater speed (i.e. relative speeds >=0) perceived speed is reduced, often substantially. For slower same‐direction surrounds, and surrounds moving in the opposite direction to the centre (negative relative speeds), perceived speed typically increased by up to a factor of 2. These trends are evident at all spatial frequencies, and for all observers (though observer ISK’s data are somewhat noisier). There is little variability at the extremes of each function, suggesting that the effects have saturated at these faster speeds.
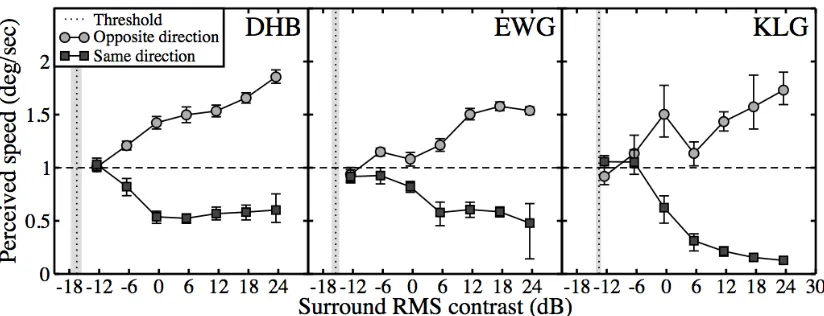
Figure 4: perceived speed as a function of surround contrast. Speed matches are shown for different surround contrasts, and two relative surround directions. The vertical dotted lines are the direction discrimination contrast threshold for the surround noise texture. Grey shaded regions and error bars give 95% confidence limits of threshold and PSE values.
(solid‐line functions which rise above the dashed line of unity). This may relate to reports that perceived speed increases in the presence of a static background texture (Nguyen‐Tri & Faubert, 2007).
4 Experiment II: effect of
surround contrast
One hallmark of psychophysical surround suppression is that it saturates at higher surround contrasts, both for detection (Meese, Challinor, Summers & Baker, in press; Petrov et al., 2005; Ishikawa et al., 2006) and direction discrimination (Betts, Taylor, Sekuler & Bennett, 2005; but see Aaen‐Stockdale, Thompson, Huang & Hess, 2009) thresholds. There is also evidence of saturation in single‐cell studies (Webb et al., 2005) and in the phenomenon of crowding (Pelli, Palomares & Majaj, 2004). We consider whether this is also the case for perceived speed changes. This is of particular interest, as strong saturation at the surround contrasts used in Experiment I would reduce the likelihood that the observed differences in effect size are due to differences in the effective surround contrast.
4.1 Methods
Perceived speed of a central grating was measured as a function of surround contrast for a single surround speed (2deg/sec) and spatial frequency (4c/deg). This condition was chosen because it produced substantial effects in Experiment I, and was of a sufficiently different spatial frequency to the target (1c/deg) to ensure clear
segmentation. The speed matching procedure was as described for Experiment I. Experiment II was completed by both authors (DHB, EWG) and a postgraduate student (KLG) who was familiar with the task from a previous study (see Figure 1).
A direction discrimination contrast threshold was also measured for the surrounding noise, using a Bits++ box (Cambridge Research Systems Ltd., Kent, UK) to obtain 14‐bit contrast resolution. Thresholds were estimated using a standard two‐alternative direction (left/right) judgement task, with contrast controlled by a pair of 3‐down‐1‐up staircases. We express contrast in dB units, defined as CdB =
20 log10(RMS%), where RMS% is the root mean square contrast of the noise expressed as a percentage. This task was repeated three times by each observer.
4.2 Results
saturation, but consistently exhibits a much stronger suppressive effect (see also Figure 1). This could be due to individual differences in cortical inhibition (see Baker & Graf, 2009) or a different response strategy.
These findings are important for two reasons. Firstly, any evidence of saturation makes it highly unlikely that the effects reported in Experiment I are purely an artefact of surround detectability (the surround contrast in Experiment I was 20dB). Secondly, as discussed above, saturation at higher contrasts is a hallmark of other surround effects commonly attributed to suppression (and also of many V1 neurons to drifting stimuli; e.g. Albrecht & Hamilton, 1982). This supports the proposition that surround suppression underlies our effects.
5 Experiment III: plaid motion
We aimed to determine whether the surround effects that we have observed affect speed encoding before or after the computation of pattern motion. To do this, we used a drifting plaid stimulus presented with or without a surround. The two components of the plaid were oriented ±45º from vertical, so that for equal component speeds the plaid appeared to drift upwards. By varying the speed of one component and keeping the other fixed, the plaid direction shifted to the left or right of vertical, and observers reported the perceived direction at a range of component speeds.
5.1 Methods
We measured the PSE for perceived direction using central presentation (duration 1 second) of a single plaid stimulus (see Figure 5 for stimulus icons). Observers indicated on each trial whether the plaid appeared to be drifting to the left or to the right of vertical. The centre stimulus was created by superimposing the target and match stimuli from the perceived speed tasks (see above). Varying the ‘match’ speed (0.18 – 2.24deg/sec) about that of the ‘target’ (1deg/sec) produced biases in the perceived plaid direction about the vertical
axis. ‘Match’ speeds were allocated using the method of constant stimuli with a minimum of 50 trials per level. The surround had a spatial frequency of 4c/deg and a speed of 2deg/sec. It moved in either the same direction or the opposite direction to the fixed speed (‘target’) plaid component, and was thus always orthogonal to the variable speed (‘match’) component. We also included a condition in which the surround was absent, and trials were blocked by surround condition, yet interleaved for component speeds and counterbalanced for centre direction.
The three observers from Experiment II, as well as three additional observers participated in Experiment III. The additional observers varied in their level of psychophysical experience, but were naïve regarding the experimental hypotheses.
5.2 Results
Psychometric functions for the condition without a surround are shown in Figure 5A (white circles) for six observers. The upper abscissa indicates the speed of the variable component, and the lower abscissa gives the plaid direction calculated from the two physical component velocities by vector averaging (Yo & Wilson, 1992). PSE values indicating subjective vertical are given by the open symbols Figure 5B, with the middle bar showing the average. It is clear that without a surround (central bar of Figure 5B), all observers made veridical judgements of plaid direction, with thresholds close to 0º (dotted line).
Figure 5: perceived directions of plaid stimuli, with and without moving surrounds. Panels in A show individual psychometric functions for each observer in the three conditions. Curves are cumulative Gaussians estimated by Probit analysis, with grey regions enclosing 95% confidence limits of the threshold. Panel B shows threshold values at which the plaid appeared vertical for individual observers (symbols) and the average (bars), with error bars giving ±1SE. The horizontal dashed ‘Prediction’ lines are model predictions based on the data in Figure 1, as described in the text. Icons along the abscissa illustrate the stimuli, which in the experiments were counterbalanced about the vertical axis (arrows denote motion direction and were not present). Note that plaid direction was calculated by determining the vector average of the two physical component speeds (Yo & Wilson, 1992).
Unsurprisingly, ANOVA revealed a highly significant effect of surround modulation (F2,15 = 66.9, p << 0.01), and t‐tests comparing each surround condition to the no‐surround baseline were also significant (both t > 6.5, both p < 0.001).
The negative direction shift, caused by a same‐direction surround, is consistent with a reduction in the effective speed of the fixed component to around 0.5deg/sec (see the speed axes in Figure 5). Similarly, the positive direction shift is consistent with an increase in component speed of up to 1.5deg/sec. These values approximate the magnitude and direction of the perceived speed shifts measured in Experiment I. We note that the positive direction shift is smaller, most likely because the surround also increases the perceived speed of the variable component, to which it is orthogonal (see Figure 1).
We also calculated predictions based on the data in Figure 1 for each of the three subjects that participated in that experiment. We used the data points at 0, 90 and 180º surround orientation to estimate perceived direction for a plaid with these physical speeds (Note: we used the vector averaging model (Yo & Wilson, 1992),
however for the present situation the predictions of the intersection of constraints model (Adelson & Movshon, 1982) are identical). The average (±1SE) is shown by the dashed horizontal lines labelled ‘Prediction’ in Figure 5B. It is clear that the predictions are quantitatively similar to the empirical results, which supports the conclusion that the direction shifts are a consequence of changes in perceived speed.
6 Discussion
6.1 Relative motion
Previous studies (i.e. Nakayama & Loomis, 1974; Norman et al., 1996; Nguyen‐Tri & Faubert, 2007) have proposed (though not always concluded) that changes in perceived speed involve a computation of relative motion between target and background. This is analogous to surround‐ induced changes in perceived luminance (e.g. Adelson, 1993) and contrast (Cannon & Fullenkamp, 1991), and might aid in object segmentation (Nakayama & Loomis, 1974; Gautama & van Hulle, 2001; Shen et al, 2007) or motion contrast discrimination (Watson & Eckert, 1994). Such calculations could also be a consequence of opponent motion processing (e.g. Adelson & Bergen, 1985; Rainville, Makous & Scott‐Samuel, 2002, 2005) or involve a lateral version of motion contrast normalization (Georgeson & Scott‐Samuel, 1999).
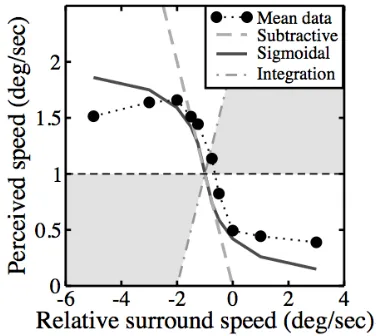
The simplest relative motion computation is the difference between surround and target velocities. This predicts a linear change in perceived speed with surround speed (dashed grey line in Figure 6) which describes the averaged Experiment I data (black circles) surprisingly well for slow to mid‐range speeds. However, the data peel away from the linear prediction at faster speeds. Similar saturation can be introduced if the subtractive term is a compressive nonlinear function of surround speed:
Vp = Vc – (Vr/(s + |Vr|) (1)
where Vp is perceived velocity, Vc is centre velocity, Vr is surround velocity, and s is a constant. For suitable values of s (here
s=0.7, which gives a reasonable approximation by eye), this equation provides a good qualitative description (continuous grey function in Figure 6) of the data of Experiment I. Further elaboration, such as weighting the sigmoidal term, varying the value of s, or including exponentiation could account for the discrepancy between the prediction and the data here. However, our purpose here is not to fit a comprehensive or biologically plausible model, but to compare some basic algorithms. We also note that these differencing algorithms are of the same general form as the ‘convexity cells’ proposed by Nakayama & Loomis (1974) for extracting depth information from a velocity field.
F Figure 6: Data of Experiment I compared to the predictions of three simple models. The data (black circles) were averaged across spatial frequency and observer. The true speed for all conditions is given by the horizontal dashed line. Other functions are the predictions of three algorithms as described in the text.
For comparison, an integration prediction is also shown in Figure 6 (dash‐dotted right‐ oblique line). This was obtained by averaging centre and surround speeds, and clearly fails to predict our results. Fractional weighting of the surround speed in this scheme produces alternative predictions that lie in the grey shaded region, and are also very poor.
6.2 Perceived contrast of target
[image:10.595.312.500.82.250.2]
The results of Experiment III indicate that moving surrounds affect grating speed before pattern direction is computed. This is the first study we are aware of which reports changes in plaid direction produced by motion outside of the plaid region. However, it is well known that plaid direction can be influenced by adaptation. Adapting to one plaid component reduces its perceived speed, and shifts perceived direction towards the other component (Derrington & Suero, 1991). For Type II plaids, which have multiple perceivable pattern directions (e.g. Ferrera & Wilson, 1990), adapting to one pattern direction (using a grating) favours the other plaid percept (Bowns & Alais, 2006). In preliminary experiments, we have found that Type II plaids also show surround‐ induced direction shifts, which are well predicted by the perceived component speeds. We hope to pursue this work further in the future.
Recent work has demonstrated that plaid direction is not determined by contrast‐ mediated perceived speed changes (Champion, Hammett & Thompson, 2007) as had previously been suggested (Stone et al., 1990). Our data do not contradict this result, which serves as further evidence that the surround‐induced perceived speed shifts are not related to speed mis‐ estimation at low contrast (see section 6.2 above). However, our findings do support a more general conclusion of Stone et al. (1990), namely that plaid direction can be determined by perceived, rather than physical component speeds.
As mentioned in the Introduction, the two‐ stage account of pattern motion integration is controversial. Alternative explanations for plaid motion perception include tracking features of the plaid pattern, such as luminance ‘blobs’ (Bowns, 1996; Georgeson
Dakin & Mareschal, 2000; Braddick, Wishart & Curran, 2002). For centre‐surround configurations using gratings, the centre direction can shift by up to 30º (Kim & Wilson, 1997). Is it possible that direction repulsion might influence the results of Experiment III, in which plaid direction judgements were made? There are two ways in which this may have occurred – either through repulsion of the pattern motion itself, or via a direction shift of one or both of the plaid components.
Repulsion of the pattern motion could occur if perceived direction were determined by feature‐tracking of luminance ‘blobs’, which move directly upwards in our stimuli when component speeds are equal. This might produce a repulsive effect in the perceived direction when the surround moved obliquely upwards, as the angle between surround and ‘blob’ directions was 45º and this produced the largest effects for Kim & Wilson (1997). We note, however, that Kim & Wilson’s effects were not observed when the spatial frequencies of centre and surround differed greatly (see their Figure 6), as here (centre components = 1c/deg, ‘blobs’ = 0.7c/deg, surround = 4c/deg).
all PSEs remaining within 1º of the veridical grating motion.
The results of the control experiment also make it unlikely that repulsion effects influenced the perceived direction (rather than the speed) of individual components, which in turn affected plaid direction. Such an account would predict equal but opposite shifts of the variable‐speed component direction for the two surround directions (as the variable‐speed component was orthogonal to both surrounds). This would be expected to produce equally large shifts in plaid direction, yet our results are clearly asymmetrical in magnitude (see Figure 5B).
In summary, based on previous studies and our control data, direction repulsion is unlikely to fully explain either the magnitude or qualitative pattern of our results. It is still possible that such effects do contribute to our empirical results, but the close correspondence between the empirical data and our prediction based on perceived speed results (dashed lines in Figure 5B) suggests that such contributions are probably small.
6.5 Rotational motion
Whilst revising this paper, we became aware of a related study using rotating stimuli (Wertheim & Paffen, in press). These authors measured perceived speed of a rotating row of dots using the method of adjustment. The background was a radial grating, which rotated at a range of speeds, in either the same or opposite direction to the target. The perceived target speed followed a sigmoidal function of background velocity, similar to the results of our Experiment I (Figure 3). It is interesting that our findings generalise to rotational motion, and reassuring to see the same pattern replicated using a different experimental paradigm.
6.6 Where do surround motion effects occur?
Two recent studies (Churan, Richard & Pack, 2009; Aaen‐Stockdale et al., 2009) have raised the possibility that the impairment in motion direction discrimination with increasing area reported at high contrasts (Tadin et al., 2003) may not be due to surround suppression in area V5/MT as previously suggested. This is because surround‐
suppressed MT neurons are only dominant under transient conditions (i.e. durations <100ms; Churan, Khawaja, Tsui & Pack, 2008), yet similar psychophysical effects are found using a modified (counterphasing) stimulus presented for much longer durations (Aaen‐Stockdale et al., 2009). One consequence of this is that true MT surround suppression may only be apparent psychophysically at very brief durations for transient stimuli (Churan et al., 2009). However, Aaen‐Stockdale et al. (2009) also show that most of the effects previously attributed to surround suppression can be accounted for by differences in the supra‐ threshold contrast of the stimuli.
Our stimuli were also presented for long durations (1s), well beyond the period during which centre‐surround neurons dominate the MT response (<100ms; Churan et al., 2008). This suggests that the modulatory processes responsible for our effects may lie outside of area MT. The finding that perceived plaid direction is affected by surround motion points to an earlier locus, as does evidence that surround motion influences dominance during binocular rivalry (Paffen et al., 2004; Baker & Graf, 2008), given that rivalry alternations have been observed as early as V1 (e.g. Tong & Engel, 2001). We point out that centre‐surround units at an early stage can in principle be combined to form later units with larger receptive fields which may or may not themselves exhibit measurable surround suppression (i.e. the two populations of cells identified by Churan et al., 2008). Thus, the existence of contextual modulation at an early stage in processing does not necessarily conflict with its apparent absence at a later stage.
Precisely how direction discrimination deficits relate to shifts in perceived speed is not yet clear, and they may well prove to be mediated by common mechanisms. Although surround effects on direction discrimination are usually studied by increasing the diameter of the target stimulus (meaning that there is no distinct surround region), Tadin, Lappin & Blake (2006) report similar results using a central target surrounded by drifting noise, much like in our paradigm. Future studies, perhaps involving detailed computational modelling, might aim to produce a unified account of surround motion effects.
implications for common tasks such as driving (i.e. estimating another vehicle’s speed; Gray & Regan, 2005) which could be assessed in future applied work.
8 Acknowledgements
We thank Mark Edwards for helpful discussions, and two reviewers for their invaluable suggestions. Supported by BBSRC Grant BB/E012698/1.
References
Aaen‐Stockdale, C.R., Thompson, B., Huang, P‐C. & Hess, R.F. (2009) Low‐level mechanisms may contribute to paradoxical motion percepts. J Vis, 9(5):9.
Adelson, E.H. & Bergen, J.R. (1985) Spatiotemporal energy models for the perception of motion. J Opt Soc Am A, 2: 284‐ 299.
Adelson, E.H. & Movshon, J.A. (1982) Phenomenal coherence of moving visual patterns. Nature, 300: 523‐525.
Adelson, E.H. (1993) Perceptual organization and the judgment of brightness. Science,
262: 2042‐2044.
Albrecht, D.G. & Geisler, W.S. (1991) Motion selectivity and the contrast‐response function of simple cells in the visual cortex.
Vis Neurosci, 7: 531‐546.
Albrecht, D.G. & Hamilton, D.B. (1982) Striate cortex of monkey and cat: contrast response function. J Neurophysiol, 48: 217‐237. Allman, J. Miezin, F. & McGuinness, E. (1985a)
Direction‐ and velocity‐specific responses from beyond the classical receptive field in the middle temporal visual area (MT).
Perception, 14: 105‐126.
Allman, J. Miezin, F. & McGuinness, E. (1985b) Stimulus specific responses from beyond the classical receptive field: neurophysiological mechanisms for local‐ global comparisons in visual neurons. Ann Rev Neurosci, 8: 407‐430.
rivalry. J Vis, 8(4):26.
Baker, D.H. & Graf, E.W. (2009) On the relation between dichoptic masking and binocular rivalry. Vision Res, 49: 451‐459.
Betts, L.R., Taylor, C.P., Sekuler, A.B. & Bennett, PJ. (2005) Aging reduces center‐surround antagonism in visual motion processing.
Neuron, 45: 361‐366.
Blakemore, M.R. & Snowden, R.J. (2000) Textured backgrounds alter perceived speed. Vision Res, 40: 629‐638.
Born, R.T. (2000) Center‐surround interactions in the middle temporal visual area of the owl monkey. J Neurophysiol, 84: 2658‐2669. Bowns, L. & Alais, D. (2006) Large shifts in
perceived motion direction reveal multiple global motion solutions. Vision Res, 46: 1170‐1177.
Bowns L. (1996) Evidence for a feature tracking explanation of why type II plaids move in the vector sum direction at short durations.
Vision Res, 36: 3685‐3694.
Braddick, O.J., Wishart, K.A. & Curran, W. (2002). Directional performance in motion transparency. Vision Res, 42: 1237‐1248. Brainard, D.H. (1997) The Psychophysics
Toolbox. Spat Vis, 10: 433‐436.
Bressan, P. (1991) A context‐dependent illusion in the perception of velocity. Vision Res, 31: 333‐336.
Cannon, M.W. & Fullenkamp, S.C. (1991) Spatial interactions in apparent contrast: inhibitory effects among grating patterns of different spatial frequencies, spatial positions and orientations. Vision Res, 31: 1985‐1998. Cass, J.R. & Spehar, B. (2005) Dynamics of
cross‐ and iso‐surround facilitation suggest distinct mechanisms. Vision Res, 45: 3060‐ 3073.
Champion, R.A., Hammett, S.T. & Thompson, P.G. (2007) Perceived direction of plaid motion is not predicted by component speeds. Vision Res, 47: 375‐383.
Churan, J., Khawaja, F.A., Tsui, J.M.G. & Pack, C.C. (2008) Brief motion stimuli preferentially activate surround‐suppressed neurons in macaque visual area MT. Curr Biol, 18: R1051‐1052.
Churan, J., Richard, A.G. & Pack, C.C. (2009) Interaction of spatial and temporal factors in psychophysical estimates of surround suppression. J Vis, 9(4):15.
Dakin, S.C. & Mareschal, I. (2000) The role of relative motion computation in 'direction repulsion'. Vision Res, 40: 833‐841.
Derrington, A.M. & Suero, M. (1991) Motion of complex patterns is computed from the perceived motions of their components.
Vision Res, 31: 139‐149.
Derrington, A.M., Badcock, D.R. & Holroyd, S.A. (1992) Analysis of the motion of 2‐ dimensional patterns: evidence for a second‐order process. Vision Res, 32: 699‐ 707.
Eifuku, S. & Wurtz, R.H. (1998) Response to motion in extrastriate area MST1: center‐ surround interactions. J Neurophysiol, 80: 282‐296.
Falkenberg, H.K. & Bex, P.J. (2007) Contextual modulation of the motion aftereffect. J Exp Psych: HPP, 33: 257‐270.
Ferrera, V.P. & Wilson, H.R (1990) Perceived direction of moving two‐dimensional patterns. Vision Res, 30: 273‐287.
Field, D.J., Hayes, A. & Hess, R.F. (1993) Contour integration by the human visual system: evidence for a local "association field".
Vision Res, 33: 173‐193.
Finney, D.J. (1971) Probit Analysis. Cambridge University Press.
Frost, B.J. & Nakayama, K. (1983) Single visual neurons code opposing motion independent of direction. Science, 220: 744‐745.
Gautama, T. & van Hulle, M.M. (2001) Function of center‐surround antagonism for motion in visual area MT/V5: a modeling study.
Vision Res, 41: 3917‐3930.
Gegenfurtner, K.R. & Hawken, M.J. (1996) Perceived velocity of luminance, chromatic and non‐Fourier stimuli: influence of contrast and temporal frequency. Vision Res,
36: 1281‐1290.
Georgeson, M.A. & Scott‐Samuel, J.E. (1999) Motion contrast: a new metric for direction discrimination. Vision Res, 39: 4393‐4402. Gogel, W.C. & McNulty, P. (1983) Perceived
velocity as a function of reference mark density. Scand J Psych, 24: 257‐265.
Gray, R. & Regan, D.M. (2005) Perceptual processes used by drivers during overtaking in a driving simulator. Hum Factors, 47: 394‐417.
Hammond, P. & MacKay, D.M. (1981) Modulatory influences of moving textured backgrounds on responsiveness of simple cells in feline striate cortex. J Physiol, 319: 431‐442.
Harris, M.G. (1986) The perception of moving stimuli: a model of spatiotemporal coding in human vision. Vision Res, 26: 1281‐1287. Heeger, D.J. (1992) Normalization of cell
responses in cat striate cortex. Vis Neurosci,
9: 181‐197.
Hildreth, E.C. & Koch, C. (1987) The analysis of visual motion: from computational theory to neuronal mechanisms. Ann Rev Neurosci, 10: 477‐533.
Huang, P‐C., Hess, R.F. & Dakin, S.C. (2006) Flank facilitation and contour integration: different sites. Vision Res, 46: 3699‐3706. Hupé, J.M. & Rubin, N. (2003) The dynamics of
bi‐stable alternation in ambiguous motion displays: a fresh look at plaids. Vision Res,
43: 531‐548.
Ido, K., Ohtani, Y. & Ejima, Y. (1997) Dependencies of motion assimilation and motion contrast on spatial properties of stimuli: spatial‐frequency nonselective and selective interactions between local motion detectors. Vision Res, 37: 1565‐1574. Ishikawa, A., Shimegi, S. & Sato, H. (2006)
Metacontrast masking suggests interaction between visual pathways with different spatial and temporal properties. Vision Res,
46: 2130‐2138.
Jones, H.E., Grieve, K.L., Wang, W. & Sillito, A.M. (2001) Surround suppression in primate V1. J Neurophysiol, 86: 2011‐2028.
Kim, J. & Wilson, H.R. (1993) Dependence of plaid motion coherence on component grating directions. Vision Res, 33: 2479‐ 2489.
Kim, J. & Wilson, H.R. (1997) Motion integration over space: interaction of the center and surround motion. Vision Res, 37: 991‐1005. Levitt, J.B. & Lund, J.S. (1997) Contrast
dependence of contextual effects in primate visual cortex. Nature, 387: 73‐76.
Li, A.S., Mollon, J.D. & Bosten, J.M. (2009) The tuning of simultaneous motion contrast and of motion adaptation. Perception, 38(S): 91. Loomis, J.M. & Nakayama, K. (1973) A velocity
analogue of brightness contrast. Perception,
2: 425‐427.
Majaj, N.J., Carandini, M. & Movshon, J.A. (2007) Motion integration by neurons in macaque MT is local, not global. J Neurosci, 27: 366‐ 370.
Marshak, W. & Sekuler, R. (1979) Mutual repulsion between moving visual targets.
Meese, T.S. (1995) Using the standard staircase to measure the point of subjective equality: a guide based on computer simulations.
Percept Psychophys, 57: 267‐281.
Meese, T.S., Challinor, K.L., Summers, R.J. & Baker, D.H. (2009) Suppression pathways saturate with contrast for parallel surrounds but not superimposed cross‐ oriented masks. Vision Res, 49: 2927‐2935. Meese, T.S., Summers, R.J., Holmes, D.J. & Wallis,
S.A. (2007) Contextual modulation involves suppression and facilitation from the centre and the surround. J Vis, 7(4):7.
Movshon, J.A., Adelson, E.H., Gizzi, M.S. & Newsome, W.T. (1985) The analysis of moving visual patterns. In Pattern Recognition Mechanisms, ed. C. Chagas, R. Gattass, C.Gross (Pontificiae Academiae Scientiarum Scripta Varia 54, 117‐151). Rome: Vatican Press.
Nakayama, K. & Loomis, J.M. (1974) Optical velocity patterns, velocity‐sensitive neurons, and space perception: a hypothesis. Perception, 3: 63‐80.
Nawrot, M. & Sekuler, R. (1990) Assimilation and contrast in motion perception: explorations in cooperativity. Vision Res, 30: 1439‐1451.
Nguyen‐Tri, D. & Faubert, J. (2007) Luminance texture increases perceived speed. Vision Res, 47: 723‐734.
Nishida, S., Edwards, M. & Sato, T. (1997) Simultaneous motion contrast across space: involvement of second‐order motion? Vision Res, 37: 199‐214.
Norman, H.P., Norman, J.F., Todd, J.T. & Lindsey, D.T. (1996) Spatial interactions in perceived speed. Perception, 25: 815‐830.
Pack, C.C., Livingstone, M.S., Duffy, K.R. & Born, R.T. (2003) End‐stopping and the aperture problem: two‐dimensional motion signals in macaque V1. Neuron, 39: 671‐680.
Pack, C.C., Hunter, J.N. & Born, R.T. (2005) Contrast dependence of suppressive influences in cortical area MT of alert macaque. J Neurophysiol, 93: 1809‐1815.
numbers into movies. Spat Vis, 10: 437‐442. Pelli, D.G., Palomares, M. & Majaj, N.J. (2004)
Crowding is unlike ordinary masking: distinguishing feature integration from detection. J Vis, 4: 1136‐1169.
Petrov, Y., Carandini, M. & McKee, S.P. (2005) Two distinct mechanisms of suppression in human vision. J Neurosci, 25: 8704‐8707. Polat, U. & Sagi, D. (1993) Lateral interactions
between spatial channels: suppression and facilitation revealed by lateral masking experiments. Vision Res, 33: 993‐999. Priebe, N.J. & Lisberger, S.G. (2004) Estimating
target speed from the population response in visual area MT. J Neurosci, 24: 1907‐1916. Priebe, N.J., Lisberger, S.G. & Movshon, J.A. (2006) Tuning for spatiotemporal frequency and speed in directionally selective neurons of macaque striate cortex. J Neurosci, 26: 2941‐2950.
Purves, D., Paydarfar, J.A. & Andrews, T.J. (1996) The wagon wheel illusion in movies and reality. Proc Natl Acad Sci USA, 93: 3693‐3697.
Raiguel, S., van Hulle, M.M., Xiao, D.K, Marcar, V.L. & Orban, G.A. (1995) Shape and spatial distribution of receptive fields and antagonistic motion surrounds in the middle temporal area (V5) of the macaque. Eur J Neurosci, 7: 2064‐2082.
Rainville, S.J.M., Scott‐Samuel, N.E. & Makous, W.L. (2002) The spatial properties of opponent‐motion normalization. Vision Res,
42: 1727‐1738.
Rainville, S.J.M., Makous, W.L. & Scott‐Samuel, N.E. (2005) Opponent‐motion mechanisms are self‐normalizing. Vision Res, 45: 1115‐ 1127.
Ramachandran, V.S. & Anstis, S.M. (1983) Perceptual organization in moving patterns.
Nature, 304: 529‐531.
Robson, J.G. (1966) Spatial and temporal contrast‐sensitivity functions of the visual system. J Opt Soc Am, 56: 1141‐1142. Saarela, T.P. & Herzog, M.H. (2008) Time‐
Schwartz, O. & Simoncelli, E.P. (2001) Natural signal statistics and sensory gain control.
Nat Neurosci, 4: 819‐825.
Sengpiel, F., Sen, A. & Blakemore, C. (1997) Characteristics of surround inhibition in cat area 17. Exp Brain Res, 116: 216‐228. Shen, Z‐M., Xu, W‐F. & Li, C‐Y. (2007) Cue‐
invariant detection of centre‐surround discontinuity by V1 neurons in awake macaque monkey. J Physiol, 583: 581‐592. Sillito, A.M. & Jones, H.E. (1996) Context‐
dependent interactions and visual processing in V1. J Physiol Paris, 90: 205‐ 209.
Simoncelli, E.P. & Heeger, D.J. (1998) A model of neuronal responses in visual area MT.
Vision Res, 38: 743‐761.
Smith, M.A., Bair, W. & Movshon, J.A. (2006) Dynamics of suppression in macaque primary visual cortex. J Neurosci, 26: 4826‐ 4834.
Snowden, R.J. & Hammett, S.T. (1998) The effects of surround contrast on contrast thresholds, perceived contrast and contrast discrimination. Vision Res, 38: 1935‐1945. Stone, L.S., Watson, A.B. & Mulligan, J.B. (1990)
Effect of contrast on the perceived direction of a moving plaid. Vision Res, 30: 1049‐ 1067.
Tadin, D., Lappin, J.S., Gilroy, L.A. & Blake, R. (2003) Perceptual consequences of centre‐ surround antagonism in visual motion processing. Nature, 424: 312‐315.
Tadin, D., Lappin, J.S. & Blake, R. (2006) Fine temporal properties of center‐surround interactions in motion revealed by reverse correlation. J Neurosci, 26: 2614‐2622. Tailby, C., Solomon, S.G., Peirce, J.W. & Metha,
A.B. (2007) Two expressions of “surround suppression” in V1 that arise independent of cortical mechanisms of suppression. Vis Neurosci, 24: 99‐109.
Thompson, P. (1982) Perceived rate of movement depends on contrast. Vision Res,
22: 377‐380.
Thompson, P., Brooks, K. & Hammett, S.T. (2006) Speed can go up as well as down at low contrast: implications for models of motion perception. Vision Res, 46: 782‐786. Thompson, B., Aaen‐Stockdale, C., Koski, L. &
Hess, R.F. (2009) A double dissociation between striate and extrastriate visual cortex for pattern motion perception revealed using rTMS. Hum Brain Mapp, 30: 3115‐3126.
Tinsley, C.J., Webb, B.S., Barraclough, N.E., Vincent, C.J., Parker, A. & Derrington, A.M. (2003) The nature of V1 neural responses to
2D moving patterns depends on receptive‐ field structure in the marmoset monkey.
Journal of Neurophysiology, 90: 930‐937. Tong, F. & Engel, S.A. (2001) Interocular rivalry
revealed in the human cortical blind‐spot representation. Nature, 411: 195‐199. Tynan, P. & Sekuler, R. (1975) Simultaneous
motion contrast: velocity, sensitivity and depth response. Vision Res, 15: 1231‐1238. Walker, P. & Powell, D.J. (1974) Lateral
interaction between neural channels sensitive to velocity in the human visual system. Nature, 252: 732‐733.
Walker, G.A., Ohzawa, I. & Freeman, R.D. (1999) Asymmetric suppression outside the classical receptive field of the visual cortex. J Neurosci, 19: 10536‐10553.
Watson, A.B. & Eckert, M.P (1994) Motion‐ contrast sensitivity: visibility of motion gradients of various spatial frequencies. J Opt Soc Am A, 11: 496‐505.
Webb, B.S., Dhruv, N.T., Solomon, S.G., Tailby, C. & Lennie, P. (2005) Early and late mechanisms of surround suppression in striate cortex of macaque. J Neurosci, 25: 11666‐11675.
Webb, B.S., Ledgeway, T. & McGraw, P.V. (2007) Cortical pooling algorithms for judging global motion direction. Proc Natl Acad Sci USA, 104: 3532‐3537.
Webb, B.S., Tinsley, C.J., Barraclough, N.E., Parker, A. & Derrington, A.M. (2003) Gain control from beyond the classical receptive field in primate primary visual cortex. Vis Neurosci, 20: 221‐230.
Welch, L. (1989) The perception of moving plaids reveals two motion‐processing stages. Nature, 337: 734‐736.
Wertheim, A.H. & Paffen, C.L.E. (2009) Centre‐ surround relative motion and the Freezing Rotation illusion. Perception, 38: 1610‐ 1620.
Xiao, D.K., Raiguel, S., Marcar, V. & Orban, G.A. (1998) Influence of stimulus speed upon the antagonistic surrounds of area MT/V5 neurons. Neuroreport, 9: 1321‐1326. Xiao, D.K., Raiguel, S., Marcar, V., Koenderink, J.
& Orban, G.A. (1995) Spatial heterogeneity of inhibitory surrounds in the middle temporal visual area. Proc Natl Acad Sci USA,
92: 11303‐11306.
Xing, J. & Heeger, D.J. (2000) Center‐surround interactions in foveal and peripheral vision.
Vision Res, 40: 3065‐3072.
Yo, C. & Wilson, H.R. (1992) Perceived direction of moving two‐dimensional patterns depends on duration, contrast and eccentricity. Vision Res, 32: 135‐147.